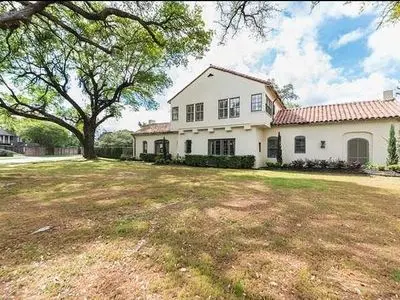
2500 Harrison Ave · Beaumont, TX
Flood risk 6/10 · Moderate
- FEMA flood zone
- X
- Chance of flooding over 30 yrs
- 0.73%
- Est. flood insurance / yr
- $507 – $1,088
Fire risk 1/10 · Minimal
- Est. fire insurance / yr
- $1,222 – $2,270
Heat risk 9/10 · Severe
- Hot days now (above 109°F)
- 7 days/yr
- Hot days in 30 yrs
- 24 days/yr
Wind risk 9/10 · Severe
- Chance of severe wind over 30 yrs
- 99.0%
Air-quality risk 2/10 · Minimal
- Unhealthy air days now
- 1 days/yr
- Unhealthy air days in 30 yrs
- 1 days/yr
Risk factors via First Street. Map © Google.
Why this score? — see what drove the D grade
The composite is a weighted blend of 9 inputs, each scored 0–100. Each bar is that input's sub-score; the figure is the points it added to the 100-point composite (weight × sub-score).
- Cash flow +16.6/30.0
- ARV discount +7.5/15.0
- DSCR +5.2/10.0
- 1% rule +4.2/10.0
- Livability +3.2/5.0
- Rent growth +2.5/5.0
- Condition / age +2.5/5.0
- Schools +1.5/10.0
- Appreciation +0.0/10.0
$650,000
🖨 Deal sheet (PDF) 📄 Offer letter ✓ Due diligence
Listing remarks MLS
One of the most unique and eye catching homes in Beaumont, this Spanish Colonial estate is beautifully located in the Oaks Historic District and showcases timeless character and architectural distinction throughout. From the moment you step inside, the craftsmanship is undeniable with large wooden beams, arched doorways, thick wooden plank doors, iron light fixtures, and wide plank hardwood floors. The spacious kitchen is filled with natural light from expansive windows overlooking an estate sized lot with grand, mature live oak trees. It features Thermador double ovens, a Jenn Air six burner cooktop, stainless steel column refrigerator and freezer, a double pantry with a moving shelf system, and a charming butler’s pantry that makes the space ideal for entertaining. The formal dining room is a true showpiece with a striking curved vaulted wall and ceiling. Generous living areas include a large living room and an adjoining sunroom, offering flexibility and charm throughout this home.
Key facts
- Spanish tile floors
- Iron light fixtures
- Large plank doors
Tags
Property features AI
Exterior
- Home design: Built in 1968; Single property (details on stories and entry level not provided)
- Construction: Originally constructed in 1968
- Exterior features: Located in the Oaks Historic District
Neighborhood map
What this means for you Summary
Snapshot
- This is a 5-bed/4.0-bath single-family listed at $650k.
Deal economics
- At list price, monthly cash flow is $397 ($5k/yr) — positive.
- The deal already cash-flows at list — no discount required.
- To meet the 1% rule (rent ≥ 1% of price), the offer needs to be $600k (7.7% below list).
- Recommended offer: $600k (7.7% below list) — sets the bar for 1% rule.
- Cap rate 7.0% vs local median 5.3% in Beaumont — top-decile yield for the area; either an underpriced asset or a hidden risk that comps aren't pricing in. Stress-test before assuming the spread holds.
Location & tenants
- Location reads 64/100 on livability (#739 in TX) — a middle-class / working-renter tenant base. Strengths: cost of living A+, housing A+, health & safety A+; Watch: employment D, crime F, amenities F.
- Beaumont ISD (urban): math 14% / reading 22% proficiency, ranked #789 of 826 in TX (top 96%) — low school quality limits family demand, transient renter base, plan for 1-2y turnover; 69% free/reduced lunch — lower-income household profile, screen leases tightly.
- Zoned schools: Caldwood El (math 13% / reading 20%, grade F, #3,946 of 4,322 statewide, top 92%, 553 students, 89% FRL); Odom Middle (math 30% / reading 42%, grade F, #805 of 1,662 statewide, top 50%, 709 students, 73% FRL); West Brook Sr H S (math 19% / reading 34%, grade F, #1,228 of 1,632 statewide, top 76%, 2,245 students, 58% FRL) — zoned schools at 73% FRL track the district average.
- Market conditions: 26 active listings in the ZIP; 1 comparable units currently listed for rent nearby; 343 units permitted in Jefferson County in 2024 (0 in 5+ unit buildings).
Forward outlook
- Local home prices are declining (-3.0%/yr); year-one equity from $4k of loan paydown is wiped out by about $20k of value loss. Plan a longer hold.
Negotiation context
- It's been on market 20 days — a 2% lower offer ($640k) is reasonable based on typical stale-listing flexibility.
- 4 sale attempts since 10y ago with the ask held roughly flat each time — persistent listings suggest the price (not the market) is what's stuck; bring a comps-based counter.
Risks & watch-outs
- Climate carrying-cost: major flood risk; severe wind risk, 99% chance of damaging wind over 30y; extreme-heat days projected 7→24/yr by 2055 (HVAC capex compounding) — expect insurance premiums to compound above CPI over the hold.
Questions for the listing agent
- Built in 1968 — when were the roof, HVAC, electrical panel, plumbing, and water heater last replaced?
- Is there a deadline driving the sale (1031 exchange, divorce, estate, relocation)? That informs how much negotiation room exists.
- Schools are D-rated, which usually means shorter tenancies and higher turnover. Who's the typical renter profile here, and what's been the actual vacancy rate?
- Crime grade is F in this area — have there been break-ins, vandalism, or insurance claims at this property in the last 3 years? What carrier currently insures it and at what premium?
- The area grade is low — what's the realistic commute time and amenity access for the typical tenant pool here? Any planned neighborhood developments (good or bad) we should know about?
- What's the average days-on-market for RENTAL listings here right now (not sales)? A rising rental-DOM trend means longer vacancies and softer asking-rent achievability than the comps imply.
- What's the recent tenant-quality profile in this submarket — average credit score on applications, eviction rate, late-payment / NSF rate, and stable-employment percentage? A property-management company in the area should have these aggregated.
- How much new for-sale + rental construction is in the pipeline within 1–3 miles? Heavy new supply typically softens prices + rents 12–24 months out; constrained supply supports both.
Investment metrics
- 1% rule
- 0.92% ✗
- Cap rate
- 7.03%
- Cash-on-cash
- 2.62%
- DSCR
- 1.12
- GRM
- 9.0
CMA / ARV
No comps found within radius.
Projected returns pro-forma
-3.0% appreciation · 3.0% rent growth · sell at horizon
- IRR
- -12.2%
- Equity multiple
- 0.56×
- Total profit
- $-80,017
- Equity at exit
- $96,917
- IRR
- -3.0%
- Equity multiple
- 0.80×
- Total profit
- $-37,089
- Equity at exit
- $56,200
Cash invested: $182,000 (down + closing). Projections, not guarantees.
Landlord ↔ Tenant lean methodology
- Overall (STATE)
- 87 Strongly Landlord-Friendly
- State Texas
- 87 Strongly Landlord-Friendly · R+5
- County
- — inherits STATE
- City
- — inherits STATE
ZIP-level market 77702
- Home prices YoY
- -25.3%
- Active inventory
- 26
- Price-to-rent
- 9.0×
Monthly cashflow live
- Estimated rent
- $6,000 medium interval (Pro) →
- Mortgage (P&I)
- −$3,409
- Tax from tax record
- −$663 /mo · $7,957/yr
- Insurance
- −$271
- HOA
- −$0
- Vacancy / Maint / Mgmt
- −$1,260
- Net cashflow
- $397
Break-even live
Sensitivity live
| Price | -10% $765 | -5% $581 | +0% $397 | +5% $213 | +10% $29 |
|---|---|---|---|---|---|
| Rent | -10% $-77 | -5% $160 | +0% $397 | +5% $634 | +10% $871 |
| Rate | -1.0pp $725 | -0.5pp $563 | base $397 | +0.5pp $229 | +1.0pp $58 |
UW: 25.0% down · 7.5% · 30yr · 1.5% tax · 5.0% vac · 8.0% maint · 8.0% mgmt
Financing live
Cash to close
- Down payment
- $162,500
- Closing costs
- $19,500
- Reserves months
- —
- Total cash needed
- —
Loan-product check · same deal, 3 products live
Conventional
25% down · 7.5% · 30yr
- Down + closing
- —
- Monthly P&I
- —
- Monthly cashflow
- —
- DSCR
- —
- Eligible?
- —
Personal DTI + credit; lowest rate.
DSCR
20% down · 8.5% · 30yr
- Down + closing
- —
- Monthly P&I
- —
- Monthly cashflow
- —
- DSCR
- —
- Eligible?
- —
No personal income docs; deal must DSCR.
Hard money
10% down · 12.0% · 12mo
- Down + closing
- —
- Monthly P&I
- —
- Monthly cashflow
- —
- DSCR
- —
- Eligible?
- —
Short-term bridge; refi at stabilization.
Rent comps 1 comps
| Address | Beds | Baths | Sqft | Rent | $/sqft | DOM | Units | Dist |
|---|---|---|---|---|---|---|---|---|
| 1001 W Lucas Dr Beaumont, TX | 4.0 | 4.5 | 5127 | $6,000 | $1.17 | 45d | 1 | 1.40mi |
Listing history 14 events
-
2026-06-21days on market $650,000 Active 20 DOM
-
2026-06-18days on market $650,000 Active 17 DOM
-
2026-06-17days on market $650,000 Active 16 DOM
-
2026-06-16days on market $650,000 Active 15 DOM
-
2026-06-15days on market $650,000 Active 14 DOM
-
2026-06-14days on market $650,000 Active 12 DOM
-
2026-06-13days on market $650,000 Active 11 DOM
-
2026-06-10days on market $650,000 Active 9 DOM
-
2026-06-09days on market $650,000 Active 8 DOM
-
2026-06-08days on market $650,000 Active 7 DOM
-
2026-06-07days on market $650,000 Active 6 DOM
-
2026-06-03days on market $650,000 Active 2 DOM
-
2026-06-01remarks 699-char remark
-
2026-06-01$650,000 Active 1 DOM
ⓘ Source: listings_history table (triggers on properties + properties_extension) + one-shot
backfill from property_details.listing_events for pre-trigger history.
Tax reassessment forecast TX · Resets to sale price
- Current annual tax
- $7,957 · $663/mo
- Projected year-2 tax
- $11,895 · $991/mo
- Expected delta
- +$3,938/yr (+$328/mo · 49.5%)
ⓘ Screening estimate from a state-policy table — verify with the county assessor before closing.
Climate risk First Street
- Flood 6/10 Major FEMA zone X · 73% chance over 30 yrs
- Wildfire 1/10 Low
- Heat 9/10 Extreme 7 d/yr ≥109°F today · 24 d/yr by 30 yrs out
- Wind 9/10 Extreme 99% chance of damaging wind over 30 yrs
- Air quality 2/10 Low 1 unhealthy d/yr today · 1 by 30 yrs out
Nearby sold comps map
Loading sold comps map…
Walkable amenities ~0.75 mi
Loading nearby amenities…
Taxation est. · year 1
- Rental income
- $72,000
- − Mortgage interest
- −$36,410
- − Property taxes
- −$7,957
- − Insurance
- −$3,250
- − Repairs & maintenance
- −$5,760
- − Management
- −$5,760
- − Depreciation
- −$18,909
- Taxable loss
- −$6,046
- Est. tax savings @ 24.0%
- +$1,451
- After-tax cash flow
- $6,220/yr
For passive investors: Depreciation is non-cash, so a rental often shows a tax loss while cash-flowing — sheltering income. Rental losses are passive: they offset passive income freely, and up to $25,000/yr can offset ordinary (W-2) income if you actively participate and your MAGI is under $100k (phasing out to $0 by $150k); unused losses carry forward. On sale, claimed depreciation is recaptured at up to 25%, and gains may owe capital-gains tax (a 1031 exchange can defer both). Figures are a year-1 estimate at your 24.0% rate — not tax advice; consult a CPA.
Schools (NCES district)
- District
- Beaumont ISD
- NCES district ID
- 4809670
- Math proficiency
- 14% ▼ -13.00%
- Reading proficiency
- 22% ▼ -7.00%
- Median HH income
- $41,683
- Composite
- 15.43/100
- National rank
- #9316
- State rank
- #789 of 826 in TX
Livability — Beaumont
- Score
- 64/100
- State rank
- #739
- US rank
- #13710
Category grades
Schools grade is shown separately in the Schools card above.
Census & demographics
- Census place
- Beaumont, TX
- City population
- 125,901
- Population (ZIP)
- 3,497
Population outlook (Jefferson County) Hauer SSP2
- Today (2025)
- 259,015 people
- By 2030
- 260,685 · +0.6%
- By 2040
- 263,309 · +1.7%
- By 2050
- 265,237 · +2.4%
- By 2075
- 270,193 · +4.3%
- By 2100
- 255,628 · -1.3%
Race, ethnicity, and origin ACS 2023
- Neighborhood character
- Highly diverse neighborhood (Simpson 0.73)
- Race & ethnicity
- Black 31% Hispanic / Latino 30% White 27% Two or more races 18% Asian 8%
- Hispanic origin (detail)
- Mexican 28%
- Common ancestry
- Lithuanian 2% Slovak 2% Serbian 1%
- Foreign-born
- 21% · Canada
- Languages at home
- 73% English-only · Spanish 25% Arabic 1%
Political lean MEDSL · Jefferson
- 2024 margin
- Lean R (+8.9) · D 45.1% · R 54.0%
- 2008→2024 swing
- -11.1pp toward R · 2008: 2.2pp · 2024: -8.9pp
- All cycles
- 2024: R+8.9 2020: R+1.6 2016: R+0.5 2012: D+1.6 2008: D+2.2
Not yet ingested
- Civics
- —
Market trends
- HPI YoY
- ▼ -46.58%
- Current HPI
- 137.5454
- Rent YoY
- —
- Metro
- —
- State GDP YoY
- ▲ 3.95%
- F500 in state
- 110
Industry mix (Fortune 500 HQ in TX)
| Industry | F500 HQs | Revenue |
|---|---|---|
| Energy | 16 | $1,198B |
|
||
| Technology | 5 | $198B |
|
||
| Engineering / Construction | 4 | $72B |
|
||
| Energy Services | 3 | $60B |
|
||
| Utilities | 3 | $41B |
|
||
| Healthcare | 2 | $330B |
|
||
Price history
+160.0% since first listed14 events — show timeline
- 2026-06-01 Listed $650,000 FSBO.com
- 2026-03-27 Sold (Public Records) — Public Records
- 2026-03-25 Sold (MLS) — BBOR
- 2026-02-24 Pending — BBOR
- 2026-01-21 Price Changed $365,000 BBOR
- 2025-12-31 Listed $400,000 BBOR
- 2018-08-13 Sold (Public Records) — Public Records
- 2018-08-08 Sold (MLS) — BBOR
- 2018-06-27 Listed $340,000 BBOR
- 2016-10-13 Sold (Public Records) — Public Records
- 2016-10-13 Sold (MLS) — BBOR
- 2016-08-30 Listed $250,000 BBOR
- 2007-09-17 Sold (Public Records) — Public Records
- 2004-07-15 Sold (Public Records) — Public Records
Property tax history
-0.3%/yrLatest (2025): $7,957 · -5.9% YoY. Source: county tax records.
Cash-flow waterfall
monthlySold comps — $/sqft
last 12 mo · ≤1 miLoading sold comps…