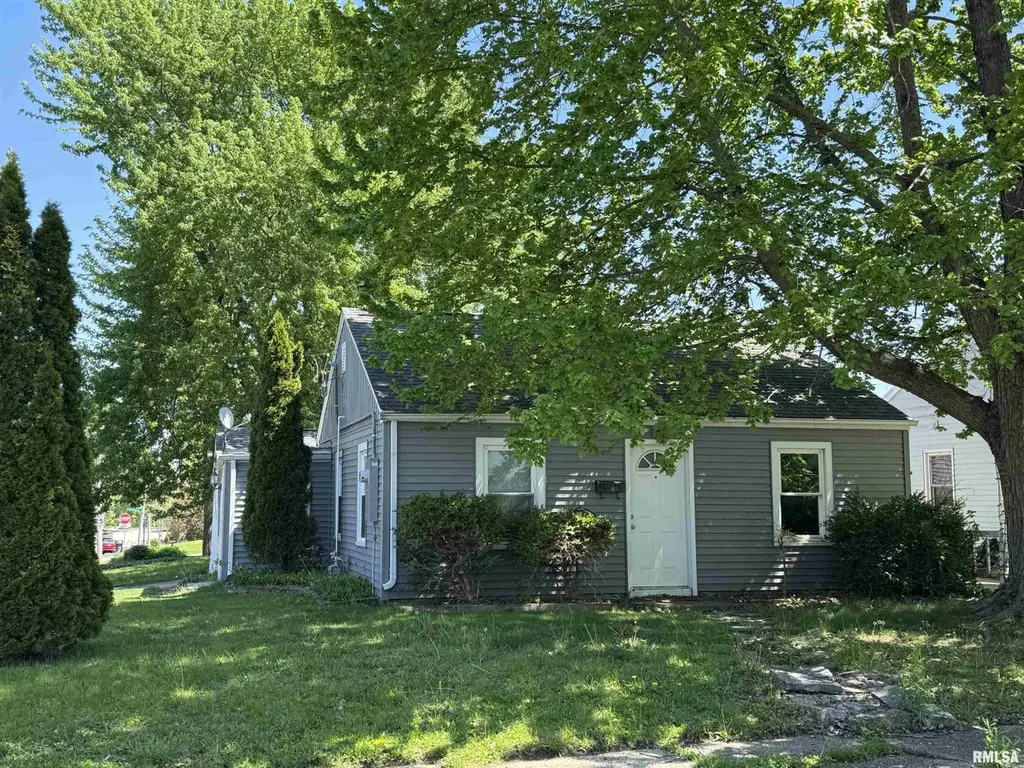
4216 N Ashton Ave · Peoria, IL
Flood risk 1/10 · Minimal
- FEMA flood zone
- X
- Chance of flooding over 30 yrs
- 0.0%
- Est. flood insurance / yr
- $507 – $1,088
Fire risk 1/10 · Minimal
- Est. fire insurance / yr
- $804 – $1,492
Heat risk 3/10 · Minor
- Hot days now (above 104°F)
- 7 days/yr
- Hot days in 30 yrs
- 18 days/yr
Wind risk 2/10 · Minimal
- Chance of severe wind over 30 yrs
- 1.0%
Air-quality risk 3/10 · Minor
- Unhealthy air days now
- 1 days/yr
- Unhealthy air days in 30 yrs
- 3 days/yr
Risk factors via First Street. Map © Google.
Why this score? — see what drove the C grade
The composite is a weighted blend of 9 inputs, each scored 0–100. Each bar is that input's sub-score; the figure is the points it added to the 100-point composite (weight × sub-score).
- Cash flow +22.6/30.0
- DSCR +7.2/10.0
- ARV discount +7.0/15.0
- 1% rule +6.2/10.0
- Rent growth +5.0/5.0
- Livability +3.7/5.0
- Condition / age +2.5/5.0
- Schools +1.1/10.0
- Appreciation +0.0/10.0
$105,000
🖨 Deal sheet 📄 Offer letter ✓ Due diligence
Listing remarks
Renter occupied home for sale that is soon available for OWNER occupied potential at end of May. Rent was 1,000 per month which is 12k per year of passive income just blocks away from the activity of downtown Peoria Heights if you want to return this home to investment opportunity. Discover this delightful 2-bedroom, 1-bathroom ranch home with tons of potential. Home needs 48 hours for showings due to tenant occupied, and maybe more depending on moving, work, and personal schedule.
Key facts
- 3,750 sq ft lot
- Garage
- Built 1945
Property features AI
Finance
- HOA & community: No association fee
Exterior
- Parking: Attached 1-car garage
- Utilities: Public water; Public sewer
- Home design: Single-family residence; Built in 1945; Single-story living area noted (multiple levels referenced: main, upper, lower, basement, additional level)
- Construction: Year built 1945
- Exterior features: Corner lot; Shingle roof
Interior
- Kitchen: Kitchen on main level (approx. 13' x 9')
- Bedrooms: 2 bedrooms (both on the main level) — approx. 12' x 11' and 11' x 11', each with egress windows
- Flooring: Carpet in bedrooms; Vinyl in living room and family room; Laminate in kitchen
- Bathrooms: 1 full bathroom
- Heating & cooling: Central air conditioning; Forced air heating
- Interior features: No basement; No fireplaces; Central air; Forced air heating
Neighborhood map
What this means for you Summary
Snapshot
- This is a 2-bed/1.0-bath single-family listed at $105k.
Deal economics
- At list price, monthly cash flow is $178 ($2k/yr) — positive.
- The deal already cash-flows at list — no discount required.
- Meets the 1% rule at list price ($1k rent vs $105k).
- Recommended offer: $102k (3.0% below list) — sets the bar for market timing.
- Cap rate 8.3% vs local median 5.6% in Peoria — top-decile yield for the area; either an underpriced asset or a hidden risk that comps aren't pricing in. Stress-test before assuming the spread holds.
Location & tenants
- Location reads 73/100 on livability (#270 in IL) — a middle-class / working-renter tenant base. Strengths: commute A+, cost of living A+, housing A+; Watch: employment D+, crime F.
- Peoria SD 150 (urban): math 11% / reading 14% proficiency, ranked #554 of 620 in IL (top 89%) — low school quality limits family demand, transient renter base, plan for 1-2y turnover; 70% free/reduced lunch — lower-income household profile, screen leases tightly.
- Zoned schools: Peoria High School (math 4% / reading 7%, grade F, #609 of 693 statewide, top 88%, 1,447 students, 0% FRL) — zoned schools average 0% FRL vs 70% district-wide (70 pts lower); this property's tenant base skews higher-income than the district average.
- Market conditions: Rents rising fast (+10.3%/yr); 150 active listings in the ZIP; 12 comparable units currently listed for rent nearby; rentals leasing fast (median 14d on market — plan ~1-2 weeks tenant-placement turnaround); 73 units permitted in Peoria County in 2024 (0 in 5+ unit buildings).
Forward outlook
- Local home prices are declining (-3.0%/yr); year-one equity from $726 of loan paydown is wiped out by about $3k of value loss. Plan a longer hold.
- Peoria County population projected at -11% by 2050 — secular population decline; favor cash flow + early exit over multi-decade hold.
- At projected returns (-3.0% appreciation + 8.0% rent growth), your $29k cash investment doubles in ~8 years — after that, you're playing with house money.
Negotiation context
- It's been on market 46 days — a 3% lower offer ($102k) is reasonable based on typical stale-listing flexibility.
- 4 sale attempts since 25y ago with the ask held roughly flat each time — persistent listings suggest the price (not the market) is what's stuck; bring a comps-based counter.
- Current owner paid $50k; list at $105k implies a 110% gain — meaningful room to come down on a strong offer.
Risks & watch-outs
- Watch-outs: built in 1945 — expect roof / HVAC / electrical / plumbing capex.
Questions for the listing agent
- It's been on market 46 days. Have you received any prior offers? Is the seller open to a 3% concession, seller financing, or rate buy-down credit?
- Built in 1945 — when were the roof, HVAC, electrical panel, plumbing, and water heater last replaced?
- Is there a deadline driving the sale (1031 exchange, divorce, estate, relocation)? That informs how much negotiation room exists.
- Schools are F-rated, which usually means shorter tenancies and higher turnover. Who's the typical renter profile here, and what's been the actual vacancy rate?
- Crime grade is F in this area — have there been break-ins, vandalism, or insurance claims at this property in the last 3 years? What carrier currently insures it and at what premium?
- What's the average days-on-market for RENTAL listings here right now (not sales)? A rising rental-DOM trend means longer vacancies and softer asking-rent achievability than the comps imply.
- What's the recent tenant-quality profile in this submarket — average credit score on applications, eviction rate, late-payment / NSF rate, and stable-employment percentage? A property-management company in the area should have these aggregated.
- How much new for-sale + rental construction is in the pipeline within 1–3 miles? Heavy new supply typically softens prices + rents 12–24 months out; constrained supply supports both.
Investment metrics
- 1% rule
- 1.12% ✓
- Cap rate
- 8.33%
- Cash-on-cash
- 7.28%
- DSCR
- 1.32
- GRM
- 7.5
CMA / ARV
- ARV (median comp)
- $103,846
- List price
- $105,000
- Delta
- 1.11%
- Verdict
- FAIR
- Comps
- 20 within 1.0 mi
Show comp detail 12 sales within ~0.75 mi
| Address | Dist | Beds/Ba | Sqft | Sold | Price | $/sf | Match |
|---|---|---|---|---|---|---|---|
| 4212 N Prospect Rd | 0.07mi | 2/1.0 | 979 (+2%) | 3mo | $100,500 | $103 | 91 |
| 1404 E Moneta Ave | 0.19mi | 2/1.0 | 952 (-1%) | 6mo | $135,000 | $142 | 85 |
| 1216 E Rouse Ave | 0.15mi | 2/1.0 | 1,044 (+9%) | 1mo | $164,000 | $157 | 78 |
| 1010 E Moneta Ave | 0.35mi | 3/1.0 (+1) | 975 (+2%) | 7mo | $85,000 | $87 | 70 |
| 1002 E Samuel Ave | 0.60mi | 2/1.0 | 968 (+1%) | 5mo | $130,000 | $134 | 67 |
| 1216 E Duryea Ave | 0.46mi | 1/1.0 (-1) | 1,008 (+5%) | 7mo | $138,000 | $137 | 59 |
| 1409 E Duryea Ave | 0.46mi | 2/1.0 | 836 (-13%) | 2mo | $120,000 | $144 | 56 |
| 705 E Cox Ave | 0.59mi | 3/1.0 (+1) | 897 (-7%) | 2mo | $125,000 | $139 | 55 |
| 909 E Moneta Ave | 0.43mi | 2/1.0 | 840 (-12%) | 6mo | $110,000 | $131 | 54 |
| 709 E Cox Ave | 0.58mi | 3/1.0 (+1) | 888 (-8%) | 2mo | $75,000 | $84 | 54 |
| 1505 E London Ave | 0.56mi | 2/1.0 | 1,040 (+8%) | 8mo | $68,000 | $65 | 53 |
| 1516 E Tripp Ave | 0.71mi | 1/1.5 (-1) | 904 (-6%) | 6mo | $53,000 | $59 | 44 |
Match score weights: distance 35% · size 25% · config 20% · recency 20%. Top-matched comps best support the ARV.
Projected returns pro-forma
-3.0% appreciation · 8.0% rent growth · sell at horizon
- IRR
- 0.5%
- Equity multiple
- 1.02×
- Total profit
- $571
- Equity at exit
- $15,656
- IRR
- 14.8%
- Equity multiple
- 2.48×
- Total profit
- $43,451
- Equity at exit
- $9,078
Cash invested: $29,400 (down + closing). Projections, not guarantees.
Landlord ↔ Tenant lean methodology
- Overall (STATE)
- 43 Moderately Tenant-Leaning
- State Illinois
- 43 Moderately Tenant-Leaning · D+7
- County
- — inherits STATE
- City
- — inherits STATE
ZIP-level market 61614
- Home prices YoY
- -29.1%
- Rents YoY
- 10.3%
- Active inventory
- 150
- Price-to-rent
- 7.5×
Monthly cashflow live
- Estimated rent
- $1,172 high interval (Pro) →
- Mortgage (P&I)
- −$551
- Tax from tax record
- −$154 /mo · $1,842/yr
- Insurance
- −$44
- HOA
- −$0
- Vacancy / Maint / Mgmt
- −$246
- Net cashflow
- $178
Break-even live
UW: 25.0% down · 7.5% · 30yr · 1.5% tax · 5.0% vac · 8.0% maint · 8.0% mgmt
Financing live
Cash to close
- Down payment
- $26,250
- Closing costs
- $3,150
- Reserves months
- —
- Total cash needed
- —
Loan-product check · same deal, 3 products live
Conventional
25% down · 7.5% · 30yr
- Down + closing
- —
- Monthly P&I
- —
- Monthly cashflow
- —
- DSCR
- —
- Eligible?
- —
Personal DTI + credit; lowest rate.
DSCR
20% down · 8.5% · 30yr
- Down + closing
- —
- Monthly P&I
- —
- Monthly cashflow
- —
- DSCR
- —
- Eligible?
- —
No personal income docs; deal must DSCR.
Hard money
10% down · 12.0% · 12mo
- Down + closing
- —
- Monthly P&I
- —
- Monthly cashflow
- —
- DSCR
- —
- Eligible?
- —
Short-term bridge; refi at stabilization.
Rent comps 12 comps
| Address | Beds | Baths | Sqft | Rent | $/sqft | DOM | Units | Dist |
|---|---|---|---|---|---|---|---|---|
| 3912 N Atlantic Ave Peoria Heights, IL | 2.0 | 1.0 | 825 | $1,100 | $1.33 | 43d | 1 | 0.27mi |
| 811 E Lake Ave Peoria Heights, IL | 2.0 | 1.0 | 576 | $875 | $1.52 | 13d | 1 | 0.42mi |
| 813 E Sciota Ave Peoria Heights, IL | 2.0 | 2.0 | 800 | $1,400 | $1.75 | 13d | 1 | 0.43mi |
| 4914 N Best St Peoria Heights, IL | 2.0 | 1.0 | 720 | $1,200 | $1.67 | 43d | 1 | 0.90mi |
| 228 E Oak Cliff Ct Unit A2 Peoria, IL | 2.0 | 1.0 | 1000 | $1,050 | $1.05 | 13d | 1 | 0.91mi |
| 249 E Oak Cliff Ct Unit 4 Peoria, IL | 2.0 | 1.0 | 600 | $800 | $1.33 | 13d | 1 | 0.96mi |
| 126 E Lake Ave Peoria, IL | 2.0 | 1.0 | 950 | $1,050 | $1.11 | 13d | 9 | 1.00mi |
| 5106 N Glen Elm Dr Peoria Heights, IL | 2.0 | 1.0 | 1008 | $2,400 | $2.38 | 13d | 1 | 1.05mi |
| 4809 Knoxville Ave Apt 2C Peoria, IL | 1.0 | 1.0 | 700 | $850 | $1.21 | 21d | 1 | 1.23mi |
| 4809 Knoxville Ave Apt 3D Peoria, IL | 1.0 | 1.0 | 775 | $775 | $1.00 | 21d | 1 | 1.23mi |
| 4809 Knoxville Ave Unit 4819 4B, 5A, & 5B Peoria, IL | 3.0 | 2.0 | 700 | $1,800 | $2.57 | 13d | 1 | 1.23mi |
| 737 E Gift Ave Unit 737 Peoria, IL | 2.0 | 1.0 | 800 | $1,125 | $1.41 | 43d | 1 | 1.41mi |
Listing history 28 events
-
2026-06-19days on market $105,000 Active 46 DOM
-
2026-06-18days on market $105,000 Active 45 DOM
-
2026-06-17days on market $105,000 Active 44 DOM
-
2026-06-16days on market $105,000 Active 43 DOM
-
2026-06-15days on market $105,000 Active 42 DOM
-
2026-06-14days on market $105,000 Active 40 DOM
-
2026-06-13days on market $105,000 Active 39 DOM
-
2026-06-10days on market $105,000 Active 37 DOM
-
2026-06-09days on market $105,000 Active 36 DOM
-
2026-06-08days on market $105,000 Active 35 DOM
-
2026-06-07days on market $105,000 Active 34 DOM
-
2026-06-03days on market $105,000 Active 30 DOM
-
2026-06-02days on market $105,000 Active 29 DOM
-
2026-06-01days on market $105,000 Active 28 DOM
-
2026-05-31days on market $105,000 Active 27 DOM
-
2026-05-30days on market $105,000 Active 26 DOM
-
2026-05-04$105,000 Active 486-char remark
-
2024-12-05historical $1,000
-
2024-11-19price $1,000
-
2024-10-16$1,100
-
2024-10-14historical
-
2024-09-13price
-
2024-09-02Active
-
2021-08-06historical
-
2001-10-25soldstatus $49,900
-
2001-10-25soldstatus $50,000
-
2001-09-24$49,900
-
1998-06-10soldstatus $43,000
ⓘ Source: listings_history table (triggers on properties + properties_extension) + one-shot
backfill from property_details.listing_events for pre-trigger history.
Tax reassessment forecast IL · Partial reset (capped growth)
- Current annual tax
- $1,842 · $154/mo
- Projected year-2 tax
- $2,113 · $176/mo
- Expected delta
- +$271/yr (+$23/mo · 14.7%)
ⓘ Screening estimate from a state-policy table — verify with the county assessor before closing.
Climate risk First Street
- Flood 1/10 Low FEMA zone X · 0% chance over 30 yrs
- Wildfire 1/10 Low
- Heat 3/10 Moderate 7 d/yr ≥104°F today · 18 d/yr by 30 yrs out
- Wind 2/10 Low 100% chance of damaging wind over 30 yrs
- Air quality 3/10 Moderate 1 unhealthy d/yr today · 3 by 30 yrs out
Nearby sold comps map
Loading sold comps map…
Walkable amenities ~0.75 mi
Loading nearby amenities…
Taxation est. · year 1
- Rental income
- $14,070
- − Mortgage interest
- −$5,882
- − Property taxes
- −$1,842
- − Insurance
- −$525
- − Repairs & maintenance
- −$1,126
- − Management
- −$1,126
- − Depreciation
- −$3,055
- Taxable income
- $515
- Est. tax owed @ 24.0%
- −$124
- After-tax cash flow
- $2,016/yr
For passive investors: Depreciation is non-cash, so a rental often shows a tax loss while cash-flowing — sheltering income. Rental losses are passive: they offset passive income freely, and up to $25,000/yr can offset ordinary (W-2) income if you actively participate and your MAGI is under $100k (phasing out to $0 by $150k); unused losses carry forward. On sale, claimed depreciation is recaptured at up to 25%, and gains may owe capital-gains tax (a 1031 exchange can defer both). Figures are a year-1 estimate at your 24.0% rate — not tax advice; consult a CPA.
Schools (NCES district)
- District
- Peoria SD 150
- NCES district ID
- 1731230
- Math proficiency
- 11% ▼ -5.00%
- Reading proficiency
- 14% ▼ -4.00%
- Median HH income
- $41,951
- Composite
- 10.92/100
- National rank
- #9751
- State rank
- #554 of 620 in IL
Livability — Peoria
- Score
- 73/100
- State rank
- #270
- US rank
- #5096
Category grades
Schools grade is shown separately in the Schools card above.
Census & demographics
- Census place
- Peoria, IL
- County
- Peoria County · 120,495 people
- City population
- 114,670
- Metro
- Peoria, IL
- Population (ZIP)
- 27,370
- Household income
- $66,924
- Rent vs Own
- Severe rent burden
- 1179.0
Population outlook (Peoria County) Hauer SSP2
- Today (2025)
- 183,007 people
- By 2030
- 179,643 · -1.8%
- By 2040
- 171,782 · -6.1%
- By 2050
- 163,508 · -10.7%
- By 2075
- 140,178 · -23.4%
- By 2100
- 114,493 · -37.4%
Race, ethnicity, and origin ACS 2023
- Neighborhood character
- Predominantly White (70%)
- Race & ethnicity
- White 70% Black 17% Two or more races 5% Asian 5% Hispanic / Latino 5%
- Common ancestry
- Romanian 2% Lithuanian 2% Italian 2%
- Foreign-born
- 9% · Canada, South Korea, China
- Languages at home
- 92% English-only · Spanish 2% Other Asian/Pacific 2% Other Indo-European 1%
Political lean MEDSL · Peoria
- 2024 margin
- Toss-up / Even · D 51.5% · R 46.9% · Other 1.6%
- 2008→2024 swing
- -9.2pp toward R · 2008: 13.9pp · 2024: 4.7pp
- All cycles
- 2024: D+4.7 2020: D+6.3 2016: D+2.8 2012: D+4.4 2008: D+13.9
Not yet ingested
- Civics
- —
Market trends
- HPI YoY
- ▼ -76.07%
- Current HPI
- 185.122
- Rent YoY
- ▲ 10.35%
- Metro
- Peoria, IL
- State GDP YoY
- ▲ 1.59%
- F500 in state
- 60
Industry mix (Fortune 500 HQ in IL)
| Industry | F500 HQs | Revenue |
|---|---|---|
| Insurance | 4 | $201B |
|
||
| Consumer Goods | 4 | $87B |
|
||
| Industrial Machinery | 3 | $64B |
|
||
| Healthcare | 2 | $55B |
|
||
| Retail / Pharmacy | 1 | $148B |
|
||
| Agriculture / Food | 1 | $86B |
|
||
Price history
+144.2% since first listed12 events — show timeline
- 2026-05-04 Listed $105,000 RMLSA as Distributed by MLS Grid
- 2024-12-05 Rental Removed $1,000 APPFOLIO
- 2024-11-19 Price Changed $1,000 APPFOLIO
- 2024-10-16 Listed for Rent $1,100 APPFOLIO
- 2024-10-14 Listing Removed — RMLSA as Distributed by MLS Grid
- 2024-09-13 Price Changed — RMLSA as Distributed by MLS Grid
- 2024-09-02 Listed — RMLSA as Distributed by MLS Grid
- 2021-08-06 Listing Removed — RMLSA as Distributed by MLS Grid
- 2001-10-25 Sold (Public Records) $50,000 Public Records
- 2001-10-25 Sold (MLS) $49,900 RMLSA as Distributed by MLS Grid
- 2001-09-24 Listed $49,900 RMLSA as Distributed by MLS Grid
- 1998-06-10 Sold (Public Records) $43,000 Public Records
Property tax history
+2.0%/yrLatest (2025): $1,842 · +6.4% YoY. Source: county tax records.
Cash-flow waterfall
monthlySold comps — $/sqft
last 12 mo · ≤1 miLoading sold comps…