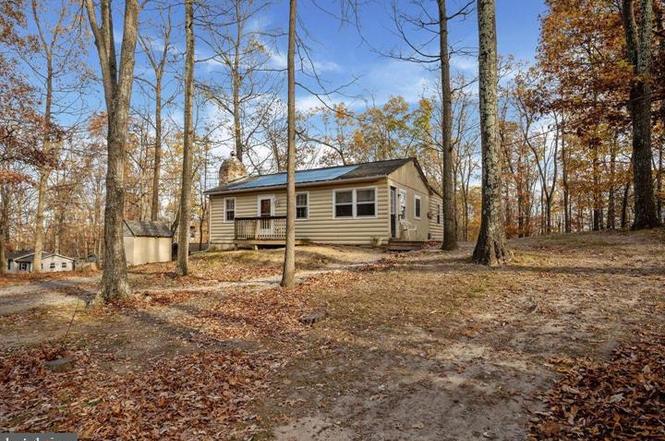
108 Comanche Trl · Shawneeland, VA
Flood risk 1/10 · Minimal
- FEMA flood zone
- X (unshaded)
- Chance of flooding over 30 yrs
- 0.0%
- Est. flood insurance / yr
- $507 – $1,088
Fire risk 4/10 · Minor
- Est. fire insurance / yr
- $666 – $1,236
Heat risk 4/10 · Minor
- Hot days now (above 100°F)
- 7 days/yr
- Hot days in 30 yrs
- 17 days/yr
Wind risk 2/10 · Minimal
- Chance of severe wind over 30 yrs
- 1.0%
Air-quality risk 1/10 · Minimal
- Unhealthy air days now
- 0 days/yr
- Unhealthy air days in 30 yrs
- 0 days/yr
Risk factors via First Street. Map © Google.
Why this score? — see what drove the C+ grade
The composite is a weighted blend of 9 inputs, each scored 0–100. Each bar is that input's sub-score; the figure is the points it added to the 100-point composite (weight × sub-score).
- Cash flow +21.7/30.0
- ARV discount +15.0/15.0
- DSCR +6.9/10.0
- Schools +5.0/10.0
- 1% rule +4.7/10.0
- Livability +3.2/5.0
- Condition / age +2.5/5.0
- Rent growth +1.9/5.0
- Appreciation +0.0/10.0
$179,900
🖨 Deal sheet 📄 Offer letter ✓ Due diligence
Listing remarks MLS
Cute home, perfect starter or downsize! Nice yard with plenty of space for outdoor enjoyment. Freshly painted. Ready for you to make it your own.
Key facts
- Large deck
- Open floor plan
- Private bath
Tags
Property features AI
Exterior
- Parking: Driveway
- Utilities: Water from private well; On-site septic; Electric hot water
- Home design: Detached single-family home; One-story layout (main-level living)
- Construction: Crawl space foundation
- Exterior features: Detached property; Shed on the property; No tidal water
Interior
- Kitchen: Kitchen with built-in microwave, stove, dishwasher, and refrigerator
- Bedrooms: Three bedrooms on the main level
- Bathrooms: One full bathroom on the main level; One full bathroom total
- Heating & cooling: Electric baseboard heating; Electric cooling (other type)
- Interior features: Built-in microwave; Dishwasher; Stove; Refrigerator; Living room; Dining room; Laundry area with hookups; Fireplace (1)
- Laundry & utility: Laundry hookups
Neighborhood map
What this means for you Summary
Snapshot
- This is a 2-bed/1.0-bath single-family listed at $180k.
Deal economics
- At list price, monthly cash flow is $276 ($3k/yr) — positive.
- The deal already cash-flows at list — no discount required.
- To meet the 1% rule (rent ≥ 1% of price), the offer needs to be $174k (3.5% below list).
- Recommended offer: $169k (6.0% below list) — sets the bar for market timing.
- Cap rate 8.1% vs local median 4.3% in Shawneeland — top-decile yield for the area; either an underpriced asset or a hidden risk that comps aren't pricing in. Stress-test before assuming the spread holds.
Location & tenants
- Location reads 64/100 on livability (#359 in VA) — a middle-class / working-renter tenant base. Strengths: crime A+, employment A+, cost of living A+; Watch: schools F, amenities F, commute F.
- Frederick County Public School District (rural): math 49% / reading 64% proficiency, ranked #65 of 131 in VA (top 50%) — acceptable for families but not a draw, mixed tenant base, ~2y average lease.
- Market conditions: Rents soft (-2.5%/yr); 312 active listings in the ZIP; solid renter incomes; 872 units permitted in Frederick County in 2024 (0 in 5+ unit buildings).
Forward outlook
- Local home prices are declining (-3.0%/yr); year-one equity from $1k of loan paydown is wiped out by about $5k of value loss. Plan a longer hold.
- Frederick County population projected at +17% by 2050 — long-run rental-demand tailwind backs the buy-and-hold thesis.
Negotiation context
- It's been on market 68 days — a 6% lower offer ($169k) is reasonable based on typical stale-listing flexibility.
- 12 sale attempts since 22y ago; this cycle's ask has dropped $10k (5%) from the opening price — seller is motivated, your offer sets the floor, not the list.
Questions for the listing agent
- It's been on market 68 days. Have you received any prior offers? Is the seller open to a 6% concession, seller financing, or rate buy-down credit?
- Built in 1971 — when were the roof, HVAC, electrical panel, plumbing, and water heater last replaced?
- Why hasn't it sold? Are there any deal-killer items the seller is aware of (foundation, flood, title, zoning, code violations)?
- Is there a deadline driving the sale (1031 exchange, divorce, estate, relocation)? That informs how much negotiation room exists.
- Schools are F-rated, which usually means shorter tenancies and higher turnover. Who's the typical renter profile here, and what's been the actual vacancy rate?
- What's the average days-on-market for RENTAL listings here right now (not sales)? A rising rental-DOM trend means longer vacancies and softer asking-rent achievability than the comps imply.
- What's the recent tenant-quality profile in this submarket — average credit score on applications, eviction rate, late-payment / NSF rate, and stable-employment percentage? A property-management company in the area should have these aggregated.
- How much new for-sale + rental construction is in the pipeline within 1–3 miles? Heavy new supply typically softens prices + rents 12–24 months out; constrained supply supports both.
Investment metrics
- 1% rule
- 0.97% ✗
- Cap rate
- 8.13%
- Cash-on-cash
- 6.57%
- DSCR
- 1.29
- GRM
- 8.6
CMA / ARV
- ARV (on-the-fly)
- $285,696
- Comps found
- 5
Show comp detail 5 sales within ~0.75 mi
| Address | Dist | Beds/Ba | Sqft | Sold | Price | $/sf | Match |
|---|---|---|---|---|---|---|---|
| 111 Dakota Trl | 0.13mi | 3/1.0 (+1) | 1,029 (+0%) | 8mo | $290,000 | $282 | 81 |
| 117 Buffalo Trl | 0.28mi | 2/2.0 | 1,040 (+2%) | 14mo | $290,000 | $279 | 69 |
| 803 Tomahawk Trl | 0.37mi | 3/1.5 (+1) | 960 (-6%) | 1mo | $246,000 | $256 | 64 |
| 109 Gannentaha Trl | 0.41mi | 2/2.0 | 1,008 (-2%) | 23mo | $277,500 | $275 | 55 |
| 136 Dakota Trl | 0.20mi | 3/2.0 (+1) | 1,120 (+9%) | 15mo | $320,000 | $286 | 54 |
Match score weights: distance 35% · size 25% · config 20% · recency 20%. Top-matched comps best support the ARV.
Projected returns pro-forma
-3.0% appreciation · 0.0% rent growth · sell at horizon
- IRR
- -9.3%
- Equity multiple
- 0.67×
- Total profit
- $-16,745
- Equity at exit
- $26,824
- IRR
- -4.1%
- Equity multiple
- 0.76×
- Total profit
- $-11,895
- Equity at exit
- $15,554
Cash invested: $50,372 (down + closing). Projections, not guarantees.
Landlord ↔ Tenant lean methodology
- Overall (STATE)
- 55 Moderately Landlord-Leaning
- State Virginia
- 55 Moderately Landlord-Leaning · D+2
- County
- — inherits STATE
- City
- — inherits STATE
ZIP-level market 22602
- Home prices YoY
- -20.0%
- Rents YoY
- -2.5%
- Active inventory
- 312
- Price-to-rent
- 8.6×
Monthly cashflow live
- Estimated rent
- $1,736 medium interval (Pro) →
- Mortgage (P&I)
- −$943
- Tax from tax record
- −$77 /mo · $930/yr
- Insurance
- −$75
- HOA
- −$0
- Vacancy / Maint / Mgmt
- −$365
- Net cashflow
- $276
Break-even live
UW: 25.0% down · 7.5% · 30yr · 1.5% tax · 5.0% vac · 8.0% maint · 8.0% mgmt
Financing live
Cash to close
- Down payment
- $44,975
- Closing costs
- $5,397
- Reserves months
- —
- Total cash needed
- —
Loan-product check · same deal, 3 products live
Conventional
25% down · 7.5% · 30yr
- Down + closing
- —
- Monthly P&I
- —
- Monthly cashflow
- —
- DSCR
- —
- Eligible?
- —
Personal DTI + credit; lowest rate.
DSCR
20% down · 8.5% · 30yr
- Down + closing
- —
- Monthly P&I
- —
- Monthly cashflow
- —
- DSCR
- —
- Eligible?
- —
No personal income docs; deal must DSCR.
Hard money
10% down · 12.0% · 12mo
- Down + closing
- —
- Monthly P&I
- —
- Monthly cashflow
- —
- DSCR
- —
- Eligible?
- —
Short-term bridge; refi at stabilization.
Listing history 50 events
-
2026-06-19days on market $179,900 Active 68 DOM
-
2026-06-18days on market $179,900 Active 67 DOM
-
2026-06-17days on market $179,900 Active 66 DOM
-
2026-06-16days on market $179,900 Active 65 DOM
-
2026-06-15days on market $179,900 Active 64 DOM
-
2026-06-14days on market $179,900 Active 62 DOM
-
2026-06-13days on market $179,900 Active 61 DOM
-
2026-06-10days on market $179,900 Active 59 DOM
-
2026-06-09days on market $179,900 Active 58 DOM
-
2026-06-08days on market $179,900 Active 57 DOM
-
2026-06-07days on market $179,900 Active 56 DOM
-
2026-06-05days on market $179,900 Active 53 DOM
-
2026-06-02days on market $179,900 Active 51 DOM
-
2026-06-01days on market $179,900 Active 50 DOM
-
2026-05-31days on market $179,900 Active 49 DOM
-
2026-05-30days on market $179,900 Active 48 DOM
-
2026-05-25status Active
-
2026-03-24status Pending
-
2026-03-09price $179,900
-
2026-03-08status Active
-
2025-10-31status Pending
-
2025-10-27price $169,900
-
2025-10-03$189,900 Active
-
2025-03-24historical
-
2025-02-11price $200,000
-
2024-11-14$216,000 Active
-
2022-04-22soldstatus $203,000
-
2022-04-21soldstatus $216,000 Closed 145-char remark
Show marketing remark (145 chars)
Cute home, perfect starter or downsize! Nice yard with plenty of space for outdoor enjoyment. Freshly painted. Ready for you to make it your own.
-
2022-04-18Active Under Contract 145-char remark
Show marketing remark (145 chars)
Cute home, perfect starter or downsize! Nice yard with plenty of space for outdoor enjoyment. Freshly painted. Ready for you to make it your own.
-
2022-04-07soldstatus $216,000 Closed 145-char remark
Show marketing remark (145 chars)
Cute home, perfect starter or downsize! Nice yard with plenty of space for outdoor enjoyment. Freshly painted. Ready for you to make it your own.
-
2022-03-08historical Active Under Contract 145-char remark
Show marketing remark (145 chars)
Cute home, perfect starter or downsize! Nice yard with plenty of space for outdoor enjoyment. Freshly painted. Ready for you to make it your own.
-
2022-03-04$210,000 Active 145-char remark
Show marketing remark (145 chars)
Cute home, perfect starter or downsize! Nice yard with plenty of space for outdoor enjoyment. Freshly painted. Ready for you to make it your own.
-
2017-10-20soldstatus $129,000
-
2017-10-20soldstatus $129,000 Sold
-
2017-08-29status Contingent (No Kick Out)
-
2017-08-12$129,900 Active
-
2010-07-07historical Temporarily Off-Market
-
2010-07-07historical
-
2010-04-21Active
-
2010-04-21$99,900
-
2009-10-01soldstatus $50,000
-
2009-09-30soldstatus $50,000
-
2009-09-30soldstatus $50,000
-
2009-09-28$50,000
-
2009-09-28historical
-
2009-09-28$50,000
-
2009-09-28historical
-
2004-09-03soldstatus $125,000
-
2004-09-02soldstatus $125,000
-
2004-07-19historical
ⓘ Source: listings_history table (triggers on properties + properties_extension) + one-shot
backfill from property_details.listing_events for pre-trigger history.
Tax reassessment forecast VA · Resets to sale price
- Current annual tax
- $930 · $77/mo
- Projected year-2 tax
- $1,475 · $123/mo
- Expected delta
- +$545/yr (+$45/mo · 58.7%)
ⓘ Screening estimate from a state-policy table — verify with the county assessor before closing.
Climate risk First Street
- Flood 1/10 Low FEMA zone X (unshaded) · 0% chance over 30 yrs
- Wildfire 4/10 Moderate
- Heat 4/10 Moderate 7 d/yr ≥100°F today · 17 d/yr by 30 yrs out
- Wind 2/10 Low 100% chance of damaging wind over 30 yrs
- Air quality 1/10 Low 0 unhealthy d/yr today · 0 by 30 yrs out
Nearby sold comps map
Loading sold comps map…
Walkable amenities ~0.75 mi
Loading nearby amenities…
Taxation est. · year 1
- Rental income
- $20,834
- − Mortgage interest
- −$10,077
- − Property taxes
- −$930
- − Insurance
- −$900
- − Repairs & maintenance
- −$1,667
- − Management
- −$1,667
- − Depreciation
- −$5,233
- Taxable income
- $360
- Est. tax owed @ 24.0%
- −$86
- After-tax cash flow
- $3,222/yr
For passive investors: Depreciation is non-cash, so a rental often shows a tax loss while cash-flowing — sheltering income. Rental losses are passive: they offset passive income freely, and up to $25,000/yr can offset ordinary (W-2) income if you actively participate and your MAGI is under $100k (phasing out to $0 by $150k); unused losses carry forward. On sale, claimed depreciation is recaptured at up to 25%, and gains may owe capital-gains tax (a 1031 exchange can defer both). Figures are a year-1 estimate at your 24.0% rate — not tax advice; consult a CPA.
Schools (NCES district)
- District
- Frederick County Public School District
- NCES district ID
- 5101470
- Math proficiency
- 49% ▼ -30.00%
- Reading proficiency
- 64% ▼ -10.00%
- Median HH income
- $67,049
- Composite
- 49.75/100
- National rank
- #1964
- State rank
- #65 of 131 in VA
Livability — Shawneeland
- Score
- 64/100
- State rank
- #359
- US rank
- #14402
Category grades
Schools grade is shown separately in the Schools card above.
Census & demographics
- Census place
- Shawneeland, VA
- County
- Frederick County · 60,887 people
- Metro
- Winchester, VA-WV
- Population (ZIP)
- 32,840
- Household income
- $101,398
- Rent vs Own
- Severe rent burden
- 294.0
Population outlook (Frederick County) Hauer SSP2
- Today (2025)
- 92,976 people
- By 2030
- 97,195 · +4.5%
- By 2040
- 104,149 · +12.0%
- By 2050
- 108,407 · +16.6%
- By 2075
- 116,431 · +25.2%
- By 2100
- 114,323 · +23.0%
Race, ethnicity, and origin ACS 2023
- Neighborhood character
- Predominantly White (79%)
- Race & ethnicity
- White 79% Hispanic / Latino 12% Two or more races 5% Black 3% Asian 2%
- Hispanic origin (detail)
- Mexican 6% Puerto Rican 1%
- Common ancestry
- Lithuanian 3% Serbian 2% Romanian 2%
- Foreign-born
- 8% · Canada, China
- Languages at home
- 88% English-only · Spanish 10% Other Indo-European 1%
Political lean MEDSL · Frederick
- 2024 margin
- Strong R (+28.4) · D 35.2% · R 63.6% · Other 1.1%
- 2008→2024 swing
- -7.0pp toward R · 2008: -21.4pp · 2024: -28.4pp
- All cycles
- 2024: R+28.4 2020: R+27.4 2016: R+35.3 2012: R+28.0 2008: R+21.4
Not yet ingested
- Civics
- —
Market trends
- HPI YoY
- ▼ -52.39%
- Current HPI
- 209.8801
- Rent YoY
- ▼ -2.55%
- Metro
- Winchester, VA-WV
- State GDP YoY
- ▲ 2.40%
- F500 in state
- 50
Industry mix (Fortune 500 HQ in VA)
| Industry | F500 HQs | Revenue |
|---|---|---|
| Aerospace / Defense | 4 | $236B |
|
||
| Technology / Defense | 3 | $32B |
|
||
| Financial Services | 2 | $176B |
|
||
| Utilities | 2 | $27B |
|
||
| Insurance | 2 | $25B |
|
||
| Technology | 2 | $15B |
|
||
Price history
+38.5% since first listed35 events — show timeline
- 2026-05-25 Relisted — BRIGHT MLS
- 2026-03-24 Pending — BRIGHT MLS
- 2026-03-09 Price Changed $179,900 BRIGHT MLS
- 2026-03-08 Relisted — BRIGHT MLS
- 2025-10-31 Pending — BRIGHT MLS
- 2025-10-27 Price Changed $169,900 BRIGHT MLS
- 2025-10-03 Listed $189,900 BRIGHT MLS
- 2025-03-24 Listing Removed — BRIGHT MLS
- 2025-02-11 Price Changed $200,000 BRIGHT MLS
- 2024-11-14 Listed $216,000 BRIGHT MLS
- 2022-04-22 Sold (Public Records) $203,000 Public Records
- 2022-04-21 Sold (MLS) $216,000 BRIGHT MLS
- 2022-04-18 Listed — BRIGHT MLS
- 2022-04-07 Sold (MLS) $216,000 BRIGHT MLS
- 2022-03-08 Contingent — BRIGHT MLS
- 2022-03-04 Listed $210,000 BRIGHT MLS
- 2017-10-20 Sold (MLS) $129,000 MRIS
- 2017-10-20 Sold (MLS) $129,000 BRIGHT MLS
- 2017-08-29 Pending — MRIS
- 2017-08-12 Listed $129,900 MRIS
- 2010-07-07 Delisted — MRIS
- 2010-07-07 Listing Removed — BRIGHT MLS
- 2010-04-21 Listed — MRIS
- 2010-04-21 Listed $99,900 BRIGHT MLS
- 2009-10-01 Sold (Public Records) $50,000 Public Records
- 2009-09-30 Sold (MLS) $50,000 MRIS
- 2009-09-30 Sold (MLS) $50,000 BRIGHT MLS
- 2009-09-28 Delisted — MRIS
- 2009-09-28 Listed $50,000 MRIS
- 2009-09-28 Listing Removed — BRIGHT MLS
- 2009-09-28 Listed $50,000 BRIGHT MLS
- 2004-09-03 Sold (Public Records) $125,000 Public Records
- 2004-09-02 Sold (MLS) $125,000 MRIS
- 2004-07-19 Listed $129,900 MRIS
- 2004-07-19 Delisted — MRIS
Property tax history
-0.6%/yrLatest (2025): $930 · -34.7% YoY. Source: county tax records.
Cash-flow waterfall
monthlySold comps — $/sqft
last 12 mo · ≤1 miLoading sold comps…