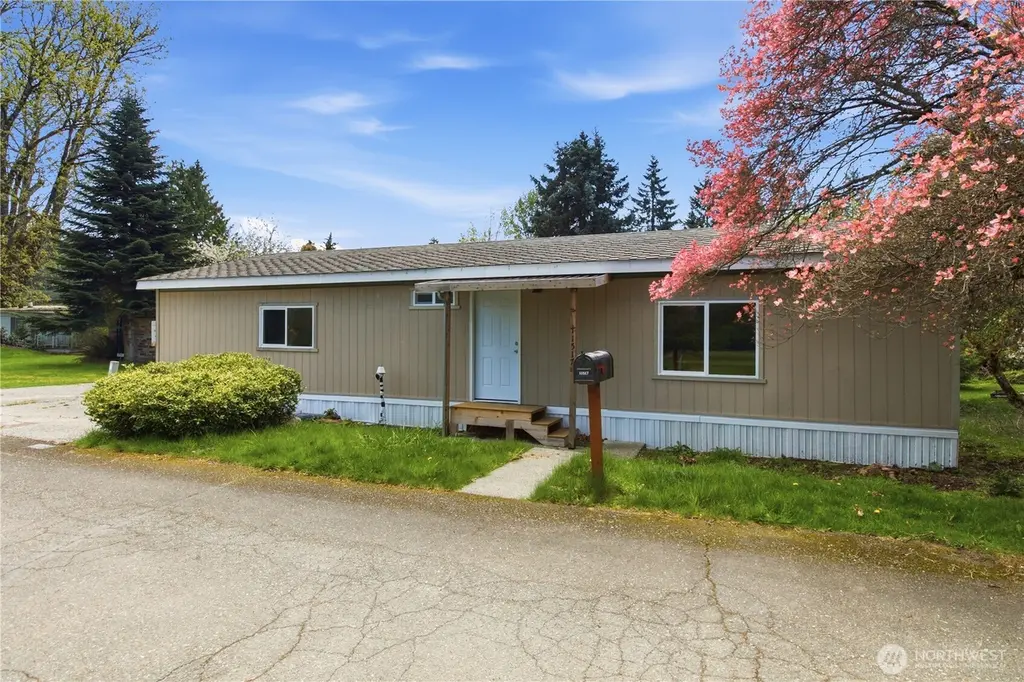
11517 155 Ave SE · Fairwood, WA
Flood risk No data
- FEMA flood zone
- —
- Chance of flooding over 30 yrs
- —
- Est. flood insurance / yr
- —
Fire risk No data
- Est. fire insurance / yr
- —
Heat risk No data
- Hot days now (above threshold)
- —
- Hot days in 30 yrs
- —
Wind risk No data
- Chance of severe wind over 30 yrs
- —
Air-quality risk No data
- Unhealthy air days now
- —
- Unhealthy air days in 30 yrs
- —
Risk factors via First Street. Map © Google.
Why this score? — see what drove the B+ grade
The composite is a weighted blend of 9 inputs, each scored 0–100. Each bar is that input's sub-score; the figure is the points it added to the 100-point composite (weight × sub-score).
- Cash flow +30.0/30.0
- ARV discount +13.0/15.0
- 1% rule +10.0/10.0
- DSCR +10.0/10.0
- Schools +4.8/10.0
- Livability +4.0/5.0
- Condition / age +4.0/5.0
- Rent growth +2.6/5.0
- Appreciation +0.0/10.0
$149,999
🖨 Deal sheet 📄 Offer letter ✓ Due diligence
Listing remarks
Completely remodeled 1973 manufactured home in a welcoming 55+ community in Renton Highlands! Enjoy peace of mind with a brand-new roof and new siding, plus a fully updated interior featuring beautiful new flooring, remodeled kitchen with modern cabinetry and countertops, updated bathrooms, and stylish new fixtures throughout. Light and bright living spaces create a warm, inviting feel that truly makes this home stand out. Designed for comfortable, low-maintenance living so you can spend more time doing what you love. Conveniently located near shopping, dining, medical services, parks, and easy commute routes. Affordable, move-in-ready homes like this in such a desirable senior community ar
Key facts
- New siding
- Modern cabinetry
- Remodeled kitchen
Tags
Neighborhood map
What this means for you Summary
Snapshot
- This is a 3-bed/2.0-bath manufactured listed at $150k. Condition is rated good.
Deal economics
- At list price, monthly cash flow is $1k ($18k/yr) — positive.
- The deal already cash-flows at list — no discount required.
- Meets the 1% rule at list price ($3k rent vs $150k).
- Recommended offer: $136k (9.0% below list) — sets the bar for market timing.
- Cap rate 18.2% vs local median 2.3% in Fairwood — top-decile yield for the area; either an underpriced asset or a hidden risk that comps aren't pricing in. Stress-test before assuming the spread holds.
Location & tenants
- Location reads 81/100 on livability (#77 in WA, #1,431 nationally) — a professional / high-income tenant draw. Strengths: commute A+, employment A+, housing A+; Watch: schools C-, cost of living F.
- Kent School District (urban): math 47% / reading 57% proficiency, ranked #109 of 291 in WA (top 38%) — acceptable for families but not a draw, mixed tenant base, ~2y average lease.
- Market conditions: Rents flat; 255 active listings in the ZIP; 8 comparable units currently listed for rent nearby; rentals leasing fast (median 4d on market — plan ~1-2 weeks tenant-placement turnaround); high-income renter base; 10,555 units permitted in King County in 2024 (7,119 in 5+ unit buildings).
Forward outlook
- Local home prices are declining (-3.0%/yr); year-one equity from $1k of loan paydown is wiped out by about $4k of value loss. Plan a longer hold.
- King County population projected at +44% by 2050 — long-run rental-demand tailwind backs the buy-and-hold thesis.
- At projected returns (-3.0% appreciation + 0.3% rent growth), your $42k cash investment doubles in ~3 years — after that, you're playing with house money.
Negotiation context
- It's been on market 105 days — a 9% lower offer ($136k) is reasonable based on typical stale-listing flexibility.
Questions for the listing agent
- It's been on market 105 days. Have you received any prior offers? Is the seller open to a 9% concession, seller financing, or rate buy-down credit?
- Built in 1973 — when were the roof, HVAC, electrical panel, plumbing, and water heater last replaced?
- Why hasn't it sold? Are there any deal-killer items the seller is aware of (foundation, flood, title, zoning, code violations)?
- Is there a deadline driving the sale (1031 exchange, divorce, estate, relocation)? That informs how much negotiation room exists.
- What's the average days-on-market for RENTAL listings here right now (not sales)? A rising rental-DOM trend means longer vacancies and softer asking-rent achievability than the comps imply.
- What's the recent tenant-quality profile in this submarket — average credit score on applications, eviction rate, late-payment / NSF rate, and stable-employment percentage? A property-management company in the area should have these aggregated.
- How much new for-sale + rental construction is in the pipeline within 1–3 miles? Heavy new supply typically softens prices + rents 12–24 months out; constrained supply supports both.
Investment metrics
- 1% rule
- 2.13% ✓
- Cap rate
- 18.17%
- Cash-on-cash
- 42.44%
- DSCR
- 2.89
- GRM
- 3.9
CMA / ARV
- ARV (median comp)
- $171,000
- List price
- $149,999
- Delta
- -12.28%
- Verdict
- UNDERPRICED
- Comps
- 6 within 2.0 mi
Projected returns pro-forma
-3.0% appreciation · 0.29% rent growth · sell at horizon
- IRR
- 36.1%
- Equity multiple
- 2.47×
- Total profit
- $61,863
- Equity at exit
- $22,365
- IRR
- 41.3%
- Equity multiple
- 4.40×
- Total profit
- $142,932
- Equity at exit
- $12,969
Cash invested: $42,000 (down + closing). Projections, not guarantees.
Landlord ↔ Tenant lean methodology
- Overall (STATE)
- 28 Tenant-Leaning
- State Washington
- 28 Tenant-Leaning · D+8
- County
- — inherits STATE
- City
- — inherits STATE
ZIP-level market 98059
- Rents YoY
- 0.3%
- Active inventory
- 255
- Price-to-rent
- 3.9×
Monthly cashflow live
- Estimated rent
- $3,192 high interval (Pro) →
- Mortgage (P&I)
- −$787
- Tax est. 1.5%
- −$187 /mo · $2,250/yr
- Insurance
- −$62
- HOA
- −$0
- Vacancy / Maint / Mgmt
- −$670
- Net cashflow
- $1,485
Break-even live
UW: 25.0% down · 7.5% · 30yr · 1.5% tax · 5.0% vac · 8.0% maint · 8.0% mgmt
Financing live
Cash to close
- Down payment
- $37,500
- Closing costs
- $4,500
- Reserves months
- —
- Total cash needed
- —
Loan-product check · same deal, 3 products live
Conventional
25% down · 7.5% · 30yr
- Down + closing
- —
- Monthly P&I
- —
- Monthly cashflow
- —
- DSCR
- —
- Eligible?
- —
Personal DTI + credit; lowest rate.
DSCR
20% down · 8.5% · 30yr
- Down + closing
- —
- Monthly P&I
- —
- Monthly cashflow
- —
- DSCR
- —
- Eligible?
- —
No personal income docs; deal must DSCR.
Hard money
10% down · 12.0% · 12mo
- Down + closing
- —
- Monthly P&I
- —
- Monthly cashflow
- —
- DSCR
- —
- Eligible?
- —
Short-term bridge; refi at stabilization.
Rent comps 8 comps
| Address | Beds | Baths | Sqft | Rent | $/sqft | DOM | Units | Dist |
|---|---|---|---|---|---|---|---|---|
| 17710 153rd Ave SE Renton, WA | 4.0 | 2.5 | 1850 | $3,995 | $2.16 | 1d | 1 | 0.28mi |
| 15030 SE 179th St Renton, WA | 1.0–3.0 | 1.0–2.0 | 1103 | $3,025 | $2.74 | 1d | 27 | 0.43mi |
| 14110 SE 171st Way Unit B303 Renton, WA | 3.0 | 2.0 | 1288 | $2,850 | $2.21 | 24d | 1 | 0.88mi |
| 14121 SE 177th St Renton, WA | 1.0–4.0 | 1.0–2.0 | 882 | $2,536 | $2.87 | 1d | 19 | 0.91mi |
| 14319 SE 163rd St Renton, WA | 3.0 | 2.5 | 1800 | $3,500 | $1.94 | 23d | 1 | 0.91mi |
| 15300 SE 155th Pl Renton, WA | 1.0–2.0 | 1.0–2.0 | 943 | $2,195 | $2.33 | 4d | 2 | 1.18mi |
| 17600 134th Ave SE Renton, WA | 1.0–3.0 | 1.0–2.0 | 883 | $2,650 | $3.00 | 2d | 21 | 1.21mi |
| 13811 SE Fairwood Blvd Renton, WA | 3.0 | 1.5 | 1390 | $2,395 | $1.72 | 4d | 1 | 1.26mi |
Listing history 16 events
-
2026-06-18days on market $149,999 Active 105 DOM
-
2026-06-17days on market $149,999 Active 104 DOM
-
2026-06-16days on market $149,999 Active 103 DOM
-
2026-06-15days on market $149,999 Active 102 DOM
-
2026-06-13days on market $149,999 Active 100 DOM
-
2026-06-09days on market $149,999 Active 96 DOM
-
2026-06-08days on market $149,999 Active 95 DOM
-
2026-06-07days on market $149,999 Active 94 DOM
-
2026-06-04days on market $149,999 Active 91 DOM
-
2026-06-03days on market $149,999 Active 90 DOM
-
2026-06-02days on market $149,999 Active 89 DOM
-
2026-06-01days on market $149,999 Active 88 DOM
-
2026-05-31days on market $149,999 Active 87 DOM
-
2026-05-10price $149,999
-
2026-04-14price $155,999
-
2026-03-05$179,999 Active
ⓘ Source: listings_history table (triggers on properties + properties_extension) + one-shot
backfill from property_details.listing_events for pre-trigger history.
Nearby sold comps map
Loading sold comps map…
Walkable amenities ~0.75 mi
Loading nearby amenities…
Taxation est. · year 1
- Rental income
- $38,307
- − Mortgage interest
- −$8,402
- − Property taxes
- −$2,250
- − Insurance
- −$750
- − Repairs & maintenance
- −$3,065
- − Management
- −$3,065
- − Depreciation
- −$4,364
- Taxable income
- $16,412
- Est. tax owed @ 24.0%
- −$3,939
- After-tax cash flow
- $13,884/yr
For passive investors: Depreciation is non-cash, so a rental often shows a tax loss while cash-flowing — sheltering income. Rental losses are passive: they offset passive income freely, and up to $25,000/yr can offset ordinary (W-2) income if you actively participate and your MAGI is under $100k (phasing out to $0 by $150k); unused losses carry forward. On sale, claimed depreciation is recaptured at up to 25%, and gains may owe capital-gains tax (a 1031 exchange can defer both). Figures are a year-1 estimate at your 24.0% rate — not tax advice; consult a CPA.
Condition & rehab AI · 13 photos
This fully remodeled 1973 manufactured home in a 55+ community is in excellent condition with new siding, paint, and flooring. It's move-in ready and offers a great value for both resale and rental.
Value-add opportunities
- Resale Paint exterior — Enhances curb appeal
- Rental Replace HVAC filter — Improves air quality and tenant satisfaction
Renovation cost estimate screening
Value-add ROI direction
- Resale Paint exterior — Enhances curb appeal ↑
- Rental Replace HVAC filter — Improves air quality and tenant satisfaction ↑
ⓘ Cost ranges are severity-bucket heuristics (US national rule-of-thumb). Get contractor quotes + a written scope before underwriting a rehab budget.
Schools (NCES district)
- District
- Kent School District
- NCES district ID
- 5303960
- Math proficiency
- 47% ▼ -1.00%
- Reading proficiency
- 57% ▼ -1.00%
- Median HH income
- $69,823
- Composite
- 48.25/100
- National rank
- #4714
- State rank
- #109 of 291 in WA
Livability — Fairwood
- Score
- 81/100
- State rank
- #77
- US rank
- #1431
Category grades
Schools grade is shown separately in the Schools card above.
Census & demographics
- Census place
- Fairwood, WA
- County
- King County · 2,251,916 people
- City population
- 16,920
- Metro
- Seattle-Tacoma-Bellevue, WA
- Population (ZIP)
- 42,406
- Household income
- $138,654
- Rent vs Own
- Severe rent burden
- 908.0
Population outlook (King County) Hauer SSP2
- Today (2025)
- 2,576,485 people
- By 2030
- 2,803,316 · +8.8%
- By 2040
- 3,255,921 · +26.4%
- By 2050
- 3,706,444 · +43.9%
- By 2075
- 4,746,063 · +84.2%
- By 2100
- 5,407,730 · +109.9%
Race, ethnicity, and origin ACS 2023
- Neighborhood character
- Diverse neighborhood (Simpson 0.68)
- Race & ethnicity
- White 48% Asian 29% Two or more races 15% Hispanic / Latino 9% Black 2%
- Hispanic origin (detail)
- Mexican 5%
- Common ancestry
- Portuguese 3% Italian 3% Slovak 2%
- Foreign-born
- 23% · China, Vietnam, Canada
- Languages at home
- 67% English-only · Chinese 9% Vietnamese 6% Spanish 5%
Political lean MEDSL · King
- 2024 margin
- Solid D (+51.7) · D 74.2% · R 22.5% · Other 3.4%
- 2008→2024 swing
- +9.6pp toward D · 2008: 42.1pp · 2024: 51.7pp
- All cycles
- 2024: D+51.7 2020: D+52.7 2016: D+50.4 2012: D+39.9 2008: D+42.1
Not yet ingested
- Civics
- —
Market trends
- HPI YoY
- ▼ -920.66%
- Current HPI
- 338.4495
- Rent YoY
- ▲ 0.29%
- Metro
- Seattle-Tacoma-Bellevue, WA
- State GDP YoY
- ▲ 4.65%
- F500 in state
- 22
Industry mix (Fortune 500 HQ in WA)
| Industry | F500 HQs | Revenue |
|---|---|---|
| Retail | 2 | $269B |
|
||
| Technology / Retail | 1 | $638B |
|
||
| Technology | 1 | $245B |
|
||
| Telecommunications | 1 | $38B |
|
||
| Food / Beverage | 1 | $36B |
|
||
| Automotive / Trucks | 1 | $34B |
|
||
Price history
-16.7% since first listed3 events — show timeline
- 2026-05-10 Price Changed $149,999 NWMLS as Distributed by MLS Grid
- 2026-04-14 Price Changed $155,999 NWMLS as Distributed by MLS Grid
- 2026-03-05 Listed $179,999 NWMLS as Distributed by MLS Grid
Cash-flow waterfall
monthlySold comps — $/sqft
last 12 mo · ≤1 miLoading sold comps…