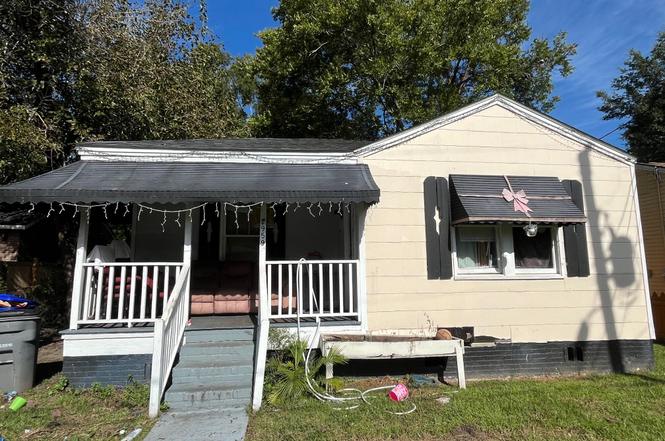
2959 Alabama Dr · North Charleston, SC
Flood risk 1/10 · Minimal
- FEMA flood zone
- X (unshaded)
- Chance of flooding over 30 yrs
- 0.0%
- Est. flood insurance / yr
- $507 – $1,088
Fire risk 1/10 · Minimal
- Est. fire insurance / yr
- $783 – $1,453
Heat risk 10/10 · Severe
- Hot days now (above 105°F)
- 7 days/yr
- Hot days in 30 yrs
- 18 days/yr
Wind risk 9/10 · Severe
- Chance of severe wind over 30 yrs
- 99.0%
Air-quality risk 3/10 · Minor
- Unhealthy air days now
- 3 days/yr
- Unhealthy air days in 30 yrs
- 3 days/yr
Risk factors via First Street. Map © Google.
Why this score? — see what drove the D+ grade
The composite is a weighted blend of 9 inputs, each scored 0–100. Each bar is that input's sub-score; the figure is the points it added to the 100-point composite (weight × sub-score).
- Cash flow +14.7/30.0
- ARV discount +9.9/15.0
- DSCR +4.5/10.0
- Schools +4.3/10.0
- Rent growth +4.1/5.0
- 1% rule +3.8/10.0
- Livability +3.3/5.0
- Condition / age +2.5/5.0
- Appreciation +0.0/10.0
$204,000
🖨 Deal sheet (PDF) 📄 Offer letter ✓ Due diligence
Listing remarks MLS
Beautiful renovated 3 bedroom 1 bathroom in one of the most popular neighborhoods in North Charleston.. The renovations include new floors, kitchen, paint throughout, granite countertops, stainless steel appliances and more.Perfect location close to both 526 and 26. Currently rented, this can be either a turnkey investment home for someone or you can choose to move into it and make it your personal home. Come by and take a look today.
Key facts
- Turn-key rental
- Waylyn neighborhood
- Centrally located
Tags
Property features AI
Finance
- HOA & community: No association fee (0), billed annually
Exterior
- Utilities: Public sewer; Charleston Water Service; Dominion Energy
- Home design: Single family detached residence; One story; Ground-level entry; Located in the Waylyn subdivision
- Construction: Residential construction
- Exterior features: Wooden fenced, enclosed yard; Asphalt roof
Interior
- Kitchen: Electric range; Range hood; Refrigerator
- Bedrooms: 3 bedrooms; Master bedroom on the lower level
- Bathrooms: 1 bathroom
- Interior features: Central air conditioning; Central electric heating
- Laundry & utility: Washer hookup; Electric dryer hookup
Neighborhood map
What this means for you Summary
Snapshot
- This is a 2-bed/1.0-bath single-family listed at $204k.
Deal economics
- At list price, monthly cash flow is $53 ($631/yr) — positive.
- The deal already cash-flows at list — no discount required.
- To meet the 1% rule (rent ≥ 1% of price), the offer needs to be $179k (12.1% below list).
- Recommended offer: $179k (12.1% below list) — sets the bar for 1% rule.
- Cap rate 6.6% vs local median 4.0% in North Charleston — top-decile yield for the area; either an underpriced asset or a hidden risk that comps aren't pricing in. Stress-test before assuming the spread holds.
Location & tenants
- Location reads 66/100 on livability (#122 in SC) — a middle-class / working-renter tenant base. Strengths: housing A+, health & safety A+, cost of living A; Watch: employment C-, crime F, amenities F.
- Charleston 01 (urban): math 48% / reading 53% proficiency, ranked #7 of 80 in SC (top 9%) — acceptable for families but not a draw, mixed tenant base, ~2y average lease.
- Zoned schools: Meeting Street Elementary (math 19% / reading 16%, grade F, #512 of 597 statewide, top 86%, 1,133 students, 100% FRL); Northwoods Middle (math 11% / reading 16%, grade F, #207 of 229 statewide, top 91%, 738 students, 100% FRL); North Charleston High (math 27% / reading 57%, grade F, #174 of 196 statewide, top 90%, 768 students, 100% FRL) — zoned schools average 100% FRL vs 44% district-wide (56 pts higher); higher-poverty schools than district average — tighter screening recommended.
- Zoned-school proficiency averages 24% at this address vs 50% district-wide (-26 pts) — the specific schools serving this property underperform the Charleston 01 average; the district grade overstates school quality for this exact location.
- Market conditions: Rents rising fast (+6.4%/yr); 205 active listings in the ZIP; 24 comparable units currently listed for rent nearby; rentals at typical pace (median 25d on market — plan ~3-4 weeks tenant-placement turnaround); 4,156 units permitted in Charleston County in 2024 (857 in 5+ unit buildings).
Forward outlook
- Local home prices are declining (-3.0%/yr); year-one equity from $1k of loan paydown is wiped out by about $6k of value loss. Plan a longer hold.
- Charleston County population projected at +44% by 2050 — long-run rental-demand tailwind backs the buy-and-hold thesis.
Negotiation context
- It's been on market 235 days — a 12% lower offer ($180k) is reasonable based on typical stale-listing flexibility.
- 3 sale attempts since 6y ago with the ask held roughly flat each time — persistent listings suggest the price (not the market) is what's stuck; bring a comps-based counter.
- Current owner paid $141k; 45% above their basis — modest negotiation headroom, anchor on the comps not their cost.
Risks & watch-outs
- Watch-outs: built in 1940 — expect roof / HVAC / electrical / plumbing capex.
- Climate carrying-cost: severe wind risk, 99% chance of damaging wind over 30y; extreme-heat days projected 7→18/yr by 2055 (HVAC capex compounding) — expect insurance premiums to compound above CPI over the hold.
Questions for the listing agent
- It's been on market 235 days. Have you received any prior offers? Is the seller open to a 12% concession, seller financing, or rate buy-down credit?
- Built in 1940 — when were the roof, HVAC, electrical panel, plumbing, and water heater last replaced?
- Why hasn't it sold? Are there any deal-killer items the seller is aware of (foundation, flood, title, zoning, code violations)?
- Is there a deadline driving the sale (1031 exchange, divorce, estate, relocation)? That informs how much negotiation room exists.
- Crime grade is F in this area — have there been break-ins, vandalism, or insurance claims at this property in the last 3 years? What carrier currently insures it and at what premium?
- The area grade is low — what's the realistic commute time and amenity access for the typical tenant pool here? Any planned neighborhood developments (good or bad) we should know about?
- What's the average days-on-market for RENTAL listings here right now (not sales)? A rising rental-DOM trend means longer vacancies and softer asking-rent achievability than the comps imply.
- What's the recent tenant-quality profile in this submarket — average credit score on applications, eviction rate, late-payment / NSF rate, and stable-employment percentage? A property-management company in the area should have these aggregated.
- How much new for-sale + rental construction is in the pipeline within 1–3 miles? Heavy new supply typically softens prices + rents 12–24 months out; constrained supply supports both.
Investment metrics
- 1% rule
- 0.88% ✗
- Cap rate
- 6.60%
- Cash-on-cash
- 1.10%
- DSCR
- 1.05
- GRM
- 9.5
CMA / ARV
- ARV (on-the-fly)
- $215,738
- Comps found
- 12
Show comp detail 12 sales within ~0.75 mi
| Address | Dist | Beds/Ba | Sqft | Sold | Price | $/sf | Match |
|---|---|---|---|---|---|---|---|
| 2965 Alabama Dr | 0.03mi | 3/2.0 (+1) | 800 (-0%) | 4mo | $305,000 | $381 | 86 |
| 4047 Gary Dr | 0.28mi | 2/1.0 | 782 (-2%) | 1mo | $150,000 | $192 | 82 |
| 2885 Charlene Dr | 0.16mi | 2/1.0 | 864 (+8%) | 5mo | $200,000 | $231 | 76 |
| 2744 Saratoga Rd | 0.26mi | 3/1.0 (+1) | 858 (+7%) | 2mo | $200,000 | $233 | 70 |
| 2652 Hull St | 0.45mi | 2/1.0 | 858 (+7%) | 3mo | $240,000 | $280 | 65 |
| 2762 E Surrey Dr | 0.68mi | 2/1.0 | 802 (0%) | 4mo | $240,000 | $299 | 65 |
| 2744 E Surrey Dr | 0.62mi | 2/1.0 | 832 (+4%) | 7mo | $215,000 | $258 | 59 |
| 2754 E Surrey Dr | 0.65mi | 3/1.0 (+1) | 780 (-3%) | 2mo | $210,000 | $269 | 58 |
| 2651 Poplin Ave | 0.50mi | 3/2.0 (+1) | 828 (+3%) | 5mo | $270,000 | $326 | 58 |
| 2718 E Surrey Dr | 0.52mi | 3/1.0 (+1) | 732 (-9%) | 1mo | $205,000 | $280 | 55 |
| 2607 Ranger Dr | 0.53mi | 2/1.0 | 884 (+10%) | 5mo | $170,000 | $192 | 54 |
| 2604 Wye Ln | 0.61mi | 2/1.0 | 901 (+12%) | 4mo | $229,000 | $254 | 48 |
Match score weights: distance 35% · size 25% · config 20% · recency 20%. Top-matched comps best support the ARV.
Projected returns pro-forma
-3.0% appreciation · 6.36% rent growth · sell at horizon
- IRR
- -10.9%
- Equity multiple
- 0.59×
- Total profit
- $-23,439
- Equity at exit
- $30,417
- IRR
- 2.5%
- Equity multiple
- 1.20×
- Total profit
- $11,469
- Equity at exit
- $17,638
Cash invested: $57,120 (down + closing). Projections, not guarantees.
Landlord ↔ Tenant lean methodology
- Overall (STATE)
- 90 Strongly Landlord-Friendly
- State South Carolina
- 90 Strongly Landlord-Friendly · R+6
- County
- — inherits STATE
- City
- — inherits STATE
ZIP-level market 29405
- Home prices YoY
- -29.0%
- Rents YoY
- 6.4%
- Active inventory
- 205
- Price-to-rent
- 9.5×
Monthly cashflow live
- Estimated rent
- $1,794 high interval (Pro) →
- Mortgage (P&I)
- −$1,070
- Tax from tax record
- −$210 /mo · $2,519/yr
- Insurance
- −$85
- HOA
- −$0
- Vacancy / Maint / Mgmt
- −$377
- Net cashflow
- $53
Break-even live
Sensitivity live
| Price | -10% $168 | -5% $110 | +0% $53 | +5% $-5 | +10% $-63 |
|---|---|---|---|---|---|
| Rent | -10% $-89 | -5% $-18 | +0% $53 | +5% $123 | +10% $194 |
| Rate | -1.0pp $155 | -0.5pp $104 | base $53 | +0.5pp $0 | +1.0pp $-54 |
UW: 25.0% down · 7.5% · 30yr · 1.5% tax · 5.0% vac · 8.0% maint · 8.0% mgmt
Financing live
Cash to close
- Down payment
- $51,000
- Closing costs
- $6,120
- Reserves months
- —
- Total cash needed
- —
Loan-product check · same deal, 3 products live
Conventional
25% down · 7.5% · 30yr
- Down + closing
- —
- Monthly P&I
- —
- Monthly cashflow
- —
- DSCR
- —
- Eligible?
- —
Personal DTI + credit; lowest rate.
DSCR
20% down · 8.5% · 30yr
- Down + closing
- —
- Monthly P&I
- —
- Monthly cashflow
- —
- DSCR
- —
- Eligible?
- —
No personal income docs; deal must DSCR.
Hard money
10% down · 12.0% · 12mo
- Down + closing
- —
- Monthly P&I
- —
- Monthly cashflow
- —
- DSCR
- —
- Eligible?
- —
Short-term bridge; refi at stabilization.
Rent comps 24 comps
| Address | Beds | Baths | Sqft | Rent | $/sqft | DOM | Units | Dist |
|---|---|---|---|---|---|---|---|---|
| 4025 Gary Dr Unit A North Charleston, SC | 3.0 | 1.0 | 925 | $1,600 | $1.73 | 25d | 1 | 0.22mi |
| 4008 Gary Dr North Charleston, SC | 2.0 | 1.0 | 676 | $1,300 | $1.92 | 16d | 1 | 0.24mi |
| 2708 Busch Ave North Charleston, SC | 3.0 | 1.5 | 1025 | $2,100 | $2.05 | 25d | 1 | 0.28mi |
| 2755 Louise Dr North Charleston, SC | 3.0 | 1.0 | 1025 | $1,800 | $1.76 | 25d | 1 | 0.29mi |
| 2808 Martha Dr North Charleston, SC | 3.0 | 2.0 | 1025 | $2,250 | $2.20 | 25d | 1 | 0.30mi |
| 2679 Olympia Ave Unit A North Charleston, SC | 3.0 | 1.0 | 1100 | $1,995 | $1.81 | 25d | 1 | 0.47mi |
| 2667 Olympia Ave North Charleston, SC | 2.0 | 2.0 | 899 | $1,500 | $1.67 | 25d | 1 | 0.47mi |
| 3925 Hilda St North Charleston, SC | 3.0 | 1.0 | 900 | $1,700 | $1.89 | 23d | 1 | 0.52mi |
| 2645 Oregon Ave North Charleston, SC | 3.0 | 2.0 | 916 | $2,300 | $2.51 | 25d | 1 | 0.57mi |
| 2512 Bennett Yard Rd Unit B North Charleston, SC | 3.0 | 1.5 | 834 | $1,800 | $2.16 | 25d | 1 | 0.70mi |
| 2674 Madden Dr North Charleston, SC | 3.0 | 2.0 | 858 | $2,200 | $2.56 | 25d | 1 | 0.80mi |
| 2620 Woodlawn Ave North Charleston, SC | 3.0 | 1.0 | 892 | $1,695 | $1.90 | 25d | 1 | 0.81mi |
| 2620 Woodlawn Ave North Charleston, SC | 3.0 | 1.0 | 892 | $1,695 | $1.90 | 12d | 1 | 0.81mi |
| 2125 Aberdeen Ave Unit 102 North Charleston, SC | 2.0 | 1.0 | 625 | $1,375 | $2.20 | 4d | 1 | 0.92mi |
| 4025 Bamberg Ave Unit 4025-5 North Charleston, SC | 2.0 | 1.0 | 800 | $1,400 | $1.75 | 25d | 1 | 0.95mi |
| 2624 S Allen Dr North Charleston, SC | 3.0 | 2.0 | 1000 | $1,600 | $1.60 | 25d | 1 | 1.01mi |
| 3229 W Montague Ave North Charleston, SC | 1.0–2.0 | 1.0–2.0 | 946 | $2,601 | $2.75 | 4d | 32 | 1.03mi |
| 2636 S Allen Dr North Charleston, SC | 3.0 | 2.0 | 1100 | $2,200 | $2.00 | 16d | 1 | 1.04mi |
| 3545 1/2 Admiral Dr Unit 4 North Charleston, SC | 2.0 | 1.0 | 680 | $1,000 | $1.47 | 16d | 1 | 1.16mi |
| 4003 S Rhett Ave Unit B6 North Charleston, SC | 2.0 | 1.0 | 640 | $1,350 | $2.11 | 25d | 1 | 1.22mi |
| 4003 S Rhett Ave Unit C5 North Charleston, SC | 2.0 | 1.0 | 640 | $1,399 | $2.19 | 21d | 1 | 1.22mi |
| 1920 McMillan Ave North Charleston, SC | 1.0–3.0 | 1.0 | 777 | $1,300 | $1.67 | 25d | 1 | 1.27mi |
| 2116 Commander Rd North Charleston, SC | 3.0 | 2.0 | 1050 | $2,250 | $2.14 | 4d | 1 | 1.34mi |
| 4251 S Rhett Ave North Charleston, SC | 1.0–3.0 | 1.0–2.5 | 1119 | $2,462 | $2.20 | 4d | 16 | 1.50mi |
Listing history 24 events
-
2026-06-22days on market $204,000 Active 235 DOM
-
2026-06-18days on market $204,000 Active 232 DOM
-
2026-06-17days on market $204,000 Active 231 DOM
-
2026-06-16days on market $204,000 Active 230 DOM
-
2026-06-15days on market $204,000 Active 229 DOM
-
2026-06-10days on market $204,000 Active 224 DOM
-
2026-06-09days on market $204,000 Active 223 DOM
-
2026-06-08days on market $204,000 Active 222 DOM
-
2026-06-07days on market $204,000 Active 221 DOM
-
2026-06-05days on market $204,000 Active 218 DOM
-
2026-06-03days on market $204,000 Active 217 DOM
-
2026-06-01days on market $204,000 Active 215 DOM
-
2026-05-31days on market $204,000 Active 214 DOM
-
2026-05-13price $204,000
-
2026-02-11price $205,000
-
2026-02-01status Active
-
2025-11-26historical Active Under Contract
-
2025-11-06price $209,000
-
2025-10-29$214,000 Active
-
2020-08-06soldstatus $141,000 Closed 438-char remark
Show marketing remark (438 chars)
Beautiful renovated 3 bedroom 1 bathroom in one of the most popular neighborhoods in North Charleston.. The renovations include new floors, kitchen, paint throughout, granite countertops, stainless steel appliances and more.Perfect location close to both 526 and 26. Currently rented, this can be either a turnkey investment home for someone or you can choose to move into it and make it your personal home. Come by and take a look today.
-
2020-07-06historical Active Contingent 438-char remark
Show marketing remark (438 chars)
Beautiful renovated 3 bedroom 1 bathroom in one of the most popular neighborhoods in North Charleston.. The renovations include new floors, kitchen, paint throughout, granite countertops, stainless steel appliances and more.Perfect location close to both 526 and 26. Currently rented, this can be either a turnkey investment home for someone or you can choose to move into it and make it your personal home. Come by and take a look today.
-
2020-07-02$139,999 Active 438-char remark
Show marketing remark (438 chars)
Beautiful renovated 3 bedroom 1 bathroom in one of the most popular neighborhoods in North Charleston.. The renovations include new floors, kitchen, paint throughout, granite countertops, stainless steel appliances and more.Perfect location close to both 526 and 26. Currently rented, this can be either a turnkey investment home for someone or you can choose to move into it and make it your personal home. Come by and take a look today.
-
1996-02-29soldstatus $17,200
-
1991-09-26soldstatus $27,900
ⓘ Source: listings_history table (triggers on properties + properties_extension) + one-shot
backfill from property_details.listing_events for pre-trigger history.
Tax reassessment forecast SC · Resets to sale price
- Current annual tax
- $2,519 · $210/mo
- Projected year-2 tax
- $2,519 · $210/mo
- Expected delta
- $0/yr ($0/mo · 0.0%)
ⓘ Screening estimate from a state-policy table — verify with the county assessor before closing.
Climate risk First Street
- Flood 1/10 Low FEMA zone X (unshaded) · 0% chance over 30 yrs
- Wildfire 1/10 Low
- Heat 10/10 Extreme 7 d/yr ≥105°F today · 18 d/yr by 30 yrs out
- Wind 9/10 Extreme 99% chance of damaging wind over 30 yrs
- Air quality 3/10 Moderate 3 unhealthy d/yr today · 3 by 30 yrs out
Nearby sold comps map
Loading sold comps map…
Walkable amenities ~0.75 mi
Loading nearby amenities…
Taxation est. · year 1
- Rental income
- $21,529
- − Mortgage interest
- −$11,427
- − Property taxes
- −$2,519
- − Insurance
- −$1,020
- − Repairs & maintenance
- −$1,722
- − Management
- −$1,722
- − Depreciation
- −$5,935
- Taxable loss
- −$2,817
- Est. tax savings @ 24.0%
- +$676
- After-tax cash flow
- $1,307/yr
For passive investors: Depreciation is non-cash, so a rental often shows a tax loss while cash-flowing — sheltering income. Rental losses are passive: they offset passive income freely, and up to $25,000/yr can offset ordinary (W-2) income if you actively participate and your MAGI is under $100k (phasing out to $0 by $150k); unused losses carry forward. On sale, claimed depreciation is recaptured at up to 25%, and gains may owe capital-gains tax (a 1031 exchange can defer both). Figures are a year-1 estimate at your 24.0% rate — not tax advice; consult a CPA.
Schools (NCES district)
- District
- Charleston 01
- NCES district ID
- 4501440
- Math proficiency
- 48% ▼ -2.00%
- Reading proficiency
- 53% ▬ 0.00%
- Median HH income
- $52,376
- Composite
- 43.41/100
- National rank
- #3018
- State rank
- #7 of 80 in SC
Livability — North Charleston
- Score
- 66/100
- State rank
- #122
- US rank
- #12222
Category grades
Schools grade is shown separately in the Schools card above.
Census & demographics
- Census place
- North Charleston, SC
- County
- Charleston County · 366,793 people
- City population
- 108,266
- Metro
- Charleston-North Charleston, SC
- Population (ZIP)
- 26,254
- Household income
- $56,600
- Rent vs Own
- Severe rent burden
- 1564.0
Population outlook (Charleston County) Hauer SSP2
- Today (2025)
- 480,562 people
- By 2030
- 525,921 · +9.4%
- By 2040
- 612,189 · +27.4%
- By 2050
- 691,627 · +43.9%
- By 2075
- 847,979 · +76.5%
- By 2100
- 926,482 · +92.8%
Race, ethnicity, and origin ACS 2023
- Neighborhood character
- Majority Black (57%)
- Race & ethnicity
- Black 57% White 34% Hispanic / Latino 5% Two or more races 4%
- Hispanic origin (detail)
- Mexican 2%
- Common ancestry
- Slovak 1% Lithuanian 1% Italian 1%
- Foreign-born
- 4% · Canada
- Languages at home
- 93% English-only · Spanish 5%
Political lean MEDSL · Charleston
- 2024 margin
- Lean D (+5.7) · D 51.9% · R 46.3% · Other 1.8%
- 2008→2024 swing
- -2.7pp toward R · 2008: 8.3pp · 2024: 5.7pp
- All cycles
- 2024: D+5.7 2020: D+12.9 2016: D+7.9 2012: D+2.4 2008: D+8.3
Not yet ingested
- Civics
- —
Market trends
- HPI YoY
- ▼ -152.19%
- Current HPI
- 372.8886
- Rent YoY
- ▲ 6.36%
- Metro
- Charleston-North Charleston, SC
- State GDP YoY
- ▲ 4.51%
- F500 in state
- 2
Industry mix (Fortune 500 HQ in SC)
| Industry | F500 HQs | Revenue |
|---|---|---|
| Packaging | 1 | $7B |
|
||
Price history
+631.2% since first listed11 events — show timeline
- 2026-05-13 Price Changed $204,000 Charleston Trident MLS
- 2026-02-11 Price Changed $205,000 Charleston Trident MLS
- 2026-02-01 Relisted — Charleston Trident MLS
- 2025-11-26 Contingent — Charleston Trident MLS
- 2025-11-06 Price Changed $209,000 Charleston Trident MLS
- 2025-10-29 Listed $214,000 Charleston Trident MLS
- 2020-08-06 Sold (MLS) $141,000 Charleston Trident MLS
- 2020-07-06 Contingent — Charleston Trident MLS
- 2020-07-02 Listed $139,999 Charleston Trident MLS
- 1996-02-29 Sold (Public Records) $17,200 Public Records
- 1991-09-26 Sold (Public Records) $27,900 Public Records
Property tax history
+16.1%/yrLatest (2022): $2,519 · +0.8% YoY. Source: county tax records.
Cash-flow waterfall
monthlySold comps — $/sqft
last 12 mo · ≤1 miLoading sold comps…