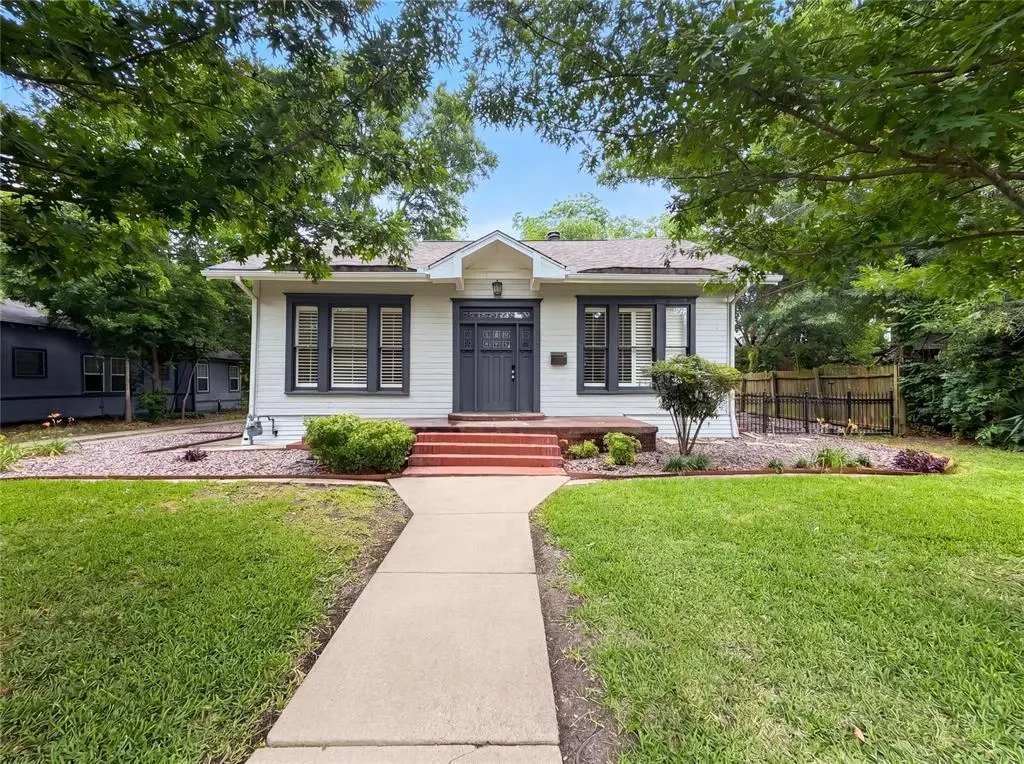
3919 Houston St · Greenville, TX
Flood risk 1/10 · Minimal
- FEMA flood zone
- X (unshaded)
- Chance of flooding over 30 yrs
- 0.0%
- Est. flood insurance / yr
- $507 – $1,088
Fire risk 5/10 · Moderate
- Est. fire insurance / yr
- $1,222 – $2,270
Heat risk 7/10 · Major
- Hot days now (above 110°F)
- 7 days/yr
- Hot days in 30 yrs
- 23 days/yr
Wind risk 6/10 · Moderate
- Chance of severe wind over 30 yrs
- 27.0%
Air-quality risk 2/10 · Minimal
- Unhealthy air days now
- 1 days/yr
- Unhealthy air days in 30 yrs
- 1 days/yr
Risk factors via First Street. Map © Google.
Why this score? — see what drove the C- grade
The composite is a weighted blend of 9 inputs, each scored 0–100. Each bar is that input's sub-score; the figure is the points it added to the 100-point composite (weight × sub-score).
- Cash flow +17.5/30.0
- ARV discount +15.0/15.0
- DSCR +5.4/10.0
- 1% rule +4.5/10.0
- Livability +3.9/5.0
- Rent growth +2.7/5.0
- Condition / age +2.5/5.0
- Schools +2.0/10.0
- Appreciation +0.0/10.0
$160,000
🖨 Deal sheet 📄 Offer letter ✓ Due diligence
Listing remarks
Picture yourself at 3919 Houston St, a residence recently updated with a new roof and fresh exterior paint. Inside, fresh interior paint extends throughout the living spaces, which include a comfortable fireplace. The kitchen is equipped with all stainless steel appliances and an accent backsplash. The primary bathroom contains a separate tub and shower along with double sinks. The exterior provides a fenced in ta deck in backyard. This updated residence with thoughtful features is ready for its next chapter. Home comes with a 100-Day Home Warranty and a 7-Day Home Test Drive to move in 7 days early for free
Key facts
- Double sinks
- Fresh exterior paint
- New roof
Tags
Property features AI
Finance
- Other: Property located in Hunt County, Orig Town Of Greenville subdivision
- Financial info: Accepts Cash, Conventional, and VA financing; Second mortgage: none
- HOA & community: No homeowners association
Exterior
- Parking: Driveway (no covered or garage spaces, no carport)
- Utilities: City water; City sewer; No municipal utility district
- Home design: Single-family residence; One story; Residential property
- Construction: Wood construction; Pillar/post/pier foundation; Built in 1960
- Exterior features: Back yard fencing
Interior
- Kitchen: Dishwasher
- Bedrooms: 2 bedrooms (primary bedroom on main level)
- Flooring: Hardwood floors; Laminate floors
- Bathrooms: 1 full bathroom
- Heating & cooling: Central heating; Central electric air conditioning
- Interior features: One living area and one dining area; Living room fireplace; Other interior features
Neighborhood map
What this means for you Summary
Snapshot
- This is a 2-bed/2.0-bath single-family listed at $160k.
Deal economics
- At list price, monthly cash flow is $122 ($1k/yr) — positive.
- The deal already cash-flows at list — no discount required.
- To meet the 1% rule (rent ≥ 1% of price), the offer needs to be $152k (5.0% below list).
- Recommended offer: $152k (5.0% below list) — sets the bar for 1% rule.
- Cap rate 7.2% vs local median 4.1% in Greenville — top-decile yield for the area; either an underpriced asset or a hidden risk that comps aren't pricing in. Stress-test before assuming the spread holds.
Location & tenants
- Location reads 77/100 on livability (#78 in TX, #2,719 nationally) — a middle-class / working-renter tenant base. Strengths: cost of living A+, housing A+, health & safety A; Watch: employment D, commute F.
- Greenville ISD (town): math 20% / reading 26% proficiency, ranked #743 of 826 in TX (top 90%) — low school quality limits family demand, transient renter base, plan for 1-2y turnover.
- Zoned schools: Lamar El (math 28% / reading 33%, grade F, #2,464 of 4,322 statewide, top 58%, 554 students, 59% FRL) — zoned schools at 59% FRL track the district average.
- Market conditions: Rents flat; 396 active listings in the ZIP; 40 comparable units currently listed for rent nearby; rentals at typical pace (median 25d on market — plan ~3-4 weeks tenant-placement turnaround); 1,289 units permitted in Hunt County in 2024 (527 in 5+ unit buildings).
- This rent runs 30% of the median local income ($60k/yr) — at the standard rent-burdened threshold; future hikes will face affordability resistance.
Forward outlook
- Local home prices are declining (-3.0%/yr); year-one equity from $1k of loan paydown is wiped out by about $5k of value loss. Plan a longer hold.
- Hunt County population projected at +15% by 2050 — modest demand growth; plan on rents tracking national, not racing it.
Negotiation context
- It's been on market 16 days — a 2% lower offer ($158k) is reasonable based on typical stale-listing flexibility.
Risks & watch-outs
- Climate carrying-cost: major wind risk, 27% chance of damaging wind over 30y; moderate wildfire risk; extreme-heat days projected 7→23/yr by 2055 (HVAC capex compounding) — expect insurance premiums to compound above CPI over the hold.
Questions for the listing agent
- Built in 1960 — when were the roof, HVAC, electrical panel, plumbing, and water heater last replaced?
- Is there a deadline driving the sale (1031 exchange, divorce, estate, relocation)? That informs how much negotiation room exists.
- Schools are D-rated, which usually means shorter tenancies and higher turnover. Who's the typical renter profile here, and what's been the actual vacancy rate?
- What's the average days-on-market for RENTAL listings here right now (not sales)? A rising rental-DOM trend means longer vacancies and softer asking-rent achievability than the comps imply.
- What's the recent tenant-quality profile in this submarket — average credit score on applications, eviction rate, late-payment / NSF rate, and stable-employment percentage? A property-management company in the area should have these aggregated.
- How much new for-sale + rental construction is in the pipeline within 1–3 miles? Heavy new supply typically softens prices + rents 12–24 months out; constrained supply supports both.
Investment metrics
- 1% rule
- 0.95% ✗
- Cap rate
- 7.21%
- Cash-on-cash
- 3.26%
- DSCR
- 1.14
- GRM
- 8.8
CMA / ARV
- ARV (median comp)
- $194,345
- List price
- $160,000
- Delta
- -17.67%
- Verdict
- UNDERPRICED
- Comps
- 20 within 1.0 mi
Show comp detail 12 sales within ~0.75 mi
| Address | Dist | Beds/Ba | Sqft | Sold | Price | $/sf | Match |
|---|---|---|---|---|---|---|---|
| 3919 Houston St | 0.00mi | 2/1.0 | 1,509 (-2%) | 0mo | $160,000 | $106 | 92 |
| 1707 Pollard St | 0.29mi | 3/2.0 (+1) | 1,522 (-1%) | 3mo | $229,900 | $151 | 77 |
| 3920 Pine St | 0.14mi | 3/1.0 (+1) | 1,496 (-3%) | 7mo | $140,000 | $94 | 74 |
| 3816 Houston St | 0.08mi | 3/2.0 (+1) | 1,673 (+9%) | 7mo | $214,900 | $128 | 71 |
| 2303 Walworth St | 0.12mi | 2/1.0 | 1,406 (-9%) | 7mo | $79,900 | $57 | 70 |
| 2309 Marshall St | 0.33mi | 3/2.0 (+1) | 1,401 (-9%) | 1mo | $235,000 | $168 | 64 |
| 3912 Gordon St | 0.12mi | 3/2.0 (+1) | 1,330 (-14%) | 5mo | $199,900 | $150 | 62 |
| 2820 Vinnie St | 0.57mi | 2/2.0 | 1,390 (-10%) | 1mo | $115,000 | $83 | 57 |
| 4311 King St | 0.53mi | 3/2.0 (+1) | 1,700 (+10%) | 6mo | $269,000 | $158 | 48 |
| 3201 King St | 0.59mi | 3/2.0 (+1) | 1,351 (-12%) | 1mo | $199,999 | $148 | 46 |
| 925 Jones St | 0.68mi | 3/2.5 (+1) | 1,408 (-8%) | 2mo | $219,900 | $156 | 46 |
| 802 Division St | 0.73mi | 3/2.0 (+1) | 1,338 (-13%) | 3mo | $232,000 | $173 | 37 |
Match score weights: distance 35% · size 25% · config 20% · recency 20%. Top-matched comps best support the ARV.
Projected returns pro-forma
-3.0% appreciation · 0.62% rent growth · sell at horizon
- IRR
- -13.8%
- Equity multiple
- 0.52×
- Total profit
- $-21,728
- Equity at exit
- $23,857
- IRR
- -9.2%
- Equity multiple
- 0.49×
- Total profit
- $-22,825
- Equity at exit
- $13,834
Cash invested: $44,800 (down + closing). Projections, not guarantees.
Landlord ↔ Tenant lean methodology
- Overall (STATE)
- 87 Strongly Landlord-Friendly
- State Texas
- 87 Strongly Landlord-Friendly · R+5
- County
- — inherits STATE
- City
- — inherits STATE
ZIP-level market 75401
- Home prices YoY
- -20.7%
- Rents YoY
- 0.6%
- Active inventory
- 396
- Price-to-rent
- 8.8×
Monthly cashflow live
- Estimated rent
- $1,520 high interval (Pro) →
- Mortgage (P&I)
- −$839
- Tax from tax record
- −$173 /mo · $2,077/yr
- Insurance
- −$67
- HOA
- −$0
- Vacancy / Maint / Mgmt
- −$319
- Net cashflow
- $122
Break-even live
UW: 25.0% down · 7.5% · 30yr · 1.5% tax · 5.0% vac · 8.0% maint · 8.0% mgmt
Financing live
Cash to close
- Down payment
- $40,000
- Closing costs
- $4,800
- Reserves months
- —
- Total cash needed
- —
Loan-product check · same deal, 3 products live
Conventional
25% down · 7.5% · 30yr
- Down + closing
- —
- Monthly P&I
- —
- Monthly cashflow
- —
- DSCR
- —
- Eligible?
- —
Personal DTI + credit; lowest rate.
DSCR
20% down · 8.5% · 30yr
- Down + closing
- —
- Monthly P&I
- —
- Monthly cashflow
- —
- DSCR
- —
- Eligible?
- —
No personal income docs; deal must DSCR.
Hard money
10% down · 12.0% · 12mo
- Down + closing
- —
- Monthly P&I
- —
- Monthly cashflow
- —
- DSCR
- —
- Eligible?
- —
Short-term bridge; refi at stabilization.
Rent comps 40 comps
| Address | Beds | Baths | Sqft | Rent | $/sqft | DOM | Units | Dist |
|---|---|---|---|---|---|---|---|---|
| 4102 Gordon St Greenville, TX | 3.0 | 2.0 | 1296 | $1,675 | $1.29 | 7d | 1 | 0.15mi |
| 4102 Gordon St Greenville, TX | 3.0 | 2.0 | 1296 | $1,675 | $1.29 | 11d | 1 | 0.15mi |
| 4102 Gordon St Greenville, TX | 3.0 | 2.0 | 1296 | $1,675 | $1.29 | 24d | 1 | 0.15mi |
| 4105 Stuart St Greenville, TX | 3.0 | 2.0 | 1558 | $1,675 | $1.08 | 17d | 1 | 0.17mi |
| 4205 Stuart St Greenville, TX | 3.0 | 2.0 | 1228 | $1,790 | $1.46 | 7d | 1 | 0.19mi |
| 4214 Johnson St Greenville, TX | 3.0 | 1.0 | 1096 | $1,250 | $1.14 | 24d | 1 | 0.25mi |
| 3415 Henderson St Greenville, TX | 3.0 | 2.0 | 1299 | $1,650 | $1.27 | 13d | 1 | 0.26mi |
| 1421 Jones St Greenville, TX | 3.0 | 2.0 | 1617 | $1,750 | $1.08 | 3d | 1 | 0.36mi |
| 1421 Jones St Greenville, TX | 3.0 | 12.0 | 1618 | $1,750 | $1.08 | 24d | 1 | 0.36mi |
| 2010 Morse St Greenville, TX | 3.0 | 2.0 | 1248 | $1,400 | $1.12 | 22d | 1 | 0.41mi |
| 2704 Jones St Greenville, TX | 3.0 | 2.0 | 1273 | $1,550 | $1.22 | 2d | 1 | 0.41mi |
| 3112 Travis St Greenville, TX | 3.0 | 2.0 | 1200 | $1,400 | $1.17 | 43d | 1 | 0.41mi |
| 1412 Hemphill St Greenville, TX | 3.0 | 2.0 | 1200 | $500 | $0.42 | 24d | 1 | 0.44mi |
| 1228 Jones St Greenville, TX | 3.0 | 2.0 | 1234 | $1,700 | $1.38 | 22d | 1 | 0.51mi |
| 3110 Saint John St Unit A Greenville, TX | 3.0 | 2.0 | 1273 | $1,425 | $1.12 | 43d | 1 | 0.53mi |
| 3110 Saint John St Unit B Greenville, TX | 3.0 | 2.0 | 1273 | $1,400 | $1.10 | 24d | 1 | 0.53mi |
| 3110 Saint John St Greenville, TX | 3.0 | 2.0 | 1273 | $1,500 | $1.18 | 43d | 1 | 0.53mi |
| 3110 Saint John St Unit B Greenville, TX | 3.0 | 2.0 | 1273 | $1,450 | $1.14 | 44d | 1 | 0.53mi |
| 3110 Saint John St Unit A Greenville, TX | 3.0 | 2.0 | 1273 | $1,500 | $1.18 | 44d | 1 | 0.53mi |
| 1110 Jones St Greenville, TX | 3.0 | 2.0 | 1090 | $1,440 | $1.32 | 2d | 1 | 0.60mi |
| 3214 King St Greenville, TX | 3.0 | 2.0 | 1068 | $1,250 | $1.17 | 11d | 1 | 0.62mi |
| 1107 Hemphill St Greenville, TX | 3.0 | 2.0 | 1090 | $1,190 | $1.09 | 43d | 1 | 0.63mi |
| 1214 Interstate Highway 30 Greenville, TX | 1.0–3.0 | 1.0–2.0 | 900 | $1,185 | $1.32 | 1d | 1 | 0.67mi |
| 3118 Hemphill St Greenville, TX | 3.0 | 2.0 | 1125 | $1,600 | $1.42 | 43d | 1 | 0.68mi |
| 3412 Marshall St Unit A Greenville, TX | 3.0 | 2.0 | 1068 | $1,250 | $1.17 | 24d | 1 | 0.78mi |
| 3412 Marshall St Greenville, TX | 3.0 | 2.0 | 1068 | $1,250 | $1.17 | 2d | 1 | 0.78mi |
| 2901 Lee St Apt 1 Greenville, TX | 2.0 | 2.0 | 1250 | $1,575 | $1.26 | 43d | 1 | 0.84mi |
| 2113 Henry St Unit B Greenville, TX | 3.0 | 2.0 | 1068 | $1,400 | $1.31 | 24d | 1 | 0.87mi |
| 2113 Henry St Greenville, TX | 3.0 | 2.0 | 1068 | $1,400 | $1.31 | 17d | 1 | 0.87mi |
| 2309 Wesley St Unit A Greenville, TX | 2.0 | 1.0 | 1150 | $1,175 | $1.02 | 43d | 1 | 0.89mi |
| 2309 Wesley St Unit D Greenville, TX | 2.0 | 1.0 | 1150 | $1,100 | $0.96 | 22d | 1 | 0.89mi |
| 2107 Church St Unit A Greenville, TX | 3.0 | 2.0 | 1069 | $1,400 | $1.31 | 24d | 1 | 0.92mi |
| 2107 Church St Unit B Greenville, TX | 3.0 | 2.0 | 1069 | $1,400 | $1.31 | 43d | 1 | 0.92mi |
| 2006 Church St Greenville, TX | 3.0 | 2.0 | 1463 | $1,600 | $1.09 | 43d | 1 | 0.95mi |
| 2212 Church St Unit A Greenville, TX | 3.0 | 2.0 | 1254 | $1,595 | $1.27 | 6d | 1 | 0.95mi |
| 2106 Stonewall St Unit 2B Greenville, TX | 2.0 | 1.0 | 1220 | $1,265 | $1.04 | 19d | 1 | 0.97mi |
| 2106 Stonewall St Unit 2B Greenville, TX | 2.0 | 1.0 | 1200 | $1,263 | $1.05 | 11d | 1 | 0.97mi |
| 1901 Bourland St Unit A Greenville, TX | 3.0 | 1.0 | 1100 | $1,399 | $1.27 | 43d | 1 | 0.97mi |
| 2305 Bourland St Greenville, TX | 3.0 | 2.0 | 1320 | $1,900 | $1.44 | 43d | 1 | 0.98mi |
| 2015 Stuart St Unit A Greenville, TX | 3.0 | 2.0 | 1069 | $1,400 | $1.31 | 24d | 1 | 0.99mi |
Listing history 2 events
-
2026-05-13$160,000 Active 615-char remark
-
1984-04-01soldstatus
ⓘ Source: listings_history table (triggers on properties + properties_extension) + one-shot
backfill from property_details.listing_events for pre-trigger history.
Tax reassessment forecast TX · Resets to sale price
- Current annual tax
- $2,077 · $173/mo
- Projected year-2 tax
- $2,928 · $244/mo
- Expected delta
- +$851/yr (+$71/mo · 40.9%)
ⓘ Screening estimate from a state-policy table — verify with the county assessor before closing.
Climate risk First Street
- Flood 1/10 Low FEMA zone X (unshaded) · 0% chance over 30 yrs
- Wildfire 5/10 Major
- Heat 7/10 Severe 7 d/yr ≥110°F today · 23 d/yr by 30 yrs out
- Wind 6/10 Major 27% chance of damaging wind over 30 yrs
- Air quality 2/10 Low 1 unhealthy d/yr today · 1 by 30 yrs out
Nearby sold comps map
Loading sold comps map…
Walkable amenities ~0.75 mi
Loading nearby amenities…
Taxation est. · year 1
- Rental income
- $18,235
- − Mortgage interest
- −$8,962
- − Property taxes
- −$2,077
- − Insurance
- −$800
- − Repairs & maintenance
- −$1,459
- − Management
- −$1,459
- − Depreciation
- −$4,655
- Taxable loss
- −$1,177
- Est. tax savings @ 24.0%
- +$282
- After-tax cash flow
- $1,742/yr
For passive investors: Depreciation is non-cash, so a rental often shows a tax loss while cash-flowing — sheltering income. Rental losses are passive: they offset passive income freely, and up to $25,000/yr can offset ordinary (W-2) income if you actively participate and your MAGI is under $100k (phasing out to $0 by $150k); unused losses carry forward. On sale, claimed depreciation is recaptured at up to 25%, and gains may owe capital-gains tax (a 1031 exchange can defer both). Figures are a year-1 estimate at your 24.0% rate — not tax advice; consult a CPA.
Schools (NCES district)
- District
- Greenville ISD
- NCES district ID
- 4821720
- Math proficiency
- 20% ▼ -12.00%
- Reading proficiency
- 26% ▼ -7.00%
- Median HH income
- $41,374
- Composite
- 19.56/100
- National rank
- #8759
- State rank
- #743 of 826 in TX
Livability — Greenville
- Score
- 77/100
- State rank
- #78
- US rank
- #2719
Category grades
Schools grade is shown separately in the Schools card above.
Census & demographics
- Census place
- Greenville, TX
- County
- Hunt County · 71,969 people
- City population
- 42,767
- Metro
- Dallas-Fort Worth-Arlington, TX
- Population (ZIP)
- 22,669
- Household income
- $59,908
- Rent vs Own
- Severe rent burden
- 638.0
Population outlook (Hunt County) Hauer SSP2
- Today (2025)
- 97,090 people
- By 2030
- 100,452 · +3.5%
- By 2040
- 106,544 · +9.7%
- By 2050
- 111,218 · +14.6%
- By 2075
- 121,695 · +25.3%
- By 2100
- 123,683 · +27.4%
Race, ethnicity, and origin ACS 2023
- Neighborhood character
- Diverse neighborhood (Simpson 0.62)
- Race & ethnicity
- White 51% Hispanic / Latino 32% Black 13% Two or more races 11%
- Hispanic origin (detail)
- Mexican 30%
- Common ancestry
- Slovak 2% Lithuanian 1% Iranian 1%
- Foreign-born
- 13% · Canada
- Languages at home
- 75% English-only · Spanish 24%
Political lean MEDSL · Hunt
- 2024 margin
- Solid R (+55.5) · D 21.9% · R 77.4%
- 2008→2024 swing
- -14.9pp toward R · 2008: -40.6pp · 2024: -55.5pp
- All cycles
- 2024: R+55.5 2020: R+52.5 2016: R+56.3 2012: R+51.2 2008: R+40.6
Not yet ingested
- Civics
- —
Market trends
- HPI YoY
- ▼ -88.45%
- Current HPI
- 339.0287
- Rent YoY
- ▲ 0.62%
- Metro
- Dallas-Fort Worth-Arlington, TX
- State GDP YoY
- ▲ 3.95%
- F500 in state
- 110
Industry mix (Fortune 500 HQ in TX)
| Industry | F500 HQs | Revenue |
|---|---|---|
| Energy | 16 | $1,198B |
|
||
| Technology | 5 | $198B |
|
||
| Engineering / Construction | 4 | $72B |
|
||
| Energy Services | 3 | $60B |
|
||
| Utilities | 3 | $41B |
|
||
| Healthcare | 2 | $330B |
|
||
Price history
5 events — show timeline
- 2026-06-11 Sold (MLS) — NTREIS
- 2026-05-29 Pending — NTREIS
- 2026-05-19 Contingent — NTREIS
- 2026-05-13 Listed $160,000 NTREIS
- 1984-04-01 Sold (Public Records) — Public Records
Property tax history
+3.4%/yrLatest (2025): $2,077 · +11.4% YoY. Source: county tax records.
Cash-flow waterfall
monthlySold comps — $/sqft
last 12 mo · ≤1 miLoading sold comps…