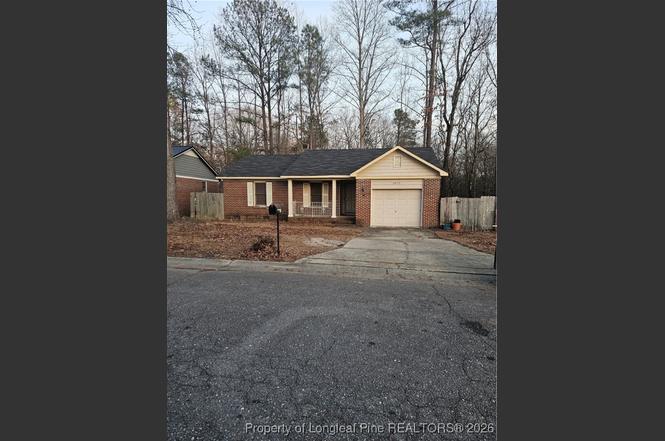
2670 Rivercliff Rd · Fayetteville, NC
Flood risk 1/10 · Minimal
- FEMA flood zone
- X (shaded)
- Chance of flooding over 30 yrs
- 0.0%
- Est. flood insurance / yr
- $507 – $1,088
Fire risk 4/10 · Minor
- Est. fire insurance / yr
- $906 – $1,684
Heat risk 7/10 · Major
- Hot days now (above 106°F)
- 7 days/yr
- Hot days in 30 yrs
- 16 days/yr
Wind risk 6/10 · Moderate
- Chance of severe wind over 30 yrs
- 73.0%
Air-quality risk 2/10 · Minimal
- Unhealthy air days now
- 0 days/yr
- Unhealthy air days in 30 yrs
- 1 days/yr
Risk factors via First Street. Map © Google.
Why this score? — see what drove the B- grade
The composite is a weighted blend of 9 inputs, each scored 0–100. Each bar is that input's sub-score; the figure is the points it added to the 100-point composite (weight × sub-score).
- Cash flow +25.3/30.0
- ARV discount +15.0/15.0
- DSCR +8.4/10.0
- 1% rule +6.1/10.0
- Livability +3.8/5.0
- Rent growth +3.4/5.0
- Schools +3.1/10.0
- Condition / age +2.5/5.0
- Appreciation +0.0/10.0
$134,000
🖨 Deal sheet 📄 Offer letter ✓ Due diligence
Listing remarks
This home has so much potential, with the right person it can be a gem. Home can be shown by any license real estate person.
Key facts
- Garage
- Built 1992
- Listed 2 days
Neighborhood map
What this means for you Summary
Snapshot
- This is a 3-bed/2.0-bath single-family listed at $134k.
Deal economics
- At list price, monthly cash flow is $306 ($4k/yr) — positive.
- The deal already cash-flows at list — no discount required.
- Meets the 1% rule at list price ($1k rent vs $134k).
- Cap rate 9.0% vs local median 4.9% in Fayetteville — top-decile yield for the area; either an underpriced asset or a hidden risk that comps aren't pricing in. Stress-test before assuming the spread holds.
Location & tenants
- Location reads 75/100 on livability (#45 in NC, #4,031 nationally) — a middle-class / working-renter tenant base. Strengths: commute A+, cost of living A+, housing A+; Watch: crime F, employment D-.
- Cumberland County Schools (urban): math 32% / reading 41% proficiency, ranked #126 of 178 in NC (top 71%) — families likely to look elsewhere, expect single-tenant / working-renter base with shorter leases.
- Zoned schools: Luther Nick Jeralds Middle (math 13% / reading 24%, grade F, #436 of 475 statewide, top 93%, 616 students, 100% FRL); E E Smith High (math 42% / reading 41%, grade F, #381 of 535 statewide, top 72%, 1,004 students, 99% FRL) — zoned schools average 99% FRL vs 55% district-wide (45 pts higher); higher-poverty schools than district average — tighter screening recommended.
- Market conditions: Rents rising (+3.5%/yr); 132 active listings in the ZIP; 23 comparable units currently listed for rent nearby; rentals at typical pace (median 23d on market — plan ~3-4 weeks tenant-placement turnaround); lower-income renter base — watch delinquency; 1,125 units permitted in Cumberland County in 2024 (104 in 5+ unit buildings).
- At $1,488/mo this rent would consume 46% of the median local household income ($39k/yr) (locally 1389% of renters already pay >50% of income on rent) — very limited rent-growth headroom before tenants either downsize or default.
Forward outlook
- Local home prices are declining (-3.0%/yr); year-one equity from $926 of loan paydown is wiped out by about $4k of value loss. Plan a longer hold.
Negotiation context
- Only 2 days on market — expect competitive offers; lowballing is unlikely to land.
- Current owner paid $78k; list at $134k implies a 72% gain — meaningful room to come down on a strong offer.
Risks & watch-outs
- Climate carrying-cost: major wind risk, 73% chance of damaging wind over 30y; extreme-heat days projected 7→16/yr by 2055 (HVAC capex compounding) — expect insurance premiums to compound above CPI over the hold.
Questions for the listing agent
- Is there a deadline driving the sale (1031 exchange, divorce, estate, relocation)? That informs how much negotiation room exists.
- Crime grade is F in this area — have there been break-ins, vandalism, or insurance claims at this property in the last 3 years? What carrier currently insures it and at what premium?
- What's the average days-on-market for RENTAL listings here right now (not sales)? A rising rental-DOM trend means longer vacancies and softer asking-rent achievability than the comps imply.
- What's the recent tenant-quality profile in this submarket — average credit score on applications, eviction rate, late-payment / NSF rate, and stable-employment percentage? A property-management company in the area should have these aggregated.
- How much new for-sale + rental construction is in the pipeline within 1–3 miles? Heavy new supply typically softens prices + rents 12–24 months out; constrained supply supports both.
Investment metrics
- 1% rule
- 1.11% ✓
- Cap rate
- 9.03%
- Cash-on-cash
- 9.79%
- DSCR
- 1.44
- GRM
- 7.5
CMA / ARV
- ARV (on-the-fly)
- $181,419
- Comps found
- 12
Show comp detail 12 sales within ~0.75 mi
| Address | Dist | Beds/Ba | Sqft | Sold | Price | $/sf | Match |
|---|---|---|---|---|---|---|---|
| 2846 Copenhagen Dr | 0.30mi | 3/2.0 | 1,122 (+1%) | 2mo | $140,000 | $125 | 83 |
| 532 Crooked Creek Ct | 0.10mi | 3/2.0 | 1,188 (+7%) | 3mo | $203,000 | $171 | 82 |
| 2838 Copenhagen Dr | 0.29mi | 3/2.0 | 1,114 (+0%) | 6mo | $183,000 | $164 | 81 |
| 504 Stone Way Ct | 0.08mi | 3/2.0 | 1,201 (+8%) | 5mo | $168,000 | $140 | 78 |
| 520 Stone Way Ct | 0.06mi | 3/2.0 | 1,247 (+12%) | 3mo | $180,000 | $144 | 75 |
| 508 Stoneway Ct | 0.07mi | 3/2.0 | 1,261 (+13%) | 1mo | $199,500 | $158 | 73 |
| 400 Abbottswood Dr | 0.55mi | 3/2.0 | 1,121 (+1%) | 4mo | $190,000 | $169 | 70 |
| 3308 Melba Dr | 0.69mi | 3/2.0 | 1,127 (+1%) | 2mo | $191,000 | $169 | 64 |
| 128 W Circle Ct | 0.52mi | 3/1.0 | 995 (-11%) | 3mo | $165,000 | $166 | 52 |
| 1917 Dogwood St | 0.72mi | 3/1.0 | 1,050 (-6%) | 2mo | $85,000 | $81 | 51 |
| 124 W Circle Ct | 0.52mi | 2/1.0 (-1) | 1,016 (-9%) | 2mo | $45,000 | $44 | 51 |
| 1920 Dogwood St | 0.70mi | 3/2.0 | 1,230 (+10%) | 3mo | $199,900 | $163 | 48 |
Match score weights: distance 35% · size 25% · config 20% · recency 20%. Top-matched comps best support the ARV.
Projected returns pro-forma
-3.0% appreciation · 3.49% rent growth · sell at horizon
- IRR
- -1.0%
- Equity multiple
- 0.96×
- Total profit
- $-1,488
- Equity at exit
- $19,980
- IRR
- 9.1%
- Equity multiple
- 1.71×
- Total profit
- $26,820
- Equity at exit
- $11,586
Cash invested: $37,520 (down + closing). Projections, not guarantees.
Landlord ↔ Tenant lean methodology
- Overall (STATE)
- 85 Strongly Landlord-Friendly
- State North Carolina
- 85 Strongly Landlord-Friendly · R+3
- County
- — inherits STATE
- City
- — inherits STATE
ZIP-level market 28301
- Home prices YoY
- -12.5%
- Rents YoY
- 3.5%
- Active inventory
- 132
- Price-to-rent
- 7.5×
Monthly cashflow live
- Estimated rent
- $1,488 high interval (Pro) →
- Mortgage (P&I)
- −$703
- Tax from tax record
- −$111 /mo · $1,329/yr
- Insurance
- −$56
- HOA
- −$0
- Vacancy / Maint / Mgmt
- −$312
- Net cashflow
- $306
Break-even live
UW: 25.0% down · 7.5% · 30yr · 1.5% tax · 5.0% vac · 8.0% maint · 8.0% mgmt
Financing live
Cash to close
- Down payment
- $33,500
- Closing costs
- $4,020
- Reserves months
- —
- Total cash needed
- —
Loan-product check · same deal, 3 products live
Conventional
25% down · 7.5% · 30yr
- Down + closing
- —
- Monthly P&I
- —
- Monthly cashflow
- —
- DSCR
- —
- Eligible?
- —
Personal DTI + credit; lowest rate.
DSCR
20% down · 8.5% · 30yr
- Down + closing
- —
- Monthly P&I
- —
- Monthly cashflow
- —
- DSCR
- —
- Eligible?
- —
No personal income docs; deal must DSCR.
Hard money
10% down · 12.0% · 12mo
- Down + closing
- —
- Monthly P&I
- —
- Monthly cashflow
- —
- DSCR
- —
- Eligible?
- —
Short-term bridge; refi at stabilization.
Rent comps 23 comps
| Address | Beds | Baths | Sqft | Rent | $/sqft | DOM | Units | Dist |
|---|---|---|---|---|---|---|---|---|
| 2678 Rivercliff Rd Fayetteville, NC | 3.0 | 2.0 | 1260 | $1,500 | $1.19 | 23d | 1 | 0.02mi |
| 508 Stone Way Ct Fayetteville, NC | 3.0 | 2.0 | 1261 | $1,900 | $1.51 | 23d | 1 | 0.07mi |
| 539 Crooked Creek Ct Fayetteville, NC | 3.0 | 2.0 | 1258 | $1,395 | $1.11 | 23d | 1 | 0.13mi |
| 2846 Copenhagen Dr Fayetteville, NC | 3.0 | 2.0 | 1100 | $1,600 | $1.45 | 23d | 1 | 0.29mi |
| 2737 Kentberry Ave Fayetteville, NC | 2.0–3.0 | 2.0 | 1209 | $1,400 | $1.16 | 13d | 5 | 0.37mi |
| 216 Brainerd Ave Fayetteville, NC | 2.0 | 1.0 | 818 | $1,150 | $1.41 | 23d | 1 | 0.40mi |
| 118 Circle Ct Fayetteville, NC | 3.0 | 2.0 | 1496 | $1,550 | $1.04 | 13d | 1 | 0.52mi |
| 398 Bainbridge Ct Fayetteville, NC | 3.0 | 2.0 | 900 | $990 | $1.10 | 13d | 1 | 0.72mi |
| 398 Bainbridge Ct Fayetteville, NC | 3.0 | 2.0 | 900 | $990 | $1.10 | 23d | 1 | 0.72mi |
| 2015 Blake St Fayetteville, NC | 2.0 | 1.0 | 700 | $995 | $1.42 | 23d | 1 | 0.74mi |
| 110 Facility Dr #2015 Fayetteville, NC | 2.0 | 1.0 | 700 | $995 | $1.42 | 23d | 1 | 0.74mi |
| 1847 Blake St Fayetteville, NC | 3.0 | 2.0 | 900 | $990 | $1.10 | 23d | 1 | 0.88mi |
| 1847 Blake St Fayetteville, NC | 3.0 | 2.0 | 900 | $990 | $1.10 | 13d | 1 | 0.88mi |
| 1606 Gibson St Fayetteville, NC | 3.0 | 1.5 | 1014 | $1,000 | $0.99 | 23d | 1 | 0.90mi |
| 2061 Osceola Dr Fayetteville, NC | 3.0 | 1.0 | 928 | $1,300 | $1.40 | 23d | 1 | 0.91mi |
| 302 Brookwood Ave Fayetteville, NC | 2.0 | 1.0 | 979 | $1,250 | $1.28 | 13d | 1 | 0.98mi |
| 1608 Fayette Ave Fayetteville, NC | 2.0 | 1.0 | 900 | $875 | $0.97 | 23d | 1 | 1.06mi |
| 1608 Fayette Ave Fayetteville, NC | 2.0 | 1.0 | 900 | $875 | $0.97 | 13d | 1 | 1.06mi |
| 122 Kensington Cir Fayetteville, NC | 3.0 | 1.0 | 856 | $1,250 | $1.46 | 23d | 1 | 1.14mi |
| 112 Quincy St Fayetteville, NC | 3.0 | 1.0 | 1080 | $1,320 | $1.22 | 13d | 1 | 1.21mi |
| 113 Mullins Ave Fayetteville, NC | 2.0 | 1.0 | 1000 | $1,025 | $1.02 | 23d | 1 | 1.26mi |
| 302 Law Rd Fayetteville, NC | 2.0 | 1.5 | 940 | $999 | $1.06 | 13d | 1 | 1.34mi |
| 307 Hawthorne Rd Fayetteville, NC | 3.0 | 1.0 | 886 | $1,125 | $1.27 | 13d | 1 | 1.48mi |
Listing history 4 events
-
2026-02-11soldstatus $78,000
-
2026-01-15status Pending
-
2026-01-12$134,000 Active
-
1997-05-22soldstatus $73,500
ⓘ Source: listings_history table (triggers on properties + properties_extension) + one-shot
backfill from property_details.listing_events for pre-trigger history.
Tax reassessment forecast NC · Resets to sale price
- Current annual tax
- $1,329 · $111/mo
- Projected year-2 tax
- $1,329 · $111/mo
- Expected delta
- $0/yr ($0/mo · 0.0%)
ⓘ Screening estimate from a state-policy table — verify with the county assessor before closing.
Climate risk First Street
- Flood 1/10 Low FEMA zone X (shaded) · 0% chance over 30 yrs
- Wildfire 4/10 Moderate
- Heat 7/10 Severe 7 d/yr ≥106°F today · 16 d/yr by 30 yrs out
- Wind 6/10 Major 73% chance of damaging wind over 30 yrs
- Air quality 2/10 Low 0 unhealthy d/yr today · 1 by 30 yrs out
Nearby sold comps map
Loading sold comps map…
Walkable amenities ~0.75 mi
Loading nearby amenities…
Taxation est. · year 1
- Rental income
- $17,855
- − Mortgage interest
- −$7,506
- − Property taxes
- −$1,329
- − Insurance
- −$670
- − Repairs & maintenance
- −$1,428
- − Management
- −$1,428
- − Depreciation
- −$3,898
- Taxable income
- $1,595
- Est. tax owed @ 24.0%
- −$383
- After-tax cash flow
- $3,291/yr
For passive investors: Depreciation is non-cash, so a rental often shows a tax loss while cash-flowing — sheltering income. Rental losses are passive: they offset passive income freely, and up to $25,000/yr can offset ordinary (W-2) income if you actively participate and your MAGI is under $100k (phasing out to $0 by $150k); unused losses carry forward. On sale, claimed depreciation is recaptured at up to 25%, and gains may owe capital-gains tax (a 1031 exchange can defer both). Figures are a year-1 estimate at your 24.0% rate — not tax advice; consult a CPA.
Schools (NCES district)
- District
- Cumberland County Schools
- NCES district ID
- 3700011
- Math proficiency
- 32% ▼ -2.00%
- Reading proficiency
- 41% ▼ -1.00%
- Median HH income
- $44,168
- Composite
- 31.0/100
- National rank
- #6096
- State rank
- #126 of 178 in NC
Livability — Fayetteville
- Score
- 75/100
- State rank
- #45
- US rank
- #4031
Category grades
Schools grade is shown separately in the Schools card above.
Census & demographics
- Census place
- Fayetteville, NC
- County
- Cumberland County · 265,314 people
- City population
- 226,118
- Metro
- Fayetteville, NC
- Population (ZIP)
- 16,798
- Household income
- $39,198
- Rent vs Own
- Severe rent burden
- 1389.0
Population outlook (Cumberland County) Hauer SSP2
- Today (2025)
- 330,855 people
- By 2030
- 333,523 · +0.8%
- By 2040
- 335,583 · +1.4%
- By 2050
- 335,325 · +1.4%
- By 2075
- 342,853 · +3.6%
- By 2100
- 340,698 · +3.0%
Race, ethnicity, and origin ACS 2023
- Neighborhood character
- Predominantly Black (68%)
- Race & ethnicity
- Black 68% White 19% Two or more races 6% Hispanic / Latino 5%
- Common ancestry
- Serbian 1% Slovak 1% Romanian 1%
- Foreign-born
- 3% · Canada
- Languages at home
- 95% English-only · Spanish 3% French/Haitian/Cajun 1%
Political lean MEDSL · Cumberland
- 2024 margin
- D (+13.4) · D 56.1% · R 42.7% · Other 1.2%
- 2008→2024 swing
- -4.3pp toward R · 2008: 17.7pp · 2024: 13.4pp
- All cycles
- 2024: D+13.4 2020: D+16.6 2016: D+16.0 2012: D+19.7 2008: D+17.7
Not yet ingested
- Civics
- —
Market trends
- HPI YoY
- ▼ -37.92%
- Current HPI
- 265.98
- Rent YoY
- ▲ 3.49%
- Metro
- Fayetteville, NC
- State GDP YoY
- ▲ 3.28%
- F500 in state
- 26
Industry mix (Fortune 500 HQ in NC)
| Industry | F500 HQs | Revenue |
|---|---|---|
| Financial Services | 2 | $213B |
|
||
| Retail | 2 | $95B |
|
||
| Industrial Conglomerate | 1 | $38B |
|
||
| Metals / Steel | 1 | $35B |
|
||
| Utilities | 1 | $30B |
|
||
| Industrial Machinery | 1 | $19B |
|
||
Price history
+6.1% since first listed4 events — show timeline
- 2026-02-11 Sold (Public Records) $78,000 Public Records
- 2026-01-15 Pending — LPRMLS
- 2026-01-12 Listed $134,000 LPRMLS
- 1997-05-22 Sold (Public Records) $73,500 Public Records
Property tax history
-0.2%/yrLatest (2025): $1,329 · -17.4% YoY. Source: county tax records.
Cash-flow waterfall
monthlySold comps — $/sqft
last 12 mo · ≤1 miLoading sold comps…