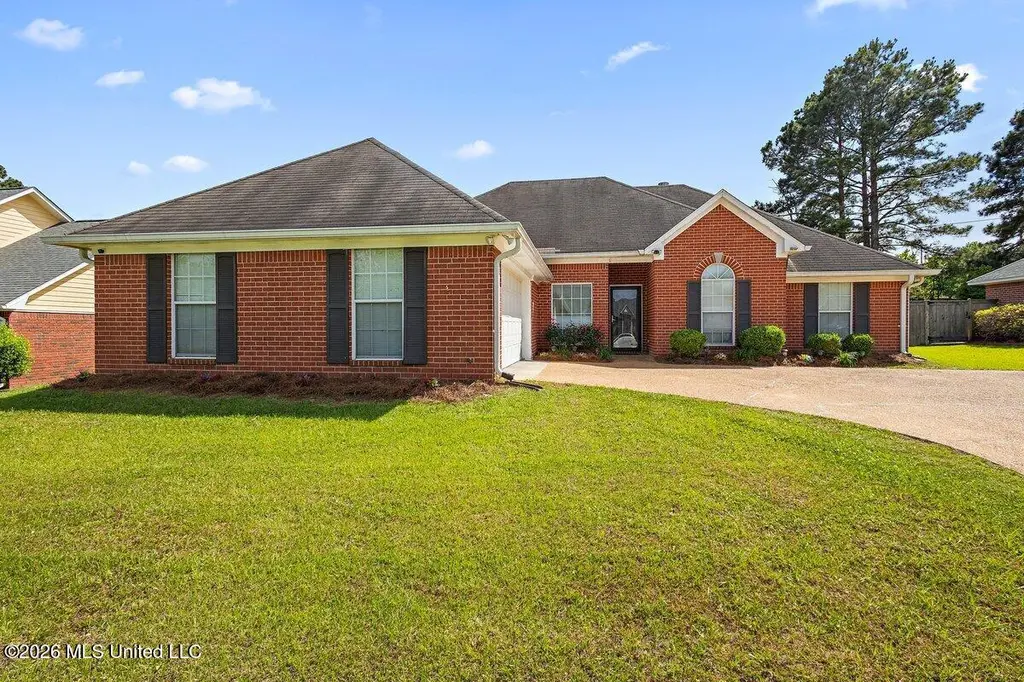
135 Stratford Dr · Madison, MS
Flood risk 1/10 · Minimal
- FEMA flood zone
- X (unshaded)
- Chance of flooding over 30 yrs
- 0.0%
- Est. flood insurance / yr
- $507 – $1,088
Fire risk 3/10 · Minor
- Est. fire insurance / yr
- $1,241 – $2,305
Heat risk 7/10 · Major
- Hot days now (above 108°F)
- 7 days/yr
- Hot days in 30 yrs
- 20 days/yr
Wind risk 7/10 · Major
- Chance of severe wind over 30 yrs
- 78.0%
Air-quality risk 2/10 · Minimal
- Unhealthy air days now
- 0 days/yr
- Unhealthy air days in 30 yrs
- 1 days/yr
Risk factors via First Street. Map © Google.
Why this score? — see what drove the C- grade
The composite is a weighted blend of 9 inputs, each scored 0–100. Each bar is that input's sub-score; the figure is the points it added to the 100-point composite (weight × sub-score).
- Cash flow +18.7/30.0
- ARV discount +7.0/15.0
- DSCR +5.9/10.0
- Schools +4.8/10.0
- Livability +4.0/5.0
- 1% rule +3.9/10.0
- Rent growth +3.2/5.0
- Condition / age +2.5/5.0
- Appreciation +0.0/10.0
$310,000
🖨 Deal sheet 📄 Offer letter ✓ Due diligence
Listing remarks
Location, Location, Location! This beautiful 4-bedroom, 2-bath home offers the perfect blend of comfort and convenience in the highly sought -after Madison School District. Featuring no carpet throughout, you'll love the clean look of hardwood and tile flooring in every room. Enjoy a spacious family room with a stunning stone fireplace, perfect for relaxing or entertaining. The open layout flows into a generous dining area, creating an ideal space for gatherings. The home is filled with bright, airy colors that give it a fresh, welcoming feel. The primary suite is a true retreat with a trey ceiling and plenty of space to unwind. Additional features include a 2-car garage and a prime locatio
Key facts
- Primary suite
- Open layout
- Stone fireplace
Tags
Property features AI
Finance
- HOA & community: Homeowners association with grounds maintenance and pool service; Community clubhouse; Community pool
Exterior
- Parking: 2-car garage; Garage door opener; Concrete driveway
- Security: Security system; Smoke detector(s)
- Utilities: Public water; Public sewer; Natural gas available (including in kitchen)
- Home design: Single-family residence (house); One story; Move-in ready; Slab foundation; Brick construction
- Construction: Brick construction; Slab foundation; Shingle roof
- Exterior features: Wood fencing; Fenced lot; Shingle roof
Interior
- Kitchen: Dishwasher; Disposal; Oven; Exhaust fan; Gas water heater
- Flooring: Ceramic tile; Linoleum; Tile; Wood
- Bathrooms: Two full bathrooms
- Heating & cooling: Central heating (natural gas); Central air; Ceiling fan(s)
- Interior features: Double vanity; Eat-in kitchen; High ceilings; Soaking tub; Walk-in closet(s); Insulated windows; Dead bolt locks; Gas-started fireplace in living room
- Laundry & utility: Gas dryer hookup
Neighborhood map
What this means for you Summary
Snapshot
- This is a 4-bed/4.0-bath single-family listed at $310k.
Deal economics
- At list price, monthly cash flow is $307 ($4k/yr) — positive.
- The deal already cash-flows at list — no discount required.
- To meet the 1% rule (rent ≥ 1% of price), the offer needs to be $277k (10.5% below list).
- Recommended offer: $277k (10.5% below list) — sets the bar for 1% rule.
- Cap rate 7.5% vs local median 3.7% in Madison — top-decile yield for the area; either an underpriced asset or a hidden risk that comps aren't pricing in. Stress-test before assuming the spread holds.
Location & tenants
- Location reads 81/100 on livability (#4 in MS, #1,556 nationally) — a professional / high-income tenant draw. Strengths: crime A+, employment A+, housing A+; Watch: amenities D-, commute F.
- Madison County School District (rural): math 54% / reading 54% proficiency, ranked #3 of 130 in MS (top 2%) — acceptable for families but not a draw, mixed tenant base, ~2y average lease.
- Zoned schools: Madison Station Elementary School (math 76% / reading 75%, grade A, #4 of 375 statewide, top 1%, 1,035 students, 100% FRL); Madison Middle School (math 66% / reading 57%, grade B+, #6 of 179 statewide, top 3%, 1,154 students, 100% FRL); Madison Central High School (math 5% / reading 63%, grade F, #78 of 197 statewide, top 39%, 1,246 students, 100% FRL) — zoned schools average 100% FRL vs 29% district-wide (70 pts higher); higher-poverty schools than district average — tighter screening recommended.
- Market conditions: Rents rising (+2.6%/yr); 628 active listings in the ZIP; high-income renter base; 553 units permitted in Madison County in 2024 (0 in 5+ unit buildings).
Forward outlook
- Local home prices are declining (-3.0%/yr); year-one equity from $2k of loan paydown is wiped out by about $9k of value loss. Plan a longer hold.
- Madison County population projected at +34% by 2050 — long-run rental-demand tailwind backs the buy-and-hold thesis.
Negotiation context
- It's been on market 56 days — a 3% lower offer ($301k) is reasonable based on typical stale-listing flexibility.
- 5 sale attempts since 19y ago with the ask held roughly flat each time — persistent listings suggest the price (not the market) is what's stuck; bring a comps-based counter.
Risks & watch-outs
- Climate carrying-cost: major wind risk, 78% chance of damaging wind over 30y; extreme-heat days projected 7→20/yr by 2055 (HVAC capex compounding) — expect insurance premiums to compound above CPI over the hold.
Questions for the listing agent
- It's been on market 56 days. Have you received any prior offers? Is the seller open to a 11% concession, seller financing, or rate buy-down credit?
- Is there a deadline driving the sale (1031 exchange, divorce, estate, relocation)? That informs how much negotiation room exists.
- Schools are A-rated — typically a magnet for longer-tenancy family renters. What's the average tenant stay here, and is there a school-zone premium baked into asking?
- What's the average days-on-market for RENTAL listings here right now (not sales)? A rising rental-DOM trend means longer vacancies and softer asking-rent achievability than the comps imply.
- What's the recent tenant-quality profile in this submarket — average credit score on applications, eviction rate, late-payment / NSF rate, and stable-employment percentage? A property-management company in the area should have these aggregated.
- How much new for-sale + rental construction is in the pipeline within 1–3 miles? Heavy new supply typically softens prices + rents 12–24 months out; constrained supply supports both.
Investment metrics
- 1% rule
- 0.89% ✗
- Cap rate
- 7.48%
- Cash-on-cash
- 4.24%
- DSCR
- 1.19
- GRM
- 9.3
CMA / ARV
- ARV (median comp)
- $306,496
- List price
- $310,000
- Delta
- 1.14%
- Verdict
- FAIR
- Comps
- 20 within 1.0 mi
Show comp detail 5 sales within ~0.75 mi
| Address | Dist | Beds/Ba | Sqft | Sold | Price | $/sf | Match |
|---|---|---|---|---|---|---|---|
| 302 Chatfield Cv | 0.05mi | 3/2.0 (-1) | 1,729 (+1%) | 3mo | $260,000 | $150 | 80 |
| 151 Stratford Dr | 0.13mi | 4/2.0 | 1,950 (+14%) | 1mo | $312,500 | $160 | 61 |
| 433 Fairfield Dr | 0.15mi | 4/2.5 | 1,937 (+14%) | 17mo | $297,500 | $154 | 50 |
| 105 Concord Pl | 0.47mi | 3/2.0 (-1) | 1,845 (+8%) | 6mo | $294,900 | $160 | 46 |
| 102 Fairfield Cir | 0.30mi | 3/2.0 (-1) | 1,889 (+11%) | 23mo | $285,000 | $151 | 36 |
Match score weights: distance 35% · size 25% · config 20% · recency 20%. Top-matched comps best support the ARV.
Projected returns pro-forma
-3.0% appreciation · 2.61% rent growth · sell at horizon
- IRR
- -10.1%
- Equity multiple
- 0.63×
- Total profit
- $-31,906
- Equity at exit
- $46,222
- IRR
- -1.3%
- Equity multiple
- 0.91×
- Total profit
- $-7,525
- Equity at exit
- $26,803
Cash invested: $86,800 (down + closing). Projections, not guarantees.
Landlord ↔ Tenant lean methodology
- Overall (STATE)
- 90 Strongly Landlord-Friendly
- State Mississippi
- 90 Strongly Landlord-Friendly · R+11
- County
- — inherits STATE
- City
- — inherits STATE
ZIP-level market 39110
- Home prices YoY
- -28.3%
- Rents YoY
- 2.6%
- Active inventory
- 628
- Price-to-rent
- 9.3×
Monthly cashflow live
- Estimated rent
- $2,773 medium interval (Pro) →
- Mortgage (P&I)
- −$1,626
- Tax from tax record
- −$129 /mo · $1,552/yr
- Insurance
- −$129
- HOA
- −$0
- Vacancy / Maint / Mgmt
- −$582
- Net cashflow
- $307
Break-even live
UW: 25.0% down · 7.5% · 30yr · 1.5% tax · 5.0% vac · 8.0% maint · 8.0% mgmt
Financing live
Cash to close
- Down payment
- $77,500
- Closing costs
- $9,300
- Reserves months
- —
- Total cash needed
- —
Loan-product check · same deal, 3 products live
Conventional
25% down · 7.5% · 30yr
- Down + closing
- —
- Monthly P&I
- —
- Monthly cashflow
- —
- DSCR
- —
- Eligible?
- —
Personal DTI + credit; lowest rate.
DSCR
20% down · 8.5% · 30yr
- Down + closing
- —
- Monthly P&I
- —
- Monthly cashflow
- —
- DSCR
- —
- Eligible?
- —
No personal income docs; deal must DSCR.
Hard money
10% down · 12.0% · 12mo
- Down + closing
- —
- Monthly P&I
- —
- Monthly cashflow
- —
- DSCR
- —
- Eligible?
- —
Short-term bridge; refi at stabilization.
Listing history 29 events
-
2026-06-18days on market $310,000 Active 56 DOM
-
2026-06-17days on market $310,000 Active 55 DOM
-
2026-06-16days on market $310,000 Active 54 DOM
-
2026-06-15days on market $310,000 Active 53 DOM
-
2026-06-14days on market $310,000 Active 51 DOM
-
2026-06-10days on market $310,000 Active 48 DOM
-
2026-06-09days on market $310,000 Active 47 DOM
-
2026-06-09price $310,000 Active 46 DOM
-
2026-06-08days on market $320,000 Active 46 DOM
-
2026-06-07days on market $320,000 Active 45 DOM
-
2026-06-03days on market $320,000 Active 41 DOM
-
2026-06-02days on market $320,000 Active 40 DOM
-
2026-06-01days on market $320,000 Active 39 DOM
-
2026-05-31days on market $320,000 Active 38 DOM
-
2026-05-30days on market $320,000 Active 37 DOM
-
2026-05-14price $329,000 778-char remark
-
2026-05-07price $339,000 778-char remark
-
2026-04-23price $344,000 778-char remark
-
2026-04-23$305,000 Active 778-char remark
-
2021-10-08historical
-
2021-10-08historical
-
2008-06-27soldstatus
-
2008-05-07soldstatus
-
2008-03-18historical
-
2008-03-18$179,900
-
2008-02-22$189,900
-
2007-11-26$192,000
-
2007-06-23$192,000
-
1998-08-11soldstatus
ⓘ Source: listings_history table (triggers on properties + properties_extension) + one-shot
backfill from property_details.listing_events for pre-trigger history.
Tax reassessment forecast MS · Resets to sale price
- Current annual tax
- $1,552 · $129/mo
- Projected year-2 tax
- $2,449 · $204/mo
- Expected delta
- +$897/yr (+$75/mo · 57.8%)
ⓘ Screening estimate from a state-policy table — verify with the county assessor before closing.
Climate risk First Street
- Flood 1/10 Low FEMA zone X (unshaded) · 0% chance over 30 yrs
- Wildfire 3/10 Moderate
- Heat 7/10 Severe 7 d/yr ≥108°F today · 20 d/yr by 30 yrs out
- Wind 7/10 Severe 78% chance of damaging wind over 30 yrs
- Air quality 2/10 Low 0 unhealthy d/yr today · 1 by 30 yrs out
Nearby sold comps map
Loading sold comps map…
Walkable amenities ~0.75 mi
Loading nearby amenities…
Taxation est. · year 1
- Rental income
- $33,278
- − Mortgage interest
- −$17,365
- − Property taxes
- −$1,552
- − Insurance
- −$1,550
- − Repairs & maintenance
- −$2,662
- − Management
- −$2,662
- − Depreciation
- −$9,018
- Taxable loss
- −$1,532
- Est. tax savings @ 24.0%
- +$368
- After-tax cash flow
- $4,047/yr
For passive investors: Depreciation is non-cash, so a rental often shows a tax loss while cash-flowing — sheltering income. Rental losses are passive: they offset passive income freely, and up to $25,000/yr can offset ordinary (W-2) income if you actively participate and your MAGI is under $100k (phasing out to $0 by $150k); unused losses carry forward. On sale, claimed depreciation is recaptured at up to 25%, and gains may owe capital-gains tax (a 1031 exchange can defer both). Figures are a year-1 estimate at your 24.0% rate — not tax advice; consult a CPA.
Schools (NCES district)
- District
- Madison County School District
- NCES district ID
- 2802790
- Math proficiency
- 54% ▼ -7.00%
- Reading proficiency
- 54% ▼ -7.00%
- Median HH income
- $70,579
- Composite
- 48.08/100
- National rank
- #2188
- State rank
- #3 of 130 in MS
Livability — Madison
- Score
- 81/100
- State rank
- #4
- US rank
- #1556
Category grades
Schools grade is shown separately in the Schools card above.
Census & demographics
- Census place
- Madison, MS
- County
- Madison County · 75,005 people
- City population
- 50,443
- Metro
- Jackson, MS
- Population (ZIP)
- 50,443
- Household income
- $125,506
- Rent vs Own
- Severe rent burden
- 227.0
Population outlook (Madison County) Hauer SSP2
- Today (2025)
- 122,509 people
- By 2030
- 131,737 · +7.5%
- By 2040
- 148,930 · +21.6%
- By 2050
- 164,300 · +34.1%
- By 2075
- 197,495 · +61.2%
- By 2100
- 211,429 · +72.6%
Race, ethnicity, and origin ACS 2023
- Neighborhood character
- Predominantly White (76%)
- Race & ethnicity
- White 76% Black 15% Asian 4% Two or more races 3% Hispanic / Latino 2%
- Common ancestry
- Italian 6% Slovak 3% Lithuanian 3%
- Foreign-born
- 5% · China, Canada
- Languages at home
- 92% English-only · Spanish 2% Other Indo-European 2% Chinese 1%
Political lean MEDSL · Madison
- 2024 margin
- R (+17.3) · D 40.8% · R 58.0% · Other 1.2%
- 2008→2024 swing
- -1.7pp toward R · 2008: -15.6pp · 2024: -17.3pp
- All cycles
- 2024: R+17.3 2020: R+11.8 2016: R+16.1 2012: R+15.7 2008: R+15.6
Not yet ingested
- Civics
- —
Market trends
- HPI YoY
- ▼ -60.99%
- Current HPI
- 154.6909
- Rent YoY
- ▲ 2.61%
- Metro
- Jackson, MS
- State GDP YoY
- —
- F500 in state
- 0
Price history
+61.5% since first listed16 events — show timeline
- 2026-06-08 Price Changed $310,000 MLSU
- 2026-05-26 Price Changed $320,000 MLSU
- 2026-05-14 Price Changed $329,000 MLSU
- 2026-05-07 Price Changed $339,000 MLSU
- 2026-04-23 Price Changed $344,000 MLSU
- 2026-04-23 Listed $305,000 MLSU
- 2021-10-08 Listing Removed — MLSU
- 2021-10-08 Listing Removed — MLSU
- 2008-06-27 Sold (Public Records) — Public Records
- 2008-05-07 Sold (MLS) — MLSU
- 2008-03-18 Listed $179,900 MLSU
- 2008-03-18 Listing Removed — MLSU
- 2008-02-22 Listed $189,900 MLSU
- 2007-11-26 Listed $192,000 MLSU
- 2007-06-23 Listed $192,000 MLSU
- 1998-08-11 Sold (Public Records) — Public Records
Property tax history
-1.0%/yrLatest (2025): $1,552 · +0.0% YoY. Source: county tax records.
Cash-flow waterfall
monthlySold comps — $/sqft
last 12 mo · ≤1 miLoading sold comps…