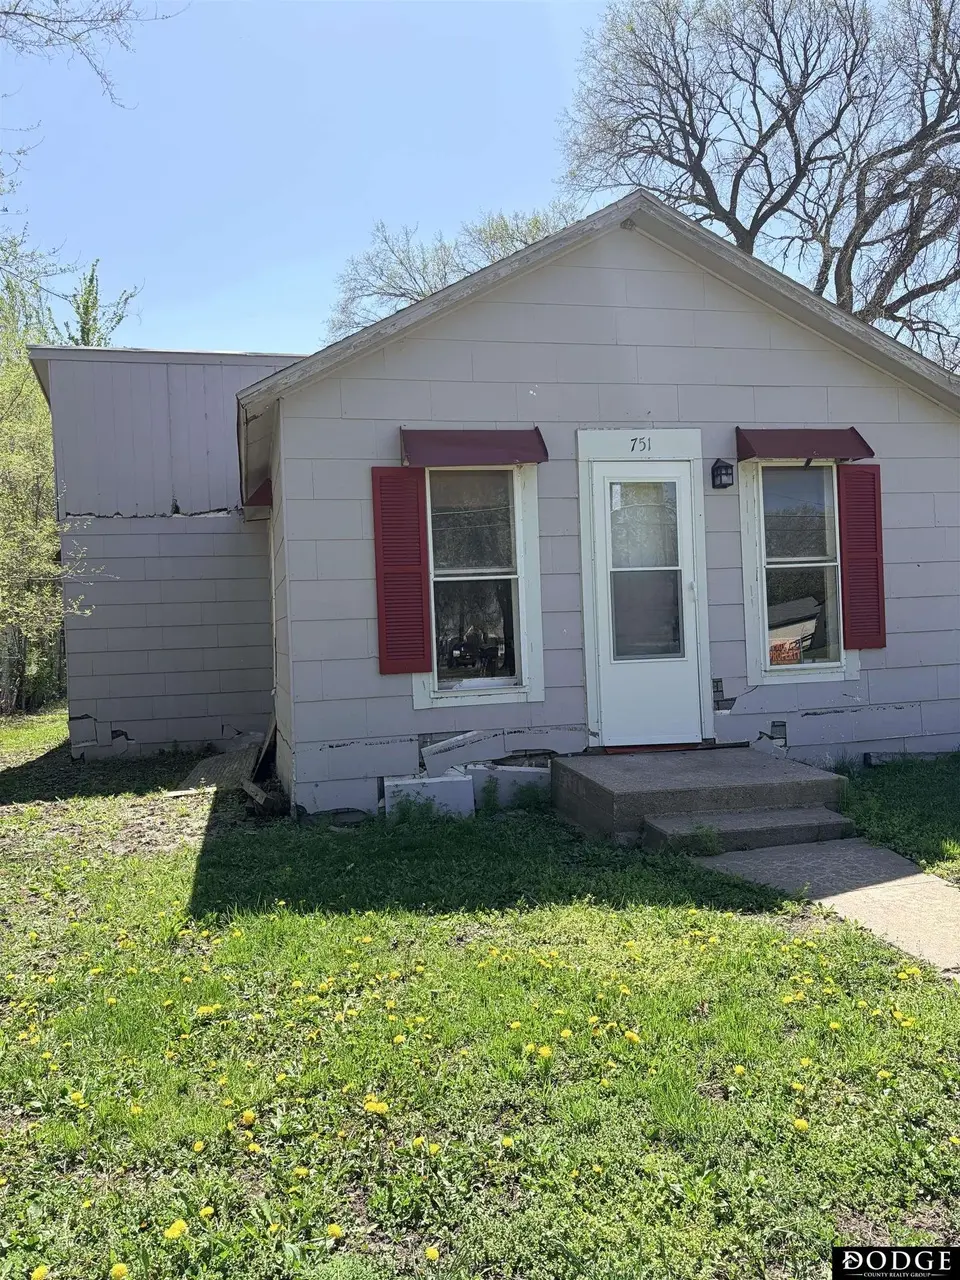
751 W South St · Fremont, NE
Flood risk 5/10 · Moderate
- FEMA flood zone
- AE
- Chance of flooding over 30 yrs
- 0.56%
- Est. flood insurance / yr
- $1,737 – $8,500
Fire risk 3/10 · Minor
- Est. fire insurance / yr
- $1,161 – $2,155
Heat risk 3/10 · Minor
- Hot days now (above 103°F)
- 7 days/yr
- Hot days in 30 yrs
- 16 days/yr
Wind risk 2/10 · Minimal
- Chance of severe wind over 30 yrs
- —
Air-quality risk 1/10 · Minimal
- Unhealthy air days now
- 0 days/yr
- Unhealthy air days in 30 yrs
- 0 days/yr
Risk factors via First Street. Map © Google.
Why this score? — see what drove the B- grade
The composite is a weighted blend of 9 inputs, each scored 0–100. Each bar is that input's sub-score; the figure is the points it added to the 100-point composite (weight × sub-score).
- Cash flow +30.0/30.0
- 1% rule +10.0/10.0
- DSCR +10.0/10.0
- ARV discount +7.5/15.0
- Livability +3.8/5.0
- Schools +3.0/10.0
- Condition / age +2.5/5.0
- Rent growth +2.0/5.0
- Appreciation +0.0/10.0
$45,000
🖨 Deal sheet 📄 Offer letter ✓ Due diligence
Listing remarks MLS
Investor special. 2 bed 1.5 bath w 1 car detached.
Key facts
- 6,534 sq ft lot
- Garage
- Built 1905
Property features AI
Finance
- Other: Building area total listed as 768 (units: square feet)
- Financial info: Tax details available but excluded per instructions
- HOA & community: HOA information not provided
Exterior
- Parking: Detached garage; One covered parking space (total of 1 parking space)
- Security: Security details not provided
- Utilities: Public water; Natural gas heating (see Heating & cooling)
- Home design: Single-family residence; Residential property; Built in 1905; Living area reported as 768 square feet; Not a new home
- Construction: Slab foundation; Construction materials and roof details not provided
- Exterior features: Lot size about 0.15 acre (approximately 46 x 140); Lot described as up to 1/4 acre
Interior
- Kitchen: Main-floor kitchen (approximately 13 x 16)
- Bedrooms: Master bedroom located on the main floor (approximately 7 x 13)
- Flooring: Flooring details not provided
- Bathrooms: One full bathroom on the main floor
- Heating & cooling: Natural gas heat
- Interior features: No fireplaces; Crawl space foundation under the home
- Laundry & utility: Utility details not provided
Neighborhood map
What this means for you Summary
Snapshot
- This is a 2-bed/1.0-bath single-family listed at $45k.
Deal economics
- At list price, monthly cash flow is $89 ($1k/yr) — positive.
- The deal already cash-flows at list — no discount required.
- Meets the 1% rule at list price ($1k rent vs $45k).
- Recommended offer: $44k (3.0% below list) — sets the bar for market timing.
- Cap rate 20.0% vs local median 3.3% in Fremont — top-decile yield for the area; either an underpriced asset or a hidden risk that comps aren't pricing in. Stress-test before assuming the spread holds.
Location & tenants
- Location reads 76/100 on livability (#92 in NE, #3,751 nationally) — a middle-class / working-renter tenant base. Strengths: cost of living A+, housing A+, health & safety A+; Watch: employment D+, commute F.
- Fremont Public Schools (town): math 34% / reading 36% proficiency, ranked #103 of 111 in NE (top 93%) — families likely to look elsewhere, expect single-tenant / working-renter base with shorter leases.
- Zoned schools: Washington Elementary School (math 22% / reading 22%, grade F, #459 of 502 statewide, top 93%, 385 students, 81% FRL); Fremont Middle School (math 38% / reading 40%, grade F, #95 of 128 statewide, top 76%, 744 students, 66% FRL); Fremont Senior High School (math 42% / reading 48%, grade D-, #145 of 261 statewide, top 55%, 1,633 students, 55% FRL) — zoned schools average 67% FRL vs 46% district-wide (21 pts higher); higher-poverty schools than district average — tighter screening recommended.
- Market conditions: Rents soft (-2.1%/yr); 238 active listings in the ZIP; 2 comparable units currently listed for rent nearby; 82 units permitted in Dodge County in 2024 (0 in 5+ unit buildings).
- This rent is only 18% of the median local income ($72k/yr) — well below the 30% rent-burden line; pricing power to push rent on renewal without tenant pushback.
Forward outlook
- Local home prices are declining (-3.0%/yr); year-one equity from $311 of loan paydown is wiped out by about $1k of value loss. Plan a longer hold.
Negotiation context
- It's been on market 35 days — a 3% lower offer ($44k) is reasonable based on typical stale-listing flexibility.
- 3 sale attempts since 19y ago with the ask held roughly flat each time — persistent listings suggest the price (not the market) is what's stuck; bring a comps-based counter.
- Current owner paid $30k; list at $45k implies a 50% gain — meaningful room to come down on a strong offer.
Risks & watch-outs
- Watch-outs: flood insurance adds $427/mo; built in 1905 — expect roof / HVAC / electrical / plumbing capex.
- Climate carrying-cost: in FEMA flood zone AE (mandatory federal flood insurance) — expect insurance premiums to compound above CPI over the hold.
Questions for the listing agent
- It's been on market 35 days. Have you received any prior offers? Is the seller open to a 3% concession, seller financing, or rate buy-down credit?
- Built in 1905 — when were the roof, HVAC, electrical panel, plumbing, and water heater last replaced?
- What's the actual annual flood-insurance premium (NFIP or private), and is the property in a SFHA with mandatory coverage?
- Is there a deadline driving the sale (1031 exchange, divorce, estate, relocation)? That informs how much negotiation room exists.
- What's the average days-on-market for RENTAL listings here right now (not sales)? A rising rental-DOM trend means longer vacancies and softer asking-rent achievability than the comps imply.
- What's the recent tenant-quality profile in this submarket — average credit score on applications, eviction rate, late-payment / NSF rate, and stable-employment percentage? A property-management company in the area should have these aggregated.
- How much new for-sale + rental construction is in the pipeline within 1–3 miles? Heavy new supply typically softens prices + rents 12–24 months out; constrained supply supports both.
Investment metrics
- 1% rule
- 2.34% ✓
- Cap rate
- 20.05%
- Cash-on-cash
- 49.13%
- DSCR
- 3.19
- GRM
- 3.6
CMA / ARV
- ARV (median comp)
- $115,036
- List price
- $45,000
- Delta
- -60.88%
- Verdict
- UNDERPRICED
- Comps
- 20 within 1.0 mi
Show comp detail 11 sales within ~0.75 mi
| Address | Dist | Beds/Ba | Sqft | Sold | Price | $/sf | Match |
|---|---|---|---|---|---|---|---|
| 751 W South St | 0.00mi | 1/1.0 (-1) | 768 (0%) | 0mo | $30,000 | $39 | 95 |
| 725 W Jackson St | 0.13mi | 2/1.0 | 720 (-6%) | 9mo | $113,000 | $157 | 76 |
| 747 Franklin St | 0.23mi | 2/1.0 | 713 (-7%) | 12mo | $109,000 | $153 | 67 |
| 320 North Nye Ave | 0.31mi | 2/1.0 | 783 (+2%) | 19mo | $111,000 | $142 | 66 |
| 309 S L St | 0.09mi | 1/2.0 (-1) | 848 (+10%) | 8mo | $136,000 | $160 | 63 |
| 1302 W South St #8 | 0.39mi | 2/1.0 | 806 (+5%) | 13mo | $265,000 | $329 | 63 |
| 253 S I St | 0.25mi | 2/1.0 | 678 (-12%) | 15mo | $200,000 | $295 | 56 |
| 334 S H St | 0.35mi | 2/1.0 | 721 (-6%) | 23mo | $90,000 | $125 | 54 |
| 548 W 5th St | 0.38mi | 2/2.0 | 816 (+6%) | 20mo | $163,500 | $200 | 51 |
| 825 W 9th St | 0.60mi | 2/1.0 | 864 (+12%) | 1mo | $180,000 | $208 | 51 |
| 749 W 9th St | 0.60mi | 2/1.0 | 871 (+13%) | 14mo | $137,000 | $157 | 38 |
Match score weights: distance 35% · size 25% · config 20% · recency 20%. Top-matched comps best support the ARV.
Projected returns pro-forma
-3.0% appreciation · 0.0% rent growth · sell at horizon
- IRR
- -10.2%
- Equity multiple
- 0.65×
- Total profit
- $-4,412
- Equity at exit
- $6,710
- IRR
- -14.6%
- Equity multiple
- 0.42×
- Total profit
- $-7,312
- Equity at exit
- $3,891
Cash invested: $12,600 (down + closing). Projections, not guarantees.
Landlord ↔ Tenant lean methodology
- Overall (STATE)
- 83 Strongly Landlord-Friendly
- State Nebraska
- 83 Strongly Landlord-Friendly · R+13
- County
- — inherits STATE
- City
- — inherits STATE
ZIP-level market 68025
- Home prices YoY
- -34.1%
- Rents YoY
- -2.1%
- Active inventory
- 238
- Price-to-rent
- 3.6×
Monthly cashflow live
- Estimated rent
- $1,054 medium interval (Pro) →
- Mortgage (P&I)
- −$236
- Tax from tax record
- −$62 /mo · $746/yr
- Insurance
- −$19
- Flood insurance flood zone
- −$427 /mo · $5,118/yr
- HOA
- −$0
- Vacancy / Maint / Mgmt
- −$221
- Net cashflow
- $89
Break-even live
UW: 25.0% down · 7.5% · 30yr · 1.5% tax · 5.0% vac · 8.0% maint · 8.0% mgmt
Financing live
Cash to close
- Down payment
- $11,250
- Closing costs
- $1,350
- Reserves months
- —
- Total cash needed
- —
Loan-product check · same deal, 3 products live
Conventional
25% down · 7.5% · 30yr
- Down + closing
- —
- Monthly P&I
- —
- Monthly cashflow
- —
- DSCR
- —
- Eligible?
- —
Personal DTI + credit; lowest rate.
DSCR
20% down · 8.5% · 30yr
- Down + closing
- —
- Monthly P&I
- —
- Monthly cashflow
- —
- DSCR
- —
- Eligible?
- —
No personal income docs; deal must DSCR.
Hard money
10% down · 12.0% · 12mo
- Down + closing
- —
- Monthly P&I
- —
- Monthly cashflow
- —
- DSCR
- —
- Eligible?
- —
Short-term bridge; refi at stabilization.
Rent comps 2 comps
| Address | Beds | Baths | Sqft | Rent | $/sqft | DOM | Units | Dist |
|---|---|---|---|---|---|---|---|---|
| 447 W Military Ave Apt 5 Fremont, NE | 1.0 | 1.0 | 575 | $800 | $1.39 | 43d | 1 | 0.54mi |
| 505 N Main St Fremont, NE | 1.0 | 1.0 | 557 | $1,145 | $2.05 | 43d | 1 | 0.65mi |
Listing history 12 events
-
2026-05-31status $45,000 Pending 35 DOM
-
2026-05-30days on market $45,000 Active 35 DOM
-
2026-04-25$45,000 New 208-char remark
-
2023-06-23soldstatus $30,000 Sold 50-char remark
Show marketing remark (50 chars)
Investor special. 2 bed 1.5 bath w 1 car detached.
-
2023-06-23soldstatus $35,000
Show marketing remark (50 chars)
Investor special. 2 bed 1.5 bath w 1 car detached.
-
2023-06-21status Pending 50-char remark
Show marketing remark (50 chars)
Investor special. 2 bed 1.5 bath w 1 car detached.
-
2023-06-17$35,000 New 50-char remark
Show marketing remark (50 chars)
Investor special. 2 bed 1.5 bath w 1 car detached.
-
2008-05-15soldstatus $31,000
Show marketing remark (161 chars)
COZY 1 BEDROOM WITH SITTING AREA 9 X 8 COULD BE USED AS NURSERY. UPDATED KITCHEN AND BATH. LARGE PANTRY 11 X 7, PORCH/ENTRY AREA. STORAGE SHED GREAT FOR OVERFLOW
-
2008-05-15soldstatus $31,000
Show marketing remark (161 chars)
COZY 1 BEDROOM WITH SITTING AREA 9 X 8 COULD BE USED AS NURSERY. UPDATED KITCHEN AND BATH. LARGE PANTRY 11 X 7, PORCH/ENTRY AREA. STORAGE SHED GREAT FOR OVERFLOW
-
2008-04-11historical
Show marketing remark (161 chars)
COZY 1 BEDROOM WITH SITTING AREA 9 X 8 COULD BE USED AS NURSERY. UPDATED KITCHEN AND BATH. LARGE PANTRY 11 X 7, PORCH/ENTRY AREA. STORAGE SHED GREAT FOR OVERFLOW
-
2007-06-07$38,900
Show marketing remark (161 chars)
COZY 1 BEDROOM WITH SITTING AREA 9 X 8 COULD BE USED AS NURSERY. UPDATED KITCHEN AND BATH. LARGE PANTRY 11 X 7, PORCH/ENTRY AREA. STORAGE SHED GREAT FOR OVERFLOW
-
2007-03-28soldstatus $15,000
ⓘ Source: listings_history table (triggers on properties + properties_extension) + one-shot
backfill from property_details.listing_events for pre-trigger history.
Tax reassessment forecast NE · Resets to sale price
- Current annual tax
- $746 · $62/mo
- Projected year-2 tax
- $778 · $65/mo
- Expected delta
- +$33/yr (+$3/mo · 4.4%)
ⓘ Screening estimate from a state-policy table — verify with the county assessor before closing.
Climate risk First Street
- Flood 5/10 Major FEMA zone AE · 56% chance over 30 yrs
- Wildfire 3/10 Moderate
- Heat 3/10 Moderate 7 d/yr ≥103°F today · 16 d/yr by 30 yrs out
- Wind 2/10 Low
- Air quality 1/10 Low 0 unhealthy d/yr today · 0 by 30 yrs out
Nearby sold comps map
Loading sold comps map…
Walkable amenities ~0.75 mi
Loading nearby amenities…
Taxation est. · year 1
- Rental income
- $12,649
- − Mortgage interest
- −$2,521
- − Property taxes
- −$746
- − Insurance
- −$5,344
- − Repairs & maintenance
- −$1,012
- − Management
- −$1,012
- − Depreciation
- −$1,309
- Taxable income
- $706
- Est. tax owed @ 24.0%
- −$169
- After-tax cash flow
- $902/yr
For passive investors: Depreciation is non-cash, so a rental often shows a tax loss while cash-flowing — sheltering income. Rental losses are passive: they offset passive income freely, and up to $25,000/yr can offset ordinary (W-2) income if you actively participate and your MAGI is under $100k (phasing out to $0 by $150k); unused losses carry forward. On sale, claimed depreciation is recaptured at up to 25%, and gains may owe capital-gains tax (a 1031 exchange can defer both). Figures are a year-1 estimate at your 24.0% rate — not tax advice; consult a CPA.
Schools (NCES district)
- District
- Fremont Public Schools
- NCES district ID
- 3170710
- Math proficiency
- 34% ▼ -8.00%
- Reading proficiency
- 36% ▲ 1.00%
- Median HH income
- $47,111
- Composite
- 30.07/100
- National rank
- #6347
- State rank
- #103 of 111 in NE
Livability — Fremont
- Score
- 76/100
- State rank
- #92
- US rank
- #3751
Category grades
Schools grade is shown separately in the Schools card above.
Census & demographics
- Census place
- Fremont, NE
- County
- Dodge County · 31,658 people
- City population
- 31,658
- Metro
- Fremont, NE
- Population (ZIP)
- 31,658
- Household income
- $72,254
- Rent vs Own
- Severe rent burden
- 893.0
Population outlook (Dodge County) Hauer SSP2
- Today (2025)
- 37,191 people
- By 2030
- 37,238 · +0.1%
- By 2040
- 37,256 · +0.2%
- By 2050
- 37,494 · +0.8%
- By 2075
- 39,165 · +5.3%
- By 2100
- 40,221 · +8.1%
Race, ethnicity, and origin ACS 2023
- Neighborhood character
- Predominantly White (78%)
- Race & ethnicity
- White 78% Hispanic / Latino 18% Two or more races 7% Native American 2%
- Hispanic origin (detail)
- Mexican 10%
- Common ancestry
- Portuguese 2% Lithuanian 2% Romanian 2%
- Foreign-born
- 7% · Canada
- Languages at home
- 84% English-only · Spanish 14%
Political lean MEDSL · Dodge
- 2024 margin
- Solid R (+32.6) · D 33.0% · R 65.7% · Other 1.3%
- 2008→2024 swing
- -20.6pp toward R · 2008: -12.0pp · 2024: -32.6pp
- All cycles
- 2024: R+32.6 2020: R+32.1 2016: R+35.3 2012: R+22.7 2008: R+12.0
Not yet ingested
- Civics
- —
Market trends
- HPI YoY
- ▼ -164.59%
- Current HPI
- 318.3329
- Rent YoY
- ▼ -2.14%
- Metro
- Fremont, NE
- State GDP YoY
- ▲ 0.68%
- F500 in state
- 2
Industry mix (Fortune 500 HQ in NE)
| Industry | F500 HQs | Revenue |
|---|---|---|
| Conglomerate | 1 | $371B |
|
||
Price history
+100.0% since first listed12 events — show timeline
- 2026-06-10 Sold (MLS) $30,000 GPRMLS
- 2026-05-30 Pending — GPRMLS
- 2026-04-25 Listed $45,000 GPRMLS
- 2023-06-23 Sold (Public Records) $35,000 Public Records
- 2023-06-23 Sold (MLS) $30,000 GPRMLS
- 2023-06-21 Pending — GPRMLS
- 2023-06-17 Listed $35,000 GPRMLS
- 2008-05-15 Sold (Public Records) $31,000 Public Records
- 2008-05-15 Sold (MLS) $31,000 GPRMLS
- 2008-04-11 Listing Removed — GPRMLS
- 2007-06-07 Listed $38,900 GPRMLS
- 2007-03-28 Sold (Public Records) $15,000 Public Records
Property tax history
+4.5%/yrLatest (2025): $746 · +62.2% YoY. Source: county tax records.
Cash-flow waterfall
monthlySold comps — $/sqft
last 12 mo · ≤1 miLoading sold comps…