 Duplex
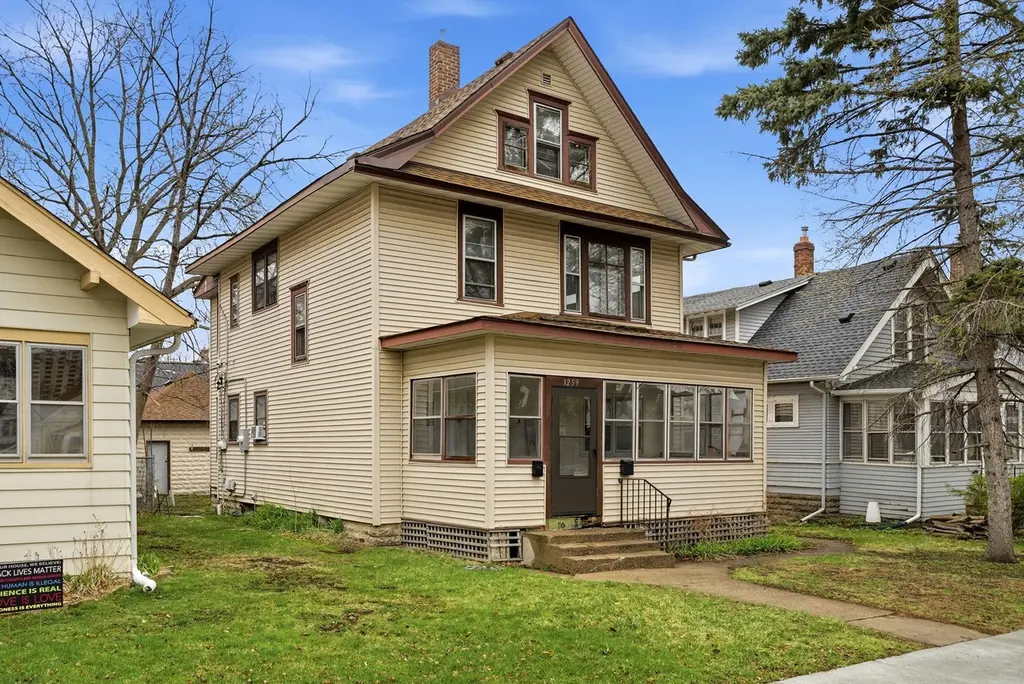
1259 Charles Ave · St. Paul, MN
Flood risk 1/10 · Minimal
- FEMA flood zone
- X (unshaded)
- Chance of flooding over 30 yrs
- 0.0%
- Est. flood insurance / yr
- $473 – $860
Fire risk 1/10 · Minimal
- Est. fire insurance / yr
- $888 – $1,650
Heat risk 2/10 · Minimal
- Hot days now (above 99°F)
- 7 days/yr
- Hot days in 30 yrs
- 14 days/yr
Wind risk 2/10 · Minimal
- Chance of severe wind over 30 yrs
- —
Air-quality risk 2/10 · Minimal
- Unhealthy air days now
- 1 days/yr
- Unhealthy air days in 30 yrs
- 1 days/yr
Risk factors via First Street. Map © Google.
Why this score? — see what drove the D+ grade
The composite is a weighted blend of 9 inputs, each scored 0–100. Each bar is that input's sub-score; the figure is the points it added to the 100-point composite (weight × sub-score).
- Cash flow +19.7/30.0
- ARV discount +7.5/15.0
- DSCR +6.2/10.0
- 1% rule +5.0/10.0
- Rent growth +3.1/5.0
- Livability +2.5/5.0
- Condition / age +2.5/5.0
- Schools +2.4/10.0
- Appreciation +0.0/10.0
$446,500
🖨 Deal sheet 📄 Offer letter ✓ Due diligence
Multi-family units
County records classify this as Multi-Family (2-4 Unit). Listing-text estimate: 2 units. confirmed
Listing remarks
Spacious up-and-down duplex located in a strong St Paul rental neighborhood near shopping, restaurants, and public transportation. Both units feature large multi-level layouts uncommon for traditional duplexes, offering strong long-term tenant appeal and functional living space. The lower unit includes basement and main-level living space, while the upper unit spans the second and third floors. Utilities are currently partially owner-paid, with ownership implementing a RUBS utility reimbursement program across the portfolio beginning Q3 2026. Future ownership will have the opportunity to improve NOI through utility cost recovery and operational efficiencies. Excellent opportunity for invest
Key facts
- 4,922 sq ft lot
- 2 garage spots
- Built 1912
Property features AI
Finance
- Other: Rental license: Standard
- Financial info: Owner currently pays electricity, gas, sewer, trash collection and water; Gross income reported at $33,432; Standard rental license in place; tenants pay electricity and gas
- HOA & community: No association amenities
Exterior
- Parking: 2-car garage (20 x 20, 7' door); Additional gravel parking and parking lot with more onsite parking available for a fee
- Utilities: City water connected; City sewer connected; Electric service with circuit breakers; Fuel: electric and natural gas
- Home design: Residential income property — duplex with up-and-down units; Two levels
- Construction: Block, concrete and frame construction; Asphalt shingle roof (over 8 years old); Block foundation
- Exterior features: Metal and vinyl exterior; Level lot with light tree coverage; Public transit within six blocks; City street with public road maintenance
Interior
- Kitchen: Each unit includes a range and refrigerator; Gas water heaters
- Bedrooms: Total of 5 bedrooms (across units)
- Bathrooms: Two full bathrooms (one in each unit)
- Heating & cooling: Boiler hot water heating; No central cooling in either unit
- Interior features: Full basement with single-tenant access; Accessibility with 36+ inch doors and 42+ inch hallways
- Laundry & utility: Electric and gas dryer hookups; Water heaters (gas)
Neighborhood map
What this means for you Summary
Snapshot
- This is a 2 × 2-bed/1.0-bath units multifamily listed at $446k.
Deal economics
- At list price, monthly cash flow is $520 ($6k/yr) — positive. Per door: $260/mo.
- The deal already cash-flows at list — no discount required.
- Meets the 1% rule at list price ($4k rent vs $446k).
- Recommended offer: $433k (3.0% below list) — sets the bar for market timing.
Location & tenants
- Location reads: area grade D — affects rentability + tenant quality, not the cash-flow math above.
- St. Paul Public School District (urban): math 21% / reading 33% proficiency, ranked #270 of 301 in MN (top 90%) — low school quality limits family demand, transient renter base, plan for 1-2y turnover; 64% free/reduced lunch — lower-income household profile, screen leases tightly.
- Market conditions: Rents rising (+2.5%/yr); 191 active listings in the ZIP; 1 comparable units currently listed for rent nearby; solid renter incomes; 1,202 units permitted in Ramsey County in 2024 (880 in 5+ unit buildings).
- At $4,473/mo this rent would consume 71% of the median local household income ($76k/yr) (locally 2116% of renters already pay >50% of income on rent) — very limited rent-growth headroom before tenants either downsize or default.
Forward outlook
- Local home prices are declining (-3.0%/yr); year-one equity from $3k of loan paydown is wiped out by about $13k of value loss. Plan a longer hold.
- Ramsey County population projected at +27% by 2050 — long-run rental-demand tailwind backs the buy-and-hold thesis.
Negotiation context
- It's been on market 34 days — a 3% lower offer ($433k) is reasonable based on typical stale-listing flexibility.
- Current owner paid $64k; list at $446k implies a 593% gain — meaningful room to come down on a strong offer.
Risks & watch-outs
- Watch-outs: built in 1912 — expect roof / HVAC / electrical / plumbing capex.
Questions for the listing agent
- It's been on market 34 days. Have you received any prior offers? Is the seller open to a 3% concession, seller financing, or rate buy-down credit?
- Can we see the unit-by-unit rent roll, current vacancy, and any below-market leases? What's the average tenancy length?
- What capital expenditures (roof, boiler, parking lot, exteriors) have been made in the last 5 years, and what's planned in the next 2?
- Built in 1912 — when were the roof, HVAC, electrical panel, plumbing, and water heater last replaced?
- Is there a deadline driving the sale (1031 exchange, divorce, estate, relocation)? That informs how much negotiation room exists.
- The area grade is low — what's the realistic commute time and amenity access for the typical tenant pool here? Any planned neighborhood developments (good or bad) we should know about?
- What's the average days-on-market for RENTAL listings here right now (not sales)? A rising rental-DOM trend means longer vacancies and softer asking-rent achievability than the comps imply.
- What's the recent tenant-quality profile in this submarket — average credit score on applications, eviction rate, late-payment / NSF rate, and stable-employment percentage? A property-management company in the area should have these aggregated.
- How much new apartment / multifamily construction is in the pipeline within 1–3 miles? Heavy new supply (>2% of stock underway) typically softens rents 12–24 months out; light construction supports rent growth.
Investment metrics
- 1% rule
- 1.00% ✓
- Cap rate
- 7.69%
- Cash-on-cash
- 4.99%
- DSCR
- 1.22
- GRM
- 8.3
CMA / ARV
No comps found within radius.
Projected returns pro-forma
-3.0% appreciation · 2.5% rent growth · sell at horizon
- IRR
- -9.1%
- Equity multiple
- 0.67×
- Total profit
- $-41,462
- Equity at exit
- $66,575
- IRR
- -0.3%
- Equity multiple
- 0.98×
- Total profit
- $-2,476
- Equity at exit
- $38,605
Cash invested: $125,020 (down + closing). Projections, not guarantees.
Landlord ↔ Tenant lean methodology
- Overall (STATE)
- 46 Balanced
- State Minnesota
- 46 Balanced · D+2
- County
- — inherits STATE
- City
- — inherits STATE
ZIP-level market 55104
- Rents YoY
- 2.5%
- Active inventory
- 191
- Price-to-rent
- 16.6×
Monthly cashflow live
- Estimated rent
- $4,473 medium interval (Pro) →
- Mortgage (P&I)
- −$2,341
- Tax from tax record
- −$486 /mo · $5,836/yr
- Insurance
- −$186
- HOA
- −$0
- Vacancy / Maint / Mgmt
- −$939
- Net cashflow
- $520
Break-even live
2-unit breakdown (identical units grouped — click to expand)
| Units | Beds | Baths | Est. rent |
|---|---|---|---|
| 2× units | 2 | 1 | $4,474 |
| #1 | 2 | 1 | $2,237 |
| #2 | 2 | 1 | $2,237 |
| Total (2 units) | $4,473 | ||
UW: 25.0% down · 7.5% · 30yr · 1.5% tax · 5.0% vac · 8.0% maint · 8.0% mgmt
Financing live
Cash to close
- Down payment
- $111,625
- Closing costs
- $13,395
- Reserves months
- —
- Total cash needed
- —
Loan-product check · same deal, 3 products live
Conventional
25% down · 7.5% · 30yr
- Down + closing
- —
- Monthly P&I
- —
- Monthly cashflow
- —
- DSCR
- —
- Eligible?
- —
Personal DTI + credit; lowest rate.
DSCR
20% down · 8.5% · 30yr
- Down + closing
- —
- Monthly P&I
- —
- Monthly cashflow
- —
- DSCR
- —
- Eligible?
- —
No personal income docs; deal must DSCR.
Hard money
10% down · 12.0% · 12mo
- Down + closing
- —
- Monthly P&I
- —
- Monthly cashflow
- —
- DSCR
- —
- Eligible?
- —
Short-term bridge; refi at stabilization.
Rent comps 1 comps
| Address | Beds | Baths | Sqft | Rent | $/sqft | DOM | Units | Dist |
|---|---|---|---|---|---|---|---|---|
| 1555 Selby Ave Saint Paul, MN | 3.0 | 1.0–2.0 | 1129 | $4,398 | $3.90 | 2d | 7 | 0.98mi |
Listing history 16 events
-
2026-06-18days on market $446,500 Active 34 DOM
-
2026-06-17days on market $446,500 Active 33 DOM
-
2026-06-16days on market $446,500 Active 32 DOM
-
2026-06-15days on market $446,500 Active 31 DOM
-
2026-06-13days on market $446,500 Active 29 DOM
-
2026-06-09days on market $446,500 Active 25 DOM
-
2026-06-08days on market $446,500 Active 24 DOM
-
2026-06-07days on market $446,500 Active 23 DOM
-
2026-06-04days on market $446,500 Active 20 DOM
-
2026-06-03days on market $446,500 Active 19 DOM
-
2026-06-02days on market $446,500 Active 18 DOM
-
2026-06-01days on market $446,500 Active 17 DOM
-
2026-05-31days on market $446,500 Active 16 DOM
-
2026-05-16$446,500 Active 771-char remark
-
2026-05-15historical $446,500 771-char remark
-
1997-05-08soldstatus $64,400
ⓘ Source: listings_history table (triggers on properties + properties_extension) + one-shot
backfill from property_details.listing_events for pre-trigger history.
Tax reassessment forecast MN · Partial reset (capped growth)
- Current annual tax
- $5,836 · $486/mo
- Projected year-2 tax
- $5,836 · $486/mo
- Expected delta
- $0/yr ($0/mo · 0.0%)
ⓘ Screening estimate from a state-policy table — verify with the county assessor before closing.
Climate risk First Street
- Flood 1/10 Low FEMA zone X (unshaded) · 0% chance over 30 yrs
- Wildfire 1/10 Low
- Heat 2/10 Low 7 d/yr ≥99°F today · 14 d/yr by 30 yrs out
- Wind 2/10 Low
- Air quality 2/10 Low 1 unhealthy d/yr today · 1 by 30 yrs out
Nearby sold comps map
Loading sold comps map…
Walkable amenities ~0.75 mi
Loading nearby amenities…
Taxation est. · year 1
- Rental income
- $53,676
- − Mortgage interest
- −$25,011
- − Property taxes
- −$5,836
- − Insurance
- −$2,232
- − Repairs & maintenance
- −$4,294
- − Management
- −$4,294
- − Depreciation
- −$12,989
- Taxable loss
- −$981
- Est. tax savings @ 24.0%
- +$235
- After-tax cash flow
- $6,473/yr
For passive investors: Depreciation is non-cash, so a rental often shows a tax loss while cash-flowing — sheltering income. Rental losses are passive: they offset passive income freely, and up to $25,000/yr can offset ordinary (W-2) income if you actively participate and your MAGI is under $100k (phasing out to $0 by $150k); unused losses carry forward. On sale, claimed depreciation is recaptured at up to 25%, and gains may owe capital-gains tax (a 1031 exchange can defer both). Figures are a year-1 estimate at your 24.0% rate — not tax advice; consult a CPA.
Schools (NCES district)
- District
- St. Paul Public School District
- NCES district ID
- 2733840
- Math proficiency
- 21% ▼ -11.00%
- Reading proficiency
- 33% ▼ -7.00%
- Median HH income
- $48,316
- Composite
- 23.51/100
- National rank
- #7868
- State rank
- #270 of 301 in MN
Livability — St. Paul
No livability data for this city. (Only ~50 U.S. cities are tracked.)
Census & demographics
- Census place
- St. Paul, MN
- County
- Ramsey County · 542,837 people
- City population
- 280,599
- Metro
- Minneapolis-St. Paul-Bloomington, MN-WI
- Population (ZIP)
- 45,762
- Household income
- $75,712
- Rent vs Own
- Severe rent burden
- 2116.0
Population outlook (Ramsey County) Hauer SSP2
- Today (2025)
- 603,431 people
- By 2030
- 636,459 · +5.5%
- By 2040
- 700,596 · +16.1%
- By 2050
- 765,819 · +26.9%
- By 2075
- 929,297 · +54.0%
- By 2100
- 1,053,924 · +74.7%
Race, ethnicity, and origin ACS 2023
- Neighborhood character
- Diverse neighborhood (Simpson 0.60)
- Race & ethnicity
- White 60% Black 19% Two or more races 10% Asian 7% Hispanic / Latino 7%
- Hispanic origin (detail)
- Mexican 4%
- Common ancestry
- Portuguese 8% Romanian 3% Lithuanian 3%
- Foreign-born
- 12% · Canada, Vietnam, China
- Languages at home
- 83% English-only · Spanish 4% Other Asian/Pacific 4% French/Haitian/Cajun 1%
Political lean MEDSL · Ramsey
- 2024 margin
- Solid D (+43.3) · D 70.5% · R 27.2% · Other 2.3%
- 2008→2024 swing
- +9.4pp toward D · 2008: 33.9pp · 2024: 43.3pp
- All cycles
- 2024: D+43.3 2020: D+45.4 2016: D+39.4 2012: D+35.3 2008: D+33.9
Not yet ingested
- Civics
- —
Market trends
- HPI YoY
- ▼ -532.26%
- Current HPI
- 245.6146
- Rent YoY
- ▲ 2.50%
- Metro
- Minneapolis-St. Paul-Bloomington, MN-WI
- State GDP YoY
- ▲ 2.41%
- F500 in state
- 34
Industry mix (Fortune 500 HQ in MN)
| Industry | F500 HQs | Revenue |
|---|---|---|
| Healthcare | 2 | $407B |
|
||
| Retail | 2 | $150B |
|
||
| Consumer Goods | 2 | $32B |
|
||
| Industrial Machinery | 2 | $6B |
|
||
| Agriculture | 1 | $40B |
|
||
| Healthcare / Medical Devices | 1 | $32B |
|
||
Price history
+593.3% since first listed3 events — show timeline
- 2026-05-16 Listed $446,500 NORTHSTARMLS as Distributed by MLS Grid
- 2026-05-15 Coming Soon $446,500 NORTHSTARMLS as Distributed by MLS Grid
- 1997-05-08 Sold (Public Records) $64,400 Public Records
Property tax history
+2.9%/yrLatest (2025): $5,836 · -3.1% YoY. Source: county tax records.
Cash-flow waterfall
monthlySold comps — $/sqft
last 12 mo · ≤1 miLoading sold comps…