 Multi-family
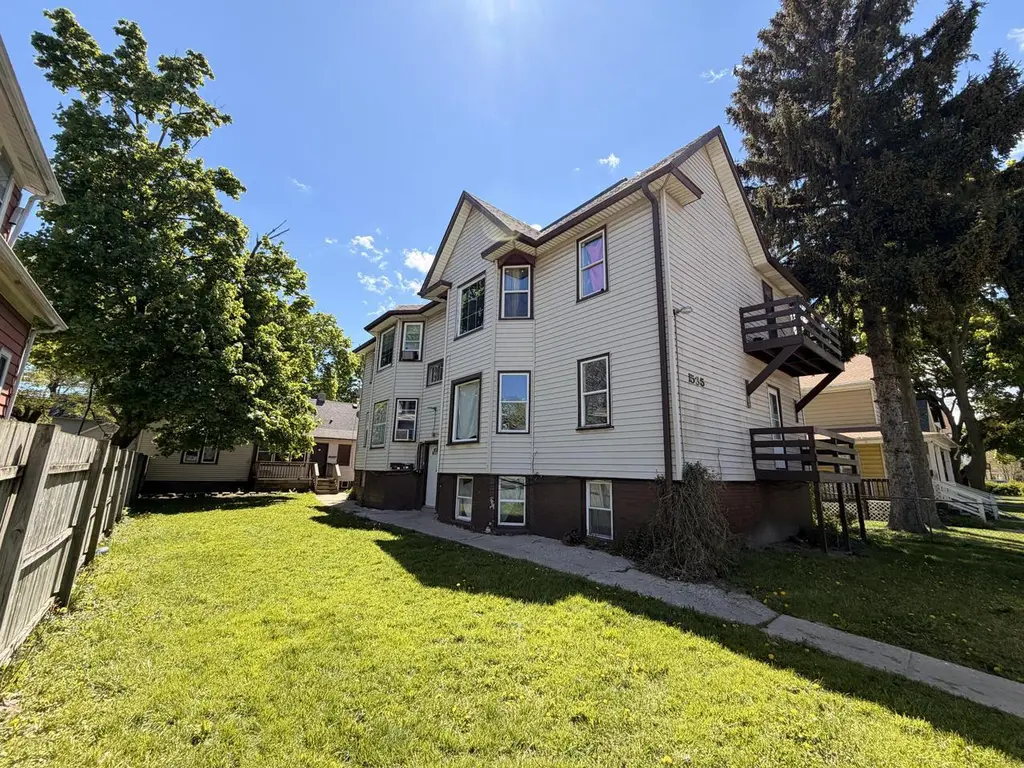
1533 Winslow St · Racine, WI
Flood risk 1/10 · Minimal
- FEMA flood zone
- X (unshaded)
- Chance of flooding over 30 yrs
- 0.0%
- Est. flood insurance / yr
- $473 – $860
Fire risk 1/10 · Minimal
- Est. fire insurance / yr
- $636 – $1,182
Heat risk 2/10 · Minimal
- Hot days now (above 95°F)
- 7 days/yr
- Hot days in 30 yrs
- 13 days/yr
Wind risk 2/10 · Minimal
- Chance of severe wind over 30 yrs
- —
Air-quality risk 3/10 · Minor
- Unhealthy air days now
- 3 days/yr
- Unhealthy air days in 30 yrs
- 3 days/yr
Risk factors via First Street. Map © Google.
Why this score? — see what drove the C+ grade
The composite is a weighted blend of 9 inputs, each scored 0–100. Each bar is that input's sub-score; the figure is the points it added to the 100-point composite (weight × sub-score).
- Cash flow +26.8/30.0
- DSCR +9.2/10.0
- ARV discount +7.5/15.0
- 1% rule +6.7/10.0
- Livability +4.0/5.0
- Rent growth +2.5/5.0
- Condition / age +2.5/5.0
- Schools +1.5/10.0
- Appreciation +0.0/10.0
$495,000
🖨 Deal sheet 📄 Offer letter ✓ Due diligence
Multi-family units
County records classify this as Multi-Family (5+ Unit). Listing-text estimate: 1 unit. estimate disagrees with records
5+ unit building — per-unit beds/baths from public records are typically unavailable; the breakdown below (if shown) is an estimate from the listing text.
Listing remarks MLS
Investment opportunity! This unique property features two residences on one lot; a 5 unit apartment building plus a separate single family home with full basement. Each apartment unit offers 2 bedrooms, 1 bathroom, and a private balcony. Four of the five units have been updated with durable LVP flooring and modern gray and white paint, giving the units a fresh, updated feel. This well maintained property also includes a 1 car attached garage on site. Excellent opportunity for investors looking to expand their portfolio with a versatile multi building property offering strong rental income! The property is currently generating $4,925 in rental income with $5,875 total rent potential (1 vacant unit).
Key facts
- Private balcony
- Full basement
- Two residences
Tags
Neighborhood map
What this means for you Summary
Snapshot
- This is a 8-bed/4.0-bath multifamily listed at $495k.
Deal economics
- At list price, monthly cash flow is $1k ($16k/yr) — positive.
- The deal already cash-flows at list — no discount required.
- Meets the 1% rule at list price ($6k rent vs $495k).
- Recommended offer: $480k (3.0% below list) — sets the bar for market timing.
- Cap rate 9.6% vs local median 4.0% in Racine — top-decile yield for the area; either an underpriced asset or a hidden risk that comps aren't pricing in. Stress-test before assuming the spread holds.
Location & tenants
- Location reads 80/100 on livability (#58 in WI, #1,622 nationally) — a professional / high-income tenant draw. Strengths: commute A+, cost of living A+, housing A+; Watch: employment D, schools D-.
- Racine Unified School District (urban): math 12% / reading 20% proficiency, ranked #335 of 342 in WI (top 98%) — low school quality limits family demand, transient renter base, plan for 1-2y turnover.
- Market conditions: 24 active listings in the ZIP; 505 units permitted in Racine County in 2024 (287 in 5+ unit buildings).
- At $5,809/mo this rent would consume 138% of the median local household income ($50k/yr) (locally 746% of renters already pay >50% of income on rent) — very limited rent-growth headroom before tenants either downsize or default.
Forward outlook
- Local home prices are declining (-3.0%/yr); year-one equity from $3k of loan paydown is wiped out by about $15k of value loss. Plan a longer hold.
- Racine County population projected to shrink 7% by 2050 — rents likely to lag national; underwrite the cash flow, not the appreciation.
- At projected returns (-3.0% appreciation + 3.0% rent growth), your $139k cash investment doubles in ~10 years — after that, you're playing with house money.
Negotiation context
- It's been on market 36 days — a 3% lower offer ($480k) is reasonable based on typical stale-listing flexibility.
- 4 sale attempts since 12y ago with the ask held roughly flat each time — persistent listings suggest the price (not the market) is what's stuck; bring a comps-based counter.
- Current owner paid $122k; list at $495k implies a 306% gain — meaningful room to come down on a strong offer.
Risks & watch-outs
- Watch-outs: built in 1900 — expect roof / HVAC / electrical / plumbing capex.
Questions for the listing agent
- It's been on market 36 days. Have you received any prior offers? Is the seller open to a 3% concession, seller financing, or rate buy-down credit?
- Built in 1900 — when were the roof, HVAC, electrical panel, plumbing, and water heater last replaced?
- Is there a deadline driving the sale (1031 exchange, divorce, estate, relocation)? That informs how much negotiation room exists.
- Schools are D-rated, which usually means shorter tenancies and higher turnover. Who's the typical renter profile here, and what's been the actual vacancy rate?
- What's the average days-on-market for RENTAL listings here right now (not sales)? A rising rental-DOM trend means longer vacancies and softer asking-rent achievability than the comps imply.
- What's the recent tenant-quality profile in this submarket — average credit score on applications, eviction rate, late-payment / NSF rate, and stable-employment percentage? A property-management company in the area should have these aggregated.
- How much new apartment / multifamily construction is in the pipeline within 1–3 miles? Heavy new supply (>2% of stock underway) typically softens rents 12–24 months out; light construction supports rent growth.
Investment metrics
- 1% rule
- 1.17% ✓
- Cap rate
- 9.56%
- Cash-on-cash
- 11.68%
- DSCR
- 1.52
- GRM
- 7.1
CMA / ARV
- ARV (median comp)
- $294,055
- List price
- $495,000
- Delta
- 68.34%
- Verdict
- OVERPRICED
- Comps
- 13 within 1.0 mi
Show comp detail 1 sale within ~0.75 mi
| Address | Dist | Beds/Ba | Sqft | Sold | Price | $/sf | Match |
|---|---|---|---|---|---|---|---|
| 932 Center St | 0.68mi | 9/2.0 (+1) | 2,900 (-14%) | 21mo | $150,000 | $52 | 15 |
Match score weights: distance 35% · size 25% · config 20% · recency 20%. Top-matched comps best support the ARV.
Projected returns pro-forma
-3.0% appreciation · 3.0% rent growth · sell at horizon
- IRR
- 1.1%
- Equity multiple
- 1.04×
- Total profit
- $5,681
- Equity at exit
- $73,806
- IRR
- 10.7%
- Equity multiple
- 1.83×
- Total profit
- $115,482
- Equity at exit
- $42,799
Cash invested: $138,600 (down + closing). Projections, not guarantees.
Landlord ↔ Tenant lean methodology
- Overall (STATE)
- 73 Landlord-Friendly
- State Wisconsin
- 73 Landlord-Friendly · R+2
- County
- — inherits STATE
- City
- — inherits STATE
ZIP-level market 53404
- Home prices YoY
- -33.1%
- Active inventory
- 24
- Price-to-rent
- 35.5×
Monthly cashflow live
- Estimated rent
- $5,809 high interval (Pro) →
- Mortgage (P&I)
- −$2,596
- Tax from tax record
- −$438 /mo · $5,257/yr
- Insurance
- −$206
- HOA
- −$0
- Vacancy / Maint / Mgmt
- −$1,220
- Net cashflow
- $1,349
Break-even live
5-unit breakdown (identical units grouped — click to expand)
| Units | Beds | Baths | Est. rent |
|---|---|---|---|
| 5× units | 2 | 1 | $5,810 |
| #1 | 2 | 1 | $1,162 |
| #2 | 2 | 1 | $1,162 |
| #3 | 2 | 1 | $1,162 |
| #4 | 2 | 1 | $1,162 |
| #5 | 2 | 1 | $1,162 |
| Total (5 units) | $5,809 | ||
UW: 25.0% down · 7.5% · 30yr · 1.5% tax · 5.0% vac · 8.0% maint · 8.0% mgmt
Financing live
Cash to close
- Down payment
- $123,750
- Closing costs
- $14,850
- Reserves months
- —
- Total cash needed
- —
Loan-product check · same deal, 3 products live
Conventional
25% down · 7.5% · 30yr
- Down + closing
- —
- Monthly P&I
- —
- Monthly cashflow
- —
- DSCR
- —
- Eligible?
- —
Personal DTI + credit; lowest rate.
DSCR
20% down · 8.5% · 30yr
- Down + closing
- —
- Monthly P&I
- —
- Monthly cashflow
- —
- DSCR
- —
- Eligible?
- —
No personal income docs; deal must DSCR.
Hard money
10% down · 12.0% · 12mo
- Down + closing
- —
- Monthly P&I
- —
- Monthly cashflow
- —
- DSCR
- —
- Eligible?
- —
Short-term bridge; refi at stabilization.
Listing history 26 events
-
2026-06-19days on market $495,000 Active 36 DOM
-
2026-06-18days on market $495,000 Active 35 DOM
-
2026-06-17days on market $495,000 Active 34 DOM
-
2026-06-16days on market $495,000 Active 33 DOM
-
2026-06-15days on market $495,000 Active 32 DOM
-
2026-06-14days on market $495,000 Active 30 DOM
-
2026-06-13days on market $495,000 Active 29 DOM
-
2026-06-10days on market $495,000 Active 27 DOM
-
2026-06-09days on market $495,000 Active 26 DOM
-
2026-06-08days on market $495,000 Active 25 DOM
-
2026-06-07days on market $495,000 Active 24 DOM
-
2026-06-05days on market $495,000 Active 21 DOM
-
2026-06-03days on market $495,000 Active 20 DOM
-
2026-06-02days on market $495,000 Active 19 DOM
-
2026-06-01days on market $495,000 Active 18 DOM
-
2026-05-31days on market $495,000 Active 17 DOM
-
2026-05-30days on market $495,000 Active 16 DOM
-
2026-05-14$495,000 Active 707-char remark
Show marketing remark (707 chars)
Investment opportunity! This unique property features two residences on one lot; a 5 unit apartment building plus a separate single family home with full basement. Each apartment unit offers 2 bedrooms, 1 bathroom, and a private balcony. Four of the five units have been updated with durable LVP flooring and modern gray and white paint, giving the units a fresh, updated feel. This well maintained property also includes a 1 car attached garage on site. Excellent opportunity for investors looking to expand their portfolio with a versatile multi building property offering strong rental income! The property is currently generating $4,925 in rental income with $5,875 total rent potential (1 vacant unit).
-
2024-08-02historical $875
-
2024-07-18$875
-
2024-02-05historical $825
-
2024-01-12$825
-
2022-08-18price $750
-
2014-01-30$135,000 340-char remark
Show marketing remark (340 chars)
Two residences on the same lot; one is a five unit complex and the other is a single unit apartment. The single unit is currently occupied and the larger structure is in the process of being ''re-habbed. '' Tenants were removed to allow for owner's updating. Square footage and lot size from public web-site sources; not verified by broker.
-
2014-01-30historical 340-char remark
Show marketing remark (340 chars)
Two residences on the same lot; one is a five unit complex and the other is a single unit apartment. The single unit is currently occupied and the larger structure is in the process of being ''re-habbed. '' Tenants were removed to allow for owner's updating. Square footage and lot size from public web-site sources; not verified by broker.
-
2001-07-13soldstatus $122,000
ⓘ Source: listings_history table (triggers on properties + properties_extension) + one-shot
backfill from property_details.listing_events for pre-trigger history.
Tax reassessment forecast WI · Partial reset (capped growth)
- Current annual tax
- $5,257 · $438/mo
- Projected year-2 tax
- $7,207 · $601/mo
- Expected delta
- +$1,950/yr (+$163/mo · 37.1%)
ⓘ Screening estimate from a state-policy table — verify with the county assessor before closing.
Climate risk First Street
- Flood 1/10 Low FEMA zone X (unshaded) · 0% chance over 30 yrs
- Wildfire 1/10 Low
- Heat 2/10 Low 7 d/yr ≥95°F today · 13 d/yr by 30 yrs out
- Wind 2/10 Low
- Air quality 3/10 Moderate 3 unhealthy d/yr today · 3 by 30 yrs out
Nearby sold comps map
Loading sold comps map…
Walkable amenities ~0.75 mi
Loading nearby amenities…
Taxation est. · year 1
- Rental income
- $69,708
- − Mortgage interest
- −$27,728
- − Property taxes
- −$5,257
- − Insurance
- −$2,475
- − Repairs & maintenance
- −$5,577
- − Management
- −$5,577
- − Depreciation
- −$14,400
- Taxable income
- $8,695
- Est. tax owed @ 24.0%
- −$2,087
- After-tax cash flow
- $14,101/yr
For passive investors: Depreciation is non-cash, so a rental often shows a tax loss while cash-flowing — sheltering income. Rental losses are passive: they offset passive income freely, and up to $25,000/yr can offset ordinary (W-2) income if you actively participate and your MAGI is under $100k (phasing out to $0 by $150k); unused losses carry forward. On sale, claimed depreciation is recaptured at up to 25%, and gains may owe capital-gains tax (a 1031 exchange can defer both). Figures are a year-1 estimate at your 24.0% rate — not tax advice; consult a CPA.
Schools (NCES district)
- District
- Racine Unified School District
- NCES district ID
- 5512360
- Math proficiency
- 12% ▼ -7.00%
- Reading proficiency
- 20% ▬ 0.00%
- Median HH income
- $50,716
- Composite
- 14.64/100
- National rank
- #9405
- State rank
- #335 of 342 in WI
Livability — Racine
- Score
- 80/100
- State rank
- #58
- US rank
- #1622
Category grades
Schools grade is shown separately in the Schools card above.
Census & demographics
- Census place
- Racine, WI
- County
- Racine County · 146,693 people
- City population
- 67,505
- Metro
- Racine, WI
- Population (ZIP)
- 13,703
- Household income
- $50,428
- Rent vs Own
- Severe rent burden
- 746.0
Population outlook (Racine County) Hauer SSP2
- Today (2025)
- 195,281 people
- By 2030
- 193,725 · -0.8%
- By 2040
- 188,159 · -3.6%
- By 2050
- 181,323 · -7.1%
- By 2075
- 174,342 · -10.7%
- By 2100
- 166,870 · -14.5%
Race, ethnicity, and origin ACS 2023
- Neighborhood character
- Diverse neighborhood (Simpson 0.67)
- Race & ethnicity
- Hispanic / Latino 40% White 35% Black 21% Two or more races 21%
- Hispanic origin (detail)
- Mexican 34% Puerto Rican 5%
- Common ancestry
- Romanian 4% Lithuanian 2% Iranian 2%
- Foreign-born
- 7% · Canada, South Korea
- Languages at home
- 83% English-only · Spanish 14% Other Indo-European 1% Tagalog/Filipino 1%
Political lean MEDSL · Racine
- 2024 margin
- Lean R (+6.2) · D 46.3% · R 52.5% · Other 1.2%
- 2008→2024 swing
- -13.6pp toward R · 2008: 7.4pp · 2024: -6.2pp
- All cycles
- 2024: R+6.2 2020: R+4.1 2016: R+4.4 2012: D+3.6 2008: D+7.4
Not yet ingested
- Civics
- —
Market trends
- HPI YoY
- ▼ -104.32%
- Current HPI
- 210.906
- Rent YoY
- —
- Metro
- Racine, WI
- State GDP YoY
- ▲ 2.10%
- F500 in state
- 20
Industry mix (Fortune 500 HQ in WI)
| Industry | F500 HQs | Revenue |
|---|---|---|
| Industrial Machinery | 4 | $23B |
|
||
| Industrial Technology | 2 | $36B |
|
||
| Insurance | 1 | $36B |
|
||
| Professional Services | 1 | $19B |
|
||
| Utilities | 1 | $9B |
|
||
| Consumer Goods | 1 | $3B |
|
||
Price history
+305.7% since first listed9 events — show timeline
- 2026-05-14 Listed $495,000 METROMLS
- 2024-08-02 Rental Removed $875 APPFOLIO
- 2024-07-18 Listed for Rent $875 APPFOLIO
- 2024-02-05 Rental Removed $825 APPFOLIO
- 2024-01-12 Listed for Rent $825 APPFOLIO
- 2022-08-18 Price Changed $750 RENT.
- 2014-01-30 Listing Removed — METROMLS
- 2014-01-30 Listed $135,000 METROMLS
- 2001-07-13 Sold (Public Records) $122,000 Public Records
Property tax history
+3.8%/yrLatest (2025): $5,257 · -4.1% YoY. Source: county tax records.
Cash-flow waterfall
monthlySold comps — $/sqft
last 12 mo · ≤1 miLoading sold comps…