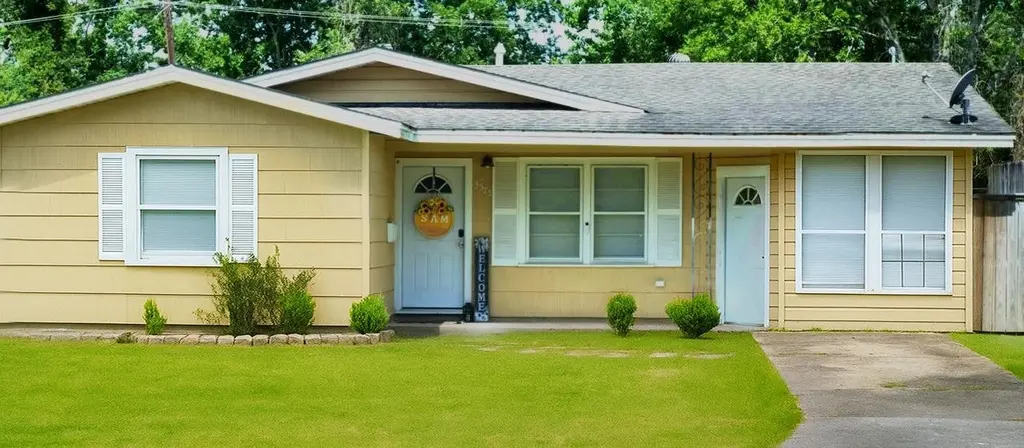
3575 Cecil Dr · Beaumont, TX
Flood risk 4/10 · Minor
- FEMA flood zone
- X
- Chance of flooding over 30 yrs
- 0.21%
- Est. flood insurance / yr
- $507 – $1,088
Fire risk 1/10 · Minimal
- Est. fire insurance / yr
- $1,222 – $2,270
Heat risk 9/10 · Severe
- Hot days now (above 110°F)
- 7 days/yr
- Hot days in 30 yrs
- 24 days/yr
Wind risk 9/10 · Severe
- Chance of severe wind over 30 yrs
- 99.0%
Air-quality risk 2/10 · Minimal
- Unhealthy air days now
- 1 days/yr
- Unhealthy air days in 30 yrs
- 1 days/yr
Risk factors via First Street. Map © Google.
Why this score? — see what drove the D+ grade
The composite is a weighted blend of 9 inputs, each scored 0–100. Each bar is that input's sub-score; the figure is the points it added to the 100-point composite (weight × sub-score).
- ARV discount +15.0/15.0
- Cash flow +13.9/30.0
- 1% rule +4.6/10.0
- DSCR +4.2/10.0
- Livability +3.2/5.0
- Rent growth +2.7/5.0
- Condition / age +2.5/5.0
- Schools +1.5/10.0
- Appreciation +0.0/10.0
$155,000
🖨 Deal sheet 📄 Offer letter ✓ Due diligence
Listing remarks MLS
Located in Beaumont's west end! This home has had some great updates! Spacious living room with built-ins and stained wood flooring. Kitchen features updates: gas range, microwave, tile backsplash, and plenty of cabinet space. Large pantry with additional storage space in bonus area. Rolling island can stay. Modern dining room. 3 Bedrooms. 2 bathrooms. Office space with windows for natural lighting. Spacious back yard with one small storage building. Covered back patio.
Key facts
- Functional kitchen
- Spacious living area
- Private bath
Tags
Neighborhood map
What this means for you Summary
Snapshot
- This is a 3-bed/2.0-bath single-family listed at $155k.
Deal economics
- At list price, monthly cash flow is $17 ($199/yr) — positive.
- The deal already cash-flows at list — no discount required.
- To meet the 1% rule (rent ≥ 1% of price), the offer needs to be $149k (3.8% below list).
- Recommended offer: $136k (12.0% below list) — sets the bar for market timing.
- Cap rate 6.4% vs local median 5.3% in Beaumont — meaningfully above typical; check what's discounted (condition, days-on-market, listing class) to confirm the premium yield is real.
Location & tenants
- Location reads 64/100 on livability (#739 in TX) — a middle-class / working-renter tenant base. Strengths: cost of living A+, housing A+, health & safety A+; Watch: employment D, schools D-, crime F.
- Beaumont ISD (urban): math 14% / reading 22% proficiency, ranked #789 of 826 in TX (top 96%) — low school quality limits family demand, transient renter base, plan for 1-2y turnover; 69% free/reduced lunch — lower-income household profile, screen leases tightly.
- Market conditions: Rents flat; 258 active listings in the ZIP; 16 comparable units currently listed for rent nearby; rentals lingering (median 44d on market — plan ~5-8 weeks vacancy on turnover, expect pricing pressure); 62% of comp listings sitting > 30 days — soft ceiling on asking rent; 343 units permitted in Jefferson County in 2024 (0 in 5+ unit buildings).
Forward outlook
- Local home prices are declining (-3.0%/yr); year-one equity from $1k of loan paydown is wiped out by about $5k of value loss. Plan a longer hold.
Negotiation context
- It's been on market 200 days — a 12% lower offer ($136k) is reasonable based on typical stale-listing flexibility.
- 4 sale attempts since 6y ago; this cycle's ask has dropped $15k (9%) from the opening price — seller is motivated, your offer sets the floor, not the list.
Risks & watch-outs
- Climate carrying-cost: severe wind risk, 99% chance of damaging wind over 30y; extreme-heat days projected 7→24/yr by 2055 (HVAC capex compounding) — expect insurance premiums to compound above CPI over the hold.
Questions for the listing agent
- It's been on market 200 days. Have you received any prior offers? Is the seller open to a 12% concession, seller financing, or rate buy-down credit?
- Built in 1962 — when were the roof, HVAC, electrical panel, plumbing, and water heater last replaced?
- Why hasn't it sold? Are there any deal-killer items the seller is aware of (foundation, flood, title, zoning, code violations)?
- Is there a deadline driving the sale (1031 exchange, divorce, estate, relocation)? That informs how much negotiation room exists.
- Schools are D-rated, which usually means shorter tenancies and higher turnover. Who's the typical renter profile here, and what's been the actual vacancy rate?
- Crime grade is F in this area — have there been break-ins, vandalism, or insurance claims at this property in the last 3 years? What carrier currently insures it and at what premium?
- The area grade is low — what's the realistic commute time and amenity access for the typical tenant pool here? Any planned neighborhood developments (good or bad) we should know about?
- What's the average days-on-market for RENTAL listings here right now (not sales)? A rising rental-DOM trend means longer vacancies and softer asking-rent achievability than the comps imply.
- What's the recent tenant-quality profile in this submarket — average credit score on applications, eviction rate, late-payment / NSF rate, and stable-employment percentage? A property-management company in the area should have these aggregated.
- How much new for-sale + rental construction is in the pipeline within 1–3 miles? Heavy new supply typically softens prices + rents 12–24 months out; constrained supply supports both.
Investment metrics
- 1% rule
- 0.96% ✗
- Cap rate
- 6.42%
- Cash-on-cash
- 0.46%
- DSCR
- 1.02
- GRM
- 8.7
CMA / ARV
- ARV (on-the-fly)
- $233,389
- Comps found
- 2
Show comp detail 2 sales within ~0.75 mi
| Address | Dist | Beds/Ba | Sqft | Sold | Price | $/sf | Match |
|---|---|---|---|---|---|---|---|
| 3641 Briar Creek Dr | 0.29mi | 2/2.0 (-1) | 1,361 (-1%) | 3mo | $170,000 | $125 | 76 |
| 4750 Coolidge St | 0.32mi | 3/2.0 | 1,478 (+7%) | 8mo | $249,900 | $169 | 66 |
Match score weights: distance 35% · size 25% · config 20% · recency 20%. Top-matched comps best support the ARV.
Projected returns pro-forma
-3.0% appreciation · 0.66% rent growth · sell at horizon
- IRR
- -18.4%
- Equity multiple
- 0.37×
- Total profit
- $-27,410
- Equity at exit
- $23,111
- IRR
- -16.7%
- Equity multiple
- 0.18×
- Total profit
- $-35,616
- Equity at exit
- $13,402
Cash invested: $43,400 (down + closing). Projections, not guarantees.
Landlord ↔ Tenant lean methodology
- Overall (STATE)
- 87 Strongly Landlord-Friendly
- State Texas
- 87 Strongly Landlord-Friendly · R+5
- County
- — inherits STATE
- City
- — inherits STATE
ZIP-level market 77706
- Rents YoY
- 0.7%
- Active inventory
- 258
- Price-to-rent
- 8.7×
Monthly cashflow live
- Estimated rent
- $1,490 high interval (Pro) →
- Mortgage (P&I)
- −$813
- Tax from tax record
- −$283 /mo · $3,400/yr
- Insurance
- −$65
- HOA
- −$0
- Vacancy / Maint / Mgmt
- −$313
- Net cashflow
- $17
Break-even live
UW: 25.0% down · 7.5% · 30yr · 1.5% tax · 5.0% vac · 8.0% maint · 8.0% mgmt
Financing live
Cash to close
- Down payment
- $38,750
- Closing costs
- $4,650
- Reserves months
- —
- Total cash needed
- —
Loan-product check · same deal, 3 products live
Conventional
25% down · 7.5% · 30yr
- Down + closing
- —
- Monthly P&I
- —
- Monthly cashflow
- —
- DSCR
- —
- Eligible?
- —
Personal DTI + credit; lowest rate.
DSCR
20% down · 8.5% · 30yr
- Down + closing
- —
- Monthly P&I
- —
- Monthly cashflow
- —
- DSCR
- —
- Eligible?
- —
No personal income docs; deal must DSCR.
Hard money
10% down · 12.0% · 12mo
- Down + closing
- —
- Monthly P&I
- —
- Monthly cashflow
- —
- DSCR
- —
- Eligible?
- —
Short-term bridge; refi at stabilization.
Rent comps 16 comps
| Address | Beds | Baths | Sqft | Rent | $/sqft | DOM | Units | Dist |
|---|---|---|---|---|---|---|---|---|
| 3925 Crow Rd Unit 49 Beaumont, TX | 2.0 | 1.5 | 1306 | $1,325 | $1.01 | 43d | 1 | 0.31mi |
| 3995 Crow Rd Unit 201 Beaumont, TX | 2.0 | 2.0 | 1162 | $1,550 | $1.33 | 43d | 1 | 0.36mi |
| 4695 Collier St #8 Beaumont, TX | 2.0 | 1.5 | 1121 | $1,150 | $1.03 | 43d | 1 | 0.48mi |
| 4636 Collier St Beaumont, TX | 2.0 | 1.0 | 969 | $1,030 | $1.06 | 43d | 1 | 0.49mi |
| 3910 Treadway Rd Beaumont, TX | 2.0–3.0 | 1.0–1.5 | 1019 | $1,849 | $1.81 | 13d | 10 | 0.58mi |
| 6120 Folsom Dr Beaumont, TX | 1.0–2.0 | 1.0–2.0 | 901 | $1,499 | $1.66 | 43d | 1 | 0.74mi |
| 2995 Wier Dr Beaumont, TX | 3.0 | 2.0 | 1446 | $1,800 | $1.24 | 13d | 1 | 0.98mi |
| 5740 Northwest Pkwy Beaumont, TX | 1.0–2.0 | 1.0–2.0 | 884 | $1,499 | $1.69 | 13d | 1 | 0.99mi |
| 3155 French Rd Beaumont, TX | 1.0–3.0 | 1.0–2.0 | 905 | $999 | $1.10 | 13d | 9 | 1.04mi |
| 5356 Old Dowlen Rd Beaumont, TX | 2.0 | 2.0 | 1112 | $1,350 | $1.21 | 43d | 1 | 1.16mi |
| 1620 Wellington Pl #903 Beaumont, TX | 2.0 | 2.5 | 1215 | $1,750 | $1.44 | 43d | 1 | 1.22mi |
| 5680 Shivers Dr Beaumont, TX | 3.0 | 1.0 | 1442 | $1,500 | $1.04 | 23d | 1 | 1.22mi |
| 3910 Baldwin St Beaumont, TX | 3.0 | 1.0 | 1220 | $1,200 | $0.98 | 23d | 1 | 1.27mi |
| 3825 Hyde Park Row Beaumont, TX | 3.0 | 2.0 | 1271 | $1,550 | $1.22 | 43d | 1 | 1.29mi |
| 6161 Sienna TRL Beaumont, TX | 2.0 | 2.0 | 1003 | $1,129 | $1.13 | 43d | 1 | 1.29mi |
| 5340 Bettes Ln Beaumont, TX | 3.0 | 1.5 | 1496 | $1,575 | $1.05 | 43d | 1 | 1.40mi |
Listing history 18 events
-
2026-04-19status Pending
-
2026-04-08price $155,000
-
2026-03-24price $162,000
-
2026-02-20price $165,000
-
2026-02-06price $170,000
-
2026-01-20status Active
-
2026-01-20price $176,000
-
2025-10-20historical
-
2025-09-17price $160,000
-
2025-07-29price $164,999
-
2025-07-01$170,000 Active
-
2022-11-23soldstatus Closed 474-char remark
Show marketing remark (474 chars)
Located in Beaumont's west end! This home has had some great updates! Spacious living room with built-ins and stained wood flooring. Kitchen features updates: gas range, microwave, tile backsplash, and plenty of cabinet space. Large pantry with additional storage space in bonus area. Rolling island can stay. Modern dining room. 3 Bedrooms. 2 bathrooms. Office space with windows for natural lighting. Spacious back yard with one small storage building. Covered back patio.
-
2022-11-23soldstatus
Show marketing remark (474 chars)
Located in Beaumont's west end! This home has had some great updates! Spacious living room with built-ins and stained wood flooring. Kitchen features updates: gas range, microwave, tile backsplash, and plenty of cabinet space. Large pantry with additional storage space in bonus area. Rolling island can stay. Modern dining room. 3 Bedrooms. 2 bathrooms. Office space with windows for natural lighting. Spacious back yard with one small storage building. Covered back patio.
-
2022-11-11historical 474-char remark
Show marketing remark (474 chars)
Located in Beaumont's west end! This home has had some great updates! Spacious living room with built-ins and stained wood flooring. Kitchen features updates: gas range, microwave, tile backsplash, and plenty of cabinet space. Large pantry with additional storage space in bonus area. Rolling island can stay. Modern dining room. 3 Bedrooms. 2 bathrooms. Office space with windows for natural lighting. Spacious back yard with one small storage building. Covered back patio.
-
2022-10-07$155,000 474-char remark
Show marketing remark (474 chars)
Located in Beaumont's west end! This home has had some great updates! Spacious living room with built-ins and stained wood flooring. Kitchen features updates: gas range, microwave, tile backsplash, and plenty of cabinet space. Large pantry with additional storage space in bonus area. Rolling island can stay. Modern dining room. 3 Bedrooms. 2 bathrooms. Office space with windows for natural lighting. Spacious back yard with one small storage building. Covered back patio.
-
2020-03-24soldstatus
-
2020-03-06soldstatus 445-char remark
Show marketing remark (445 chars)
Lots of updates in this cute little cottage in Regina Howell school district. 3/2/0 has a gutted/renovated kitchen all new cabinets, etc, Exterior redone and painted, piers and paperwork on file. Some wood floors and vinyl tile floors. The floorplan is flexible, because there is a possible small 4th bedroom with the 2nd shower close by. .. .would need to put up a wall, but easy to do because there are also 2 front doors. Inside utility room!
-
2020-02-07$98,900 445-char remark
Show marketing remark (445 chars)
Lots of updates in this cute little cottage in Regina Howell school district. 3/2/0 has a gutted/renovated kitchen all new cabinets, etc, Exterior redone and painted, piers and paperwork on file. Some wood floors and vinyl tile floors. The floorplan is flexible, because there is a possible small 4th bedroom with the 2nd shower close by. .. .would need to put up a wall, but easy to do because there are also 2 front doors. Inside utility room!
ⓘ Source: listings_history table (triggers on properties + properties_extension) + one-shot
backfill from property_details.listing_events for pre-trigger history.
Tax reassessment forecast TX · Resets to sale price
- Current annual tax
- $3,400 · $283/mo
- Projected year-2 tax
- $3,400 · $283/mo
- Expected delta
- $0/yr ($0/mo · 0.0%)
ⓘ Screening estimate from a state-policy table — verify with the county assessor before closing.
Climate risk First Street
- Flood 4/10 Moderate FEMA zone X · 21% chance over 30 yrs
- Wildfire 1/10 Low
- Heat 9/10 Extreme 7 d/yr ≥110°F today · 24 d/yr by 30 yrs out
- Wind 9/10 Extreme 99% chance of damaging wind over 30 yrs
- Air quality 2/10 Low 1 unhealthy d/yr today · 1 by 30 yrs out
Nearby sold comps map
Loading sold comps map…
Walkable amenities ~0.75 mi
Loading nearby amenities…
Taxation est. · year 1
- Rental income
- $17,884
- − Mortgage interest
- −$8,682
- − Property taxes
- −$3,400
- − Insurance
- −$775
- − Repairs & maintenance
- −$1,431
- − Management
- −$1,431
- − Depreciation
- −$4,509
- Taxable loss
- −$2,344
- Est. tax savings @ 24.0%
- +$563
- After-tax cash flow
- $762/yr
For passive investors: Depreciation is non-cash, so a rental often shows a tax loss while cash-flowing — sheltering income. Rental losses are passive: they offset passive income freely, and up to $25,000/yr can offset ordinary (W-2) income if you actively participate and your MAGI is under $100k (phasing out to $0 by $150k); unused losses carry forward. On sale, claimed depreciation is recaptured at up to 25%, and gains may owe capital-gains tax (a 1031 exchange can defer both). Figures are a year-1 estimate at your 24.0% rate — not tax advice; consult a CPA.
Schools (NCES district)
- District
- Beaumont ISD
- NCES district ID
- 4809670
- Math proficiency
- 14% ▼ -13.00%
- Reading proficiency
- 22% ▼ -7.00%
- Median HH income
- $41,683
- Composite
- 15.43/100
- National rank
- #9316
- State rank
- #789 of 826 in TX
Livability — Beaumont
- Score
- 64/100
- State rank
- #739
- US rank
- #13710
Category grades
Schools grade is shown separately in the Schools card above.
Census & demographics
- Census place
- Beaumont, TX
- County
- Jefferson County · 203,592 people
- City population
- 125,901
- Metro
- Beaumont-Port Arthur, TX
- Population (ZIP)
- 30,393
- Household income
- $73,185
- Rent vs Own
- Severe rent burden
- 1299.0
Population outlook (Jefferson County) Hauer SSP2
- Today (2025)
- 259,015 people
- By 2030
- 260,685 · +0.6%
- By 2040
- 263,309 · +1.7%
- By 2050
- 265,237 · +2.4%
- By 2075
- 270,193 · +4.3%
- By 2100
- 255,628 · -1.3%
Race, ethnicity, and origin ACS 2023
- Neighborhood character
- Diverse neighborhood (Simpson 0.61)
- Race & ethnicity
- White 56% Black 24% Hispanic / Latino 13% Two or more races 9% Asian 4%
- Hispanic origin (detail)
- Mexican 10%
- Common ancestry
- Lithuanian 4% Iranian 3% Slovak 2%
- Foreign-born
- 8% · Canada, China
- Languages at home
- 87% English-only · Spanish 8% Other Indo-European 2% German/W. Germanic 1%
Political lean MEDSL · Jefferson
- 2024 margin
- Lean R (+8.9) · D 45.1% · R 54.0%
- 2008→2024 swing
- -11.1pp toward R · 2008: 2.2pp · 2024: -8.9pp
- All cycles
- 2024: R+8.9 2020: R+1.6 2016: R+0.5 2012: D+1.6 2008: D+2.2
Not yet ingested
- Civics
- —
Market trends
- HPI YoY
- ▼ -180.53%
- Current HPI
- 159.4053
- Rent YoY
- ▲ 0.66%
- Metro
- Beaumont-Port Arthur, TX
- State GDP YoY
- ▲ 3.95%
- F500 in state
- 110
Industry mix (Fortune 500 HQ in TX)
| Industry | F500 HQs | Revenue |
|---|---|---|
| Energy | 16 | $1,198B |
|
||
| Technology | 5 | $198B |
|
||
| Engineering / Construction | 4 | $72B |
|
||
| Energy Services | 3 | $60B |
|
||
| Utilities | 3 | $41B |
|
||
| Healthcare | 2 | $330B |
|
||
Price history
+56.7% since first listed18 events — show timeline
- 2026-04-19 Pending — BBOR
- 2026-04-08 Price Changed $155,000 BBOR
- 2026-03-24 Price Changed $162,000 BBOR
- 2026-02-20 Price Changed $165,000 BBOR
- 2026-02-06 Price Changed $170,000 BBOR
- 2026-01-20 Relisted — BBOR
- 2026-01-20 Price Changed $176,000 BBOR
- 2025-10-20 Delisted — BBOR
- 2025-09-17 Price Changed $160,000 BBOR
- 2025-07-29 Price Changed $164,999 BBOR
- 2025-07-01 Listed $170,000 BBOR
- 2022-11-23 Sold (Public Records) — Public Records
- 2022-11-23 Sold (MLS) — BBOR
- 2022-11-11 Delisted — BBOR
- 2022-10-07 Listed $155,000 BBOR
- 2020-03-24 Sold (Public Records) — Public Records
- 2020-03-06 Sold (MLS) — BBOR
- 2020-02-07 Listed $98,900 BBOR
Property tax history
+5.1%/yrLatest (2025): $3,400 · -1.9% YoY. Source: county tax records.
Cash-flow waterfall
monthlySold comps — $/sqft
last 12 mo · ≤1 miLoading sold comps…