 Duplex
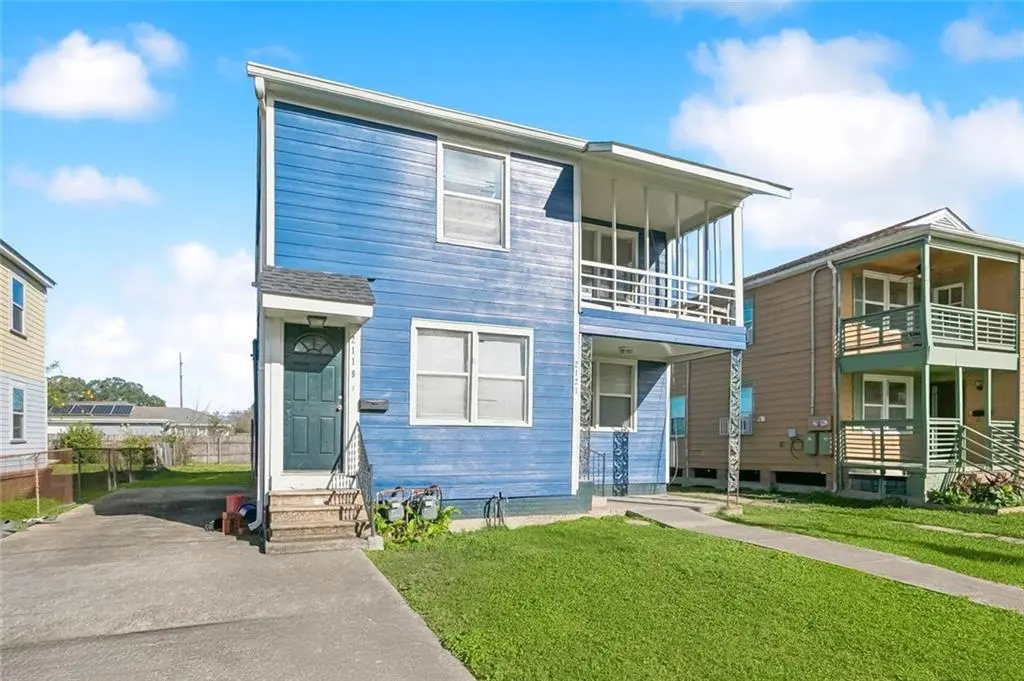
2119 21 Robin St · New Orleans, LA
Flood risk 8/10 · Major
- FEMA flood zone
- X (shaded)
- Chance of flooding over 30 yrs
- 0.6%
- Est. flood insurance / yr
- $507 – $1,088
Fire risk 1/10 · Minimal
- Est. fire insurance / yr
- $1,269 – $2,357
Heat risk 10/10 · Severe
- Hot days now (above 108°F)
- 7 days/yr
- Hot days in 30 yrs
- 21 days/yr
Wind risk 10/10 · Severe
- Chance of severe wind over 30 yrs
- 99.0%
Air-quality risk 4/10 · Minor
- Unhealthy air days now
- 4 days/yr
- Unhealthy air days in 30 yrs
- 4 days/yr
Risk factors via First Street. Map © Google.
Why this score? — see what drove the B grade
The composite is a weighted blend of 9 inputs, each scored 0–100. Each bar is that input's sub-score; the figure is the points it added to the 100-point composite (weight × sub-score).
- Cash flow +28.5/30.0
- ARV discount +13.7/15.0
- DSCR +10.0/10.0
- 1% rule +7.9/10.0
- Livability +4.0/5.0
- Condition / age +2.5/5.0
- Rent growth +2.3/5.0
- Schools +1.6/10.0
- Appreciation +0.0/10.0
$220,000
🖨 Deal sheet 📄 Offer letter ✓ Due diligence
Multi-family units
County records classify this as Multi-Family (2-4 Unit). Listing-text estimate: 2 units. confirmed
Listing remarks MLS
Now Available--This well-appointed Gentilly double offers comfortable, practical living in a convenient location and presents a flexible opportunity for both owner-occupants and investors. Call it home while the other unit helps offset your mortgage—or add it to your real estate investment portfolio. The property features two separate units—upstairs and downstairs—each with 2 independent bedrooms and 1 full bath, allowing for versatile use. Both units include a refrigerator and range/oven, with washer and dryer included. The upstairs unit also includes a dishwasher. Durable wood-look ceramic tile flooring throughout allows for easy maintenance—no carpet. Additional features include: Central air and heat for year-round comfort, separate water meters for each unit, independent bedrooms for added privacy, spacious backyard suitable for outdoor use. It is conveniently located near Elysian Fields Avenue and Filmore Avenue, offering easy access to University of New Orleans, Dillard University, and major thoroughfares including I-610, I-10, Lakeshore Drive, and Gentilly Boulevard. Schedule your showing today to explore this versatile Gentilly opportunity. The property is currently fully tenant-occupied so please allow 48-hour notice for showings.
Key facts
- Spacious backyard
- Two separate units
- Central air and heat
Tags
Neighborhood map
What this means for you Summary
Snapshot
- This is a 2 × 2-bed/1-bath units multifamily listed at $220k.
Deal economics
- At list price, monthly cash flow is $649 ($8k/yr) — positive. Per door: $324/mo.
- The deal already cash-flows at list — no discount required.
- Meets the 1% rule at list price ($3k rent vs $220k).
- Recommended offer: $194k (12.0% below list) — sets the bar for market timing.
- Cap rate 10.2% vs local median 4.4% in New Orleans — top-decile yield for the area; either an underpriced asset or a hidden risk that comps aren't pricing in. Stress-test before assuming the spread holds.
Location & tenants
- Location reads 81/100 on livability (#3 in LA, #1,383 nationally) — a professional / high-income tenant draw. Strengths: amenities A+, commute A+, health & safety A+; Watch: crime C-, employment D.
- Orleans Parish (urban): math 11% / reading 27% proficiency, ranked #69 of 98 in LA (top 70%) — low school quality limits family demand, transient renter base, plan for 1-2y turnover; 68% free/reduced lunch — lower-income household profile, screen leases tightly.
- Market conditions: Rents soft (-0.6%/yr); 332 active listings in the ZIP; 40 comparable units currently listed for rent nearby; rentals at typical pace (median 21d on market — plan ~3-4 weeks tenant-placement turnaround); 710 units permitted in Orleans Parish in 2024 (244 in 5+ unit buildings).
- At $2,830/mo this rent would consume 69% of the median local household income ($49k/yr) (locally 2150% of renters already pay >50% of income on rent) — very limited rent-growth headroom before tenants either downsize or default.
Forward outlook
- Local home prices are declining (-3.0%/yr); year-one equity from $2k of loan paydown is wiped out by about $7k of value loss. Plan a longer hold.
- Orleans County population projected at +61% by 2050 — long-run rental-demand tailwind backs the buy-and-hold thesis.
Negotiation context
- It's been on market 143 days — a 12% lower offer ($194k) is reasonable based on typical stale-listing flexibility.
- 2 sale attempts since 29y ago with the ask held roughly flat each time — persistent listings suggest the price (not the market) is what's stuck; bring a comps-based counter.
- Current owner paid $54k; list at $220k implies a 311% gain — meaningful room to come down on a strong offer.
Risks & watch-outs
- Watch-outs: flood insurance adds $66/mo.
- Climate carrying-cost: severe flood risk; severe wind risk, 99% chance of damaging wind over 30y; extreme-heat days projected 7→21/yr by 2055 (HVAC capex compounding) — expect insurance premiums to compound above CPI over the hold.
Questions for the listing agent
- It's been on market 143 days. Have you received any prior offers? Is the seller open to a 12% concession, seller financing, or rate buy-down credit?
- Can we see the unit-by-unit rent roll, current vacancy, and any below-market leases? What's the average tenancy length?
- What capital expenditures (roof, boiler, parking lot, exteriors) have been made in the last 5 years, and what's planned in the next 2?
- Built in 1960 — when were the roof, HVAC, electrical panel, plumbing, and water heater last replaced?
- What's the actual annual flood-insurance premium (NFIP or private), and is the property in a SFHA with mandatory coverage?
- Why hasn't it sold? Are there any deal-killer items the seller is aware of (foundation, flood, title, zoning, code violations)?
- Is there a deadline driving the sale (1031 exchange, divorce, estate, relocation)? That informs how much negotiation room exists.
- What's the average days-on-market for RENTAL listings here right now (not sales)? A rising rental-DOM trend means longer vacancies and softer asking-rent achievability than the comps imply.
- What's the recent tenant-quality profile in this submarket — average credit score on applications, eviction rate, late-payment / NSF rate, and stable-employment percentage? A property-management company in the area should have these aggregated.
- How much new apartment / multifamily construction is in the pipeline within 1–3 miles? Heavy new supply (>2% of stock underway) typically softens rents 12–24 months out; light construction supports rent growth.
Investment metrics
- 1% rule
- 1.29% ✓
- Cap rate
- 10.19%
- Cash-on-cash
- 13.93%
- DSCR
- 1.62
- GRM
- 6.5
CMA / ARV
- ARV (median comp)
- $255,403
- List price
- $220,000
- Delta
- -13.86%
- Verdict
- UNDERPRICED
- Comps
- 20 within 1.0 mi
Show comp detail 9 sales within ~0.75 mi
| Address | Dist | Beds/Ba | Sqft | Sold | Price | $/sf | Match |
|---|---|---|---|---|---|---|---|
| 5313 Wickfield Dr | 0.38mi | 4/2.0 | 1,665 (-1%) | 8mo | $165,000 | $99 | 74 |
| 2032 34 Elysian Fields Ave | 0.29mi | 4/2.0 | 1,668 (-1%) | 15mo | $310,000 | $186 | 72 |
| 5305 Wingate Dr | 0.32mi | 5/3.0 (+1) | 1,800 (+7%) | 3mo | $100,000 | $56 | 62 |
| 5549 51 Vermillion Blvd | 0.39mi | 3/2.0 (-1) | 1,547 (-8%) | 2mo | $245,000 | $158 | 62 |
| 5219 Spain St | 0.35mi | 3/2.0 (-1) | 1,827 (+8%) | 9mo | $85,000 | $47 | 57 |
| 5523 25 Elysian Fields Ave | 0.29mi | 4/2.0 | 1,908 (+13%) | 10mo | $210,000 | $110 | 56 |
| 4424 Annette St | 0.60mi | 4/3.5 | 1,664 (-1%) | 17mo | $230,000 | $138 | 50 |
| 2127-29 Mandolin St | 0.65mi | 4/2.0 | 1,474 (-13%) | 3mo | $230,000 | $156 | 46 |
| 2507-09 Dreux Ave | 0.58mi | 4/2.0 | 1,768 (+5%) | 24mo | $170,000 | $96 | 45 |
Match score weights: distance 35% · size 25% · config 20% · recency 20%. Top-matched comps best support the ARV.
Projected returns pro-forma
-3.0% appreciation · 0.0% rent growth · sell at horizon
- IRR
- -1.1%
- Equity multiple
- 0.96×
- Total profit
- $-2,533
- Equity at exit
- $32,803
- IRR
- 4.9%
- Equity multiple
- 1.31×
- Total profit
- $19,298
- Equity at exit
- $19,022
Cash invested: $61,600 (down + closing). Projections, not guarantees.
Landlord ↔ Tenant lean methodology
- Overall (STATE)
- 90 Strongly Landlord-Friendly
- State Louisiana
- 90 Strongly Landlord-Friendly · R+12
- County
- — inherits STATE
- City
- — inherits STATE
ZIP-level market 70122
- Rents YoY
- -0.6%
- Active inventory
- 332
- Price-to-rent
- 13.0×
Monthly cashflow live
- Estimated rent
- $2,830 high interval (Pro) →
- Mortgage (P&I)
- −$1,154
- Tax est. 1.5%
- −$275 /mo · $3,300/yr
- Insurance
- −$92
- Flood insurance flood zone
- −$66 /mo · $798/yr
- HOA
- −$0
- Vacancy / Maint / Mgmt
- −$594
- Net cashflow
- $649
Break-even live
2-unit breakdown (identical units grouped — click to expand)
| Units | Beds | Baths | Est. rent |
|---|---|---|---|
| 2× units | 2 | 1 | $2,830 |
| #1 | 2 | 1 | $1,415 |
| #2 | 2 | 1 | $1,415 |
| Total (2 units) | $2,830 | ||
UW: 25.0% down · 7.5% · 30yr · 1.5% tax · 5.0% vac · 8.0% maint · 8.0% mgmt
Financing live
Cash to close
- Down payment
- $55,000
- Closing costs
- $6,600
- Reserves months
- —
- Total cash needed
- —
Loan-product check · same deal, 3 products live
Conventional
25% down · 7.5% · 30yr
- Down + closing
- —
- Monthly P&I
- —
- Monthly cashflow
- —
- DSCR
- —
- Eligible?
- —
Personal DTI + credit; lowest rate.
DSCR
20% down · 8.5% · 30yr
- Down + closing
- —
- Monthly P&I
- —
- Monthly cashflow
- —
- DSCR
- —
- Eligible?
- —
No personal income docs; deal must DSCR.
Hard money
10% down · 12.0% · 12mo
- Down + closing
- —
- Monthly P&I
- —
- Monthly cashflow
- —
- DSCR
- —
- Eligible?
- —
Short-term bridge; refi at stabilization.
Rent comps 40 comps
| Address | Beds | Baths | Sqft | Rent | $/sqft | DOM | Units | Dist |
|---|---|---|---|---|---|---|---|---|
| 5151 Saint Anthony Ave New Orleans, LA | 3.0 | 2.0 | 1200 | $1,795 | $1.50 | 15d | 1 | 0.16mi |
| 5322 Saint Anthony Ave New Orleans, LA | 3.0 | 2.0 | 1192 | $2,000 | $1.68 | 15d | 1 | 0.29mi |
| 5546 Pasteur Blvd Unit A New Orleans, LA | 3.0 | 1.0 | 1200 | $1,400 | $1.17 | 23d | 1 | 0.36mi |
| 4736 Saint Anthony Ave New Orleans, LA | 3.0 | 1.0 | 1100 | $1,800 | $1.64 | 15d | 1 | 0.36mi |
| 5519 Mandeville St New Orleans, LA | 3.0 | 1.0 | 1125 | $1,650 | $1.47 | 3d | 1 | 0.38mi |
| 5718 Vermillion Blvd Unit A New Orleans, LA | 3.0 | 1.0 | 1300 | $2,000 | $1.54 | 23d | 1 | 0.45mi |
| 4618 Marigny St New Orleans, LA | 3.0 | 1.0 | 1320 | $1,900 | $1.44 | 23d | 1 | 0.46mi |
| 5723 Pasteur Blvd New Orleans, LA | 3.0 | 2.0 | 1150 | $1,700 | $1.48 | 16d | 1 | 0.46mi |
| 4815 Warrington Dr New Orleans, LA | 3.0 | 2.0 | 1652 | $2,150 | $1.30 | 15d | 1 | 0.47mi |
| 5172 Venus St Unit 5172 New Orleans, LA | 3.0 | 2.5 | 1864 | $2,450 | $1.31 | 23d | 1 | 0.59mi |
| 6009 Pasteur Blvd New Orleans, LA | 3.0 | 2.0 | 1250 | $1,785 | $1.43 | 23d | 1 | 0.60mi |
| 6010 Pasteur Blvd New Orleans, LA | 4.0 | 3.0 | 2010 | $2,600 | $1.29 | 16d | 1 | 0.60mi |
| 5716 Warrington Dr New Orleans, LA | 4.0 | 3.0 | 1560 | $2,000 | $1.28 | 16d | 1 | 0.61mi |
| 2458 Athis St New Orleans, LA | 4.0 | 2.0 | 1530 | $2,200 | $1.44 | 23d | 1 | 0.67mi |
| 6079 Saint Anthony Ave New Orleans, LA | 3.0 | 2.0 | 1400 | $2,400 | $1.71 | 15d | 1 | 0.71mi |
| 1903 Rosary Dr New Orleans, LA | 3.0 | 2.0 | 1500 | $1,800 | $1.20 | 23d | 1 | 0.72mi |
| 1940 Allen Toussaint Blvd Unit 1940 New Orleans, LA | 3.0 | 2.0 | 1500 | $1,600 | $1.07 | 23d | 1 | 0.76mi |
| 1940 Allen Toussaint Blvd New Orleans, LA | 3.0 | 2.0 | 1500 | $1,550 | $1.03 | 11d | 1 | 0.76mi |
| 6202 Vermillion Blvd New Orleans, LA | 3.0 | 2.0 | 1200 | $1,700 | $1.42 | 15d | 1 | 0.77mi |
| 5024 Paris Ave New Orleans, LA | 4.0 | 3.0 | 2116 | $3,000 | $1.42 | 15d | 1 | 0.79mi |
| 6217 Curie St New Orleans, LA | 3.0 | 2.0 | 1700 | $1,500 | $0.88 | 23d | 1 | 0.80mi |
| 4767 Lafaye St New Orleans, LA | 3.0 | 2.0 | 1469 | $2,000 | $1.36 | 23d | 1 | 0.83mi |
| 5900 Chatham Dr New Orleans, LA | 3.0 | 2.0 | 1864 | $2,500 | $1.34 | 3d | 1 | 0.83mi |
| 4936 Baccich St New Orleans, LA | 3.0 | 1.0 | 1053 | $1,700 | $1.61 | 23d | 1 | 0.83mi |
| 3907 Elysian Fields Ave New Orleans, LA | 3.0 | 2.0 | 1652 | $3,000 | $1.82 | 23d | 1 | 0.90mi |
| 6329 Spain St New Orleans, LA | 3.0 | 2.0 | 1545 | $2,100 | $1.36 | 15d | 1 | 0.94mi |
| 2701 03 Frankfort St New Orleans, LA | 3.0 | 1.0 | 1100 | $1,850 | $1.68 | 23d | 1 | 1.10mi |
| 1486 Mandolin St New Orleans, LA | 3.0 | 2.0 | 1497 | $1,900 | $1.27 | 3d | 1 | 1.12mi |
| 3515 Saint Anthony Ave New Orleans, LA | 3.0 | 2.0 | 1366 | $2,500 | $1.83 | 23d | 1 | 1.17mi |
| 3624 Havana St New Orleans, LA | 3.0 | 1.0 | 1388 | $1,875 | $1.35 | 15d | 1 | 1.21mi |
| 3607 Havana St New Orleans, LA | 3.0 | 2.0 | 1693 | $1,488 | $0.88 | 16d | 1 | 1.22mi |
| 5550 Press Dr New Orleans, LA | 3.0 | 2.0 | 1640 | $2,000 | $1.22 | 15d | 1 | 1.22mi |
| 3540 Clermont Dr New Orleans, LA | 3.0 | 2.0 | 1248 | $1,975 | $1.58 | 23d | 1 | 1.25mi |
| 6416 Baccich St New Orleans, LA | 3.0 | 2.0 | 1908 | $2,500 | $1.31 | 43d | 1 | 1.26mi |
| 4727 Saint Bernard Ave New Orleans, LA | 3.0 | 2.0 | 2000 | $2,000 | $1.00 | 15d | 1 | 1.27mi |
| 4111 Jumonville St New Orleans, LA | 3.0 | 2.5 | 1543 | $2,300 | $1.49 | 10d | 1 | 1.27mi |
| 3327 Elysian Fields Ave New Orleans, LA | 3.0 | 1.0 | 1200 | $1,300 | $1.08 | 23d | 1 | 1.29mi |
| 2647 Myrtle St Unit 2647 New Orleans, LA | 4.0 | 2.0 | 1445 | $2,550 | $1.76 | 43d | 1 | 1.33mi |
| 4229 Buchanan St New Orleans, LA | 3.0 | 2.0 | 1235 | $2,250 | $1.82 | 23d | 1 | 1.34mi |
| 2509 Sage St New Orleans, LA | 3.0 | 1.0 | 1250 | $1,650 | $1.32 | 21d | 1 | 1.36mi |
Listing history 17 events
-
2026-06-18days on market $220,000 Active 143 DOM
-
2026-06-17days on market $220,000 Active 142 DOM
-
2026-06-16days on market $220,000 Active 141 DOM
-
2026-06-15days on market $220,000 Active 140 DOM
-
2026-06-13days on market $220,000 Active 138 DOM
-
2026-06-10days on market $220,000 Active 135 DOM
-
2026-06-09days on market $220,000 Active 134 DOM
-
2026-06-08days on market $220,000 Active 133 DOM
-
2026-06-07days on market $220,000 Active 132 DOM
-
2026-06-05days on market $220,000 Active 129 DOM
-
2026-06-03days on market $220,000 Active 128 DOM
-
2026-06-02days on market $220,000 Active 127 DOM
-
2026-06-01days on market $220,000 Active 126 DOM
-
2026-05-31days on market $220,000 Active 125 DOM
-
2026-01-26$220,000 Active 1284-char remark
Show marketing remark (1284 chars)
Now Available--This well-appointed Gentilly double offers comfortable, practical living in a convenient location and presents a flexible opportunity for both owner-occupants and investors. Call it home while the other unit helps offset your mortgage—or add it to your real estate investment portfolio. The property features two separate units—upstairs and downstairs—each with 2 independent bedrooms and 1 full bath, allowing for versatile use. Both units include a refrigerator and range/oven, with washer and dryer included. The upstairs unit also includes a dishwasher. Durable wood-look ceramic tile flooring throughout allows for easy maintenance—no carpet. Additional features include: Central air and heat for year-round comfort, separate water meters for each unit, independent bedrooms for added privacy, spacious backyard suitable for outdoor use. It is conveniently located near Elysian Fields Avenue and Filmore Avenue, offering easy access to University of New Orleans, Dillard University, and major thoroughfares including I-610, I-10, Lakeshore Drive, and Gentilly Boulevard. Schedule your showing today to explore this versatile Gentilly opportunity. The property is currently fully tenant-occupied so please allow 48-hour notice for showings.
-
1998-04-06soldstatus $53,500
-
1997-09-22$55,000
ⓘ Source: listings_history table (triggers on properties + properties_extension) + one-shot
backfill from property_details.listing_events for pre-trigger history.
Climate risk First Street
- Flood 8/10 Severe FEMA zone X (shaded) · 60% chance over 30 yrs
- Wildfire 1/10 Low
- Heat 10/10 Extreme 7 d/yr ≥108°F today · 21 d/yr by 30 yrs out
- Wind 10/10 Extreme 99% chance of damaging wind over 30 yrs
- Air quality 4/10 Moderate 4 unhealthy d/yr today · 4 by 30 yrs out
Nearby sold comps map
Loading sold comps map…
Walkable amenities ~0.75 mi
Loading nearby amenities…
Taxation est. · year 1
- Rental income
- $33,960
- − Mortgage interest
- −$12,323
- − Property taxes
- −$3,300
- − Insurance
- −$1,898
- − Repairs & maintenance
- −$2,717
- − Management
- −$2,717
- − Depreciation
- −$6,400
- Taxable income
- $4,605
- Est. tax owed @ 24.0%
- −$1,105
- After-tax cash flow
- $6,681/yr
For passive investors: Depreciation is non-cash, so a rental often shows a tax loss while cash-flowing — sheltering income. Rental losses are passive: they offset passive income freely, and up to $25,000/yr can offset ordinary (W-2) income if you actively participate and your MAGI is under $100k (phasing out to $0 by $150k); unused losses carry forward. On sale, claimed depreciation is recaptured at up to 25%, and gains may owe capital-gains tax (a 1031 exchange can defer both). Figures are a year-1 estimate at your 24.0% rate — not tax advice; consult a CPA.
Schools (NCES district)
- District
- Orleans Parish
- NCES district ID
- 2201170
- Math proficiency
- 11% ▼ -52.00%
- Reading proficiency
- 27% ▼ -46.00%
- Median HH income
- $37,011
- Composite
- 15.78/100
- National rank
- #9271
- State rank
- #69 of 98 in LA
Livability — New Orleans
- Score
- 81/100
- State rank
- #3
- US rank
- #1383
Category grades
Schools grade is shown separately in the Schools card above.
Census & demographics
- Census place
- New Orleans, LA
- County
- Orleans Parish · 338,817 people
- City population
- 338,817
- Metro
- New Orleans-Metairie, LA
- Population (ZIP)
- 35,253
- Household income
- $49,455
- Rent vs Own
- Severe rent burden
- 2150.0
Population outlook (Orleans County) Hauer SSP2
- Today (2025)
- 513,025 people
- By 2030
- 575,781 · +12.2%
- By 2040
- 700,174 · +36.5%
- By 2050
- 826,541 · +61.1%
- By 2075
- 1,123,374 · +119.0%
- By 2100
- 1,355,609 · +164.2%
Race, ethnicity, and origin ACS 2023
- Neighborhood character
- Predominantly Black (69%)
- Race & ethnicity
- Black 69% White 18% Two or more races 7% Hispanic / Latino 6% Asian 1%
- Hispanic origin (detail)
- Mexican 1%
- Common ancestry
- Lithuanian 4% Italian 2% Slovak 1%
- Foreign-born
- 4% · Canada, China
- Languages at home
- 92% English-only · Spanish 5% Chinese 1% French/Haitian/Cajun 1%
Political lean MEDSL · Orleans
- 2024 margin
- Solid D (+67.0) · D 82.2% · R 15.2% · Other 2.7%
- 2008→2024 swing
- +6.7pp toward D · 2008: 60.3pp · 2024: 67.0pp
- All cycles
- 2024: D+67.0 2020: D+68.2 2016: D+66.2 2012: D+62.5 2008: D+60.3
Not yet ingested
- Civics
- —
Market trends
- HPI YoY
- ▼ -222.37%
- Current HPI
- 231.9921
- Rent YoY
- ▼ -0.61%
- Metro
- New Orleans-Metairie, LA
- State GDP YoY
- ▲ 3.29%
- F500 in state
- 10
Industry mix (Fortune 500 HQ in LA)
| Industry | F500 HQs | Revenue |
|---|---|---|
| Telecommunications | 2 | $23B |
|
||
| Utilities | 1 | $12B |
|
||
| Wholesale / Distribution | 1 | $5B |
|
||
| Advertising | 1 | $2B |
|
||
Price history
+300.0% since first listed3 events — show timeline
- 2026-01-26 Listed $220,000 GSREIN
- 1998-04-06 Sold (MLS) $53,500 GSREIN
- 1997-09-22 Listed $55,000 GSREIN
Cash-flow waterfall
monthlySold comps — $/sqft
last 12 mo · ≤1 miLoading sold comps…