 Duplex
103 Diehl Ct Unit *** · Boiling Springs, SC
Flood risk 1/10 · Minimal
- FEMA flood zone
- X (unshaded)
- Chance of flooding over 30 yrs
- 0.0%
- Est. flood insurance / yr
- $507 – $1,088
Fire risk 4/10 · Minor
- Est. fire insurance / yr
- $783 – $1,453
Heat risk 6/10 · Moderate
- Hot days now (above 105°F)
- 7 days/yr
- Hot days in 30 yrs
- 17 days/yr
Wind risk 2/10 · Minimal
- Chance of severe wind over 30 yrs
- 2.0%
Air-quality risk 4/10 · Minor
- Unhealthy air days now
- 4 days/yr
- Unhealthy air days in 30 yrs
- 4 days/yr
Risk factors via First Street. Map © Google.
Why this score? — see what drove the C- grade
The composite is a weighted blend of 9 inputs, each scored 0–100. Each bar is that input's sub-score; the figure is the points it added to the 100-point composite (weight × sub-score).
- Cash flow +19.3/30.0
- ARV discount +7.5/15.0
- DSCR +6.1/10.0
- 1% rule +4.7/10.0
- Schools +4.5/10.0
- Livability +3.9/5.0
- Rent growth +2.7/5.0
- Condition / age +2.5/5.0
- Appreciation +0.0/10.0
$270,000
🖨 Deal sheet 📄 Offer letter ✓ Due diligence
Multi-family units
County records classify this as Multi-Family (2-4 Unit). Listing-text estimate: 2 units. confirmed
Listing remarks
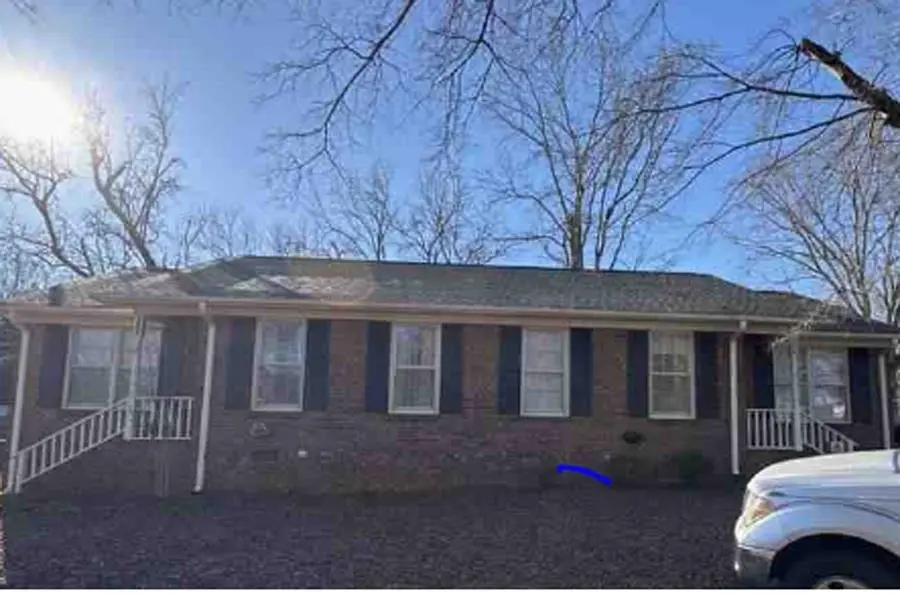
Investor Opportunity – Turnkey Duplex! Welcome to 103 Diehl Court in Boiling Springs— a well-maintained duplex. Each unit features 2 bedrooms and 1 full bathroom and one half baths, with approximately 933 square feet per side, providing comfortable and functional living space for tenants. Unit’s features include: central heat and air, dishwasher, patio, range, refrigerator, Storage, washer & dryer connections. Whether you're looking to expand your rental portfolio or step into your first investment property, this duplex offers strong income potential in a high-demand Boiling Springs rental area. Don’t miss your chance to own a great multi-family property in B
Key facts
- Storage
- Turnkey duplex
- Central heat and air
Tags
Property features AI
Finance
- Other: Lot approximately 0.4 acre (dimensions: 102 x 192 x 100 x 172); Zoned: County
- Financial info: Property used as residential income (duplex)
Exterior
- Utilities: Public water; Public sewer
- Home design: Duplex residential income property; One level
- Construction: Brick veneer construction
- Exterior features: Composition roof
Interior
- Heating & cooling: Central air; Heat pump (electric)
- Interior features: Electric water heater; Central air conditioning; Heat pump heating and cooling (electric)
Neighborhood map
What this means for you Summary
Snapshot
- This is a 2 × 2-bed/1.5-bath units multifamily listed at $270k.
Deal economics
- At list price, monthly cash flow is $296 ($4k/yr) — positive. Per door: $148/mo.
- The deal already cash-flows at list — no discount required.
- To meet the 1% rule (rent ≥ 1% of price), the offer needs to be $261k (3.4% below list).
- Recommended offer: $261k (3.4% below list) — sets the bar for 1% rule.
- Cap rate 7.6% vs local median 3.7% in Boiling Springs — top-decile yield for the area; either an underpriced asset or a hidden risk that comps aren't pricing in. Stress-test before assuming the spread holds.
Location & tenants
- Location reads 78/100 on livability (#17 in SC, #2,429 nationally) — a middle-class / working-renter tenant base. Strengths: cost of living A+, housing A+, health & safety A+; Watch: commute F.
- Spartanburg 02 (suburban): math 49% / reading 56% proficiency, ranked #6 of 80 in SC (top 8%) — acceptable for families but not a draw, mixed tenant base, ~2y average lease.
- Zoned schools: Boiling Springs Elementary (math 57% / reading 57%, grade C+, #102 of 597 statewide, top 18%, 886 students, 67% FRL); Rainbow Lake Middle (math 37% / reading 46%, grade F, #68 of 229 statewide, top 31%, 1,009 students, 69% FRL); Boiling Springs High (math 62% / reading 88%, grade A-, #37 of 196 statewide, top 18%, 2,671 students, 60% FRL) — zoned schools average 65% FRL vs 44% district-wide (21 pts higher); higher-poverty schools than district average — tighter screening recommended.
- Market conditions: Rents flat; 460 active listings in the ZIP; 7 comparable units currently listed for rent nearby; rentals at typical pace (median 21d on market — plan ~3-4 weeks tenant-placement turnaround); 3,129 units permitted in Spartanburg County in 2024 (40 in 5+ unit buildings).
- This rent runs 42% of the median local income ($75k/yr) — at the standard rent-burdened threshold; future hikes will face affordability resistance.
Forward outlook
- Local home prices are declining (-3.0%/yr); year-one equity from $2k of loan paydown is wiped out by about $8k of value loss. Plan a longer hold.
- Spartanburg County population projected at +18% by 2050 — long-run rental-demand tailwind backs the buy-and-hold thesis.
Negotiation context
- It's been on market 22 days — a 2% lower offer ($266k) is reasonable based on typical stale-listing flexibility.
Risks & watch-outs
- Climate carrying-cost: extreme-heat days projected 7→17/yr by 2055 (HVAC capex compounding) — expect insurance premiums to compound above CPI over the hold.
Questions for the listing agent
- Can we see the unit-by-unit rent roll, current vacancy, and any below-market leases? What's the average tenancy length?
- What capital expenditures (roof, boiler, parking lot, exteriors) have been made in the last 5 years, and what's planned in the next 2?
- Is there a deadline driving the sale (1031 exchange, divorce, estate, relocation)? That informs how much negotiation room exists.
- Schools are B-rated — typically a magnet for longer-tenancy family renters. What's the average tenant stay here, and is there a school-zone premium baked into asking?
- What's the average days-on-market for RENTAL listings here right now (not sales)? A rising rental-DOM trend means longer vacancies and softer asking-rent achievability than the comps imply.
- What's the recent tenant-quality profile in this submarket — average credit score on applications, eviction rate, late-payment / NSF rate, and stable-employment percentage? A property-management company in the area should have these aggregated.
- How much new apartment / multifamily construction is in the pipeline within 1–3 miles? Heavy new supply (>2% of stock underway) typically softens rents 12–24 months out; light construction supports rent growth.
Investment metrics
- 1% rule
- 0.97% ✗
- Cap rate
- 7.61%
- Cash-on-cash
- 4.70%
- DSCR
- 1.21
- GRM
- 8.6
CMA / ARV
No comps found within radius.
Projected returns pro-forma
-3.0% appreciation · 0.69% rent growth · sell at horizon
- IRR
- -11.5%
- Equity multiple
- 0.59×
- Total profit
- $-30,844
- Equity at exit
- $40,258
- IRR
- -5.9%
- Equity multiple
- 0.66×
- Total profit
- $-25,886
- Equity at exit
- $23,345
Cash invested: $75,600 (down + closing). Projections, not guarantees.
Landlord ↔ Tenant lean methodology
- Overall (STATE)
- 90 Strongly Landlord-Friendly
- State South Carolina
- 90 Strongly Landlord-Friendly · R+6
- County
- — inherits STATE
- City
- — inherits STATE
ZIP-level market 29316
- Home prices YoY
- -18.9%
- Rents YoY
- 0.7%
- Active inventory
- 460
- Price-to-rent
- 17.3×
Monthly cashflow live
- Estimated rent
- $2,608 medium interval (Pro) →
- Mortgage (P&I)
- −$1,416
- Tax from tax record
- −$236 /mo · $2,830/yr
- Insurance
- −$112
- HOA
- −$0
- Vacancy / Maint / Mgmt
- −$548
- Net cashflow
- $296
Break-even live
2-unit breakdown (identical units grouped — click to expand)
| Units | Beds | Baths | Est. rent |
|---|---|---|---|
| 2× units | 2 | 1.5 | $2,608 |
| #1 | 2 | 1.5 | $1,304 |
| #2 | 2 | 1.5 | $1,304 |
| Total (2 units) | $2,608 | ||
UW: 25.0% down · 7.5% · 30yr · 1.5% tax · 5.0% vac · 8.0% maint · 8.0% mgmt
Financing live
Cash to close
- Down payment
- $67,500
- Closing costs
- $8,100
- Reserves months
- —
- Total cash needed
- —
Loan-product check · same deal, 3 products live
Conventional
25% down · 7.5% · 30yr
- Down + closing
- —
- Monthly P&I
- —
- Monthly cashflow
- —
- DSCR
- —
- Eligible?
- —
Personal DTI + credit; lowest rate.
DSCR
20% down · 8.5% · 30yr
- Down + closing
- —
- Monthly P&I
- —
- Monthly cashflow
- —
- DSCR
- —
- Eligible?
- —
No personal income docs; deal must DSCR.
Hard money
10% down · 12.0% · 12mo
- Down + closing
- —
- Monthly P&I
- —
- Monthly cashflow
- —
- DSCR
- —
- Eligible?
- —
Short-term bridge; refi at stabilization.
Rent comps 7 comps
| Address | Beds | Baths | Sqft | Rent | $/sqft | DOM | Units | Dist |
|---|---|---|---|---|---|---|---|---|
| 257 Waxberry Ct Boiling Springs, SC | 3.0 | 2.0 | 1400 | $1,839 | $1.31 | 21d | 1 | 0.58mi |
| 318 Cool Embers Ln Boiling Springs, SC | 4.0 | 2.0 | 1646 | $1,906 | $1.16 | 13d | 1 | 0.67mi |
| 9103 Gabbro Ln Boiling Springs, SC | 1.0–3.0 | 1.0–2.5 | 1060 | $1,789 | $1.69 | 13d | 14 | 0.93mi |
| 1510 Painted Horse Trl Boiling Springs, SC | 3.0 | 2.5 | 1631 | $1,650 | $1.01 | 21d | 1 | 1.03mi |
| 584 Craftsman Ln Boiling Springs, SC | 3.0 | 2.5 | 1700 | $1,850 | $1.09 | 21d | 1 | 1.29mi |
| 4050 Parris Bridge Rd Boiling Springs, SC | 3.0 | 2.5 | 1460 | $1,695 | $1.16 | 21d | 1 | 1.41mi |
| 4050 Parris Bridge Rd Boiling Springs, SC | 3.0 | 2.5 | 1460 | $1,695 | $1.16 | 13d | 1 | 1.41mi |
Listing history 16 events
-
2026-06-18days on market $270,000 Active 22 DOM
-
2026-06-17days on market $270,000 Active 21 DOM
-
2026-06-16days on market $270,000 Active 20 DOM
-
2026-06-15days on market $270,000 Active 19 DOM
-
2026-06-14days on market $270,000 Active 17 DOM
-
2026-06-13days on market $270,000 Active 16 DOM
-
2026-06-10days on market $270,000 Active 14 DOM
-
2026-06-09days on market $270,000 Active 13 DOM
-
2026-06-08days on market $270,000 Active 12 DOM
-
2026-06-07days on market $270,000 Active 11 DOM
-
2026-06-05days on market $270,000 Active 8 DOM
-
2026-06-02days on market $270,000 Active 6 DOM
-
2026-06-01days on market $270,000 Active 5 DOM
-
2026-05-31days on market $270,000 Active 4 DOM
-
2026-05-30days on market $270,000 Active 3 DOM
-
2026-05-27$270,000 Active
ⓘ Source: listings_history table (triggers on properties + properties_extension) + one-shot
backfill from property_details.listing_events for pre-trigger history.
Tax reassessment forecast SC · Resets to sale price
- Current annual tax
- $2,830 · $236/mo
- Projected year-2 tax
- $2,830 · $236/mo
- Expected delta
- $0/yr ($0/mo · 0.0%)
ⓘ Screening estimate from a state-policy table — verify with the county assessor before closing.
Climate risk First Street
- Flood 1/10 Low FEMA zone X (unshaded) · 0% chance over 30 yrs
- Wildfire 4/10 Moderate
- Heat 6/10 Major 7 d/yr ≥105°F today · 17 d/yr by 30 yrs out
- Wind 2/10 Low 2% chance of damaging wind over 30 yrs
- Air quality 4/10 Moderate 4 unhealthy d/yr today · 4 by 30 yrs out
Nearby sold comps map
Loading sold comps map…
Walkable amenities ~0.75 mi
Loading nearby amenities…
Taxation est. · year 1
- Rental income
- $31,296
- − Mortgage interest
- −$15,124
- − Property taxes
- −$2,830
- − Insurance
- −$1,350
- − Repairs & maintenance
- −$2,504
- − Management
- −$2,504
- − Depreciation
- −$7,855
- Taxable loss
- −$870
- Est. tax savings @ 24.0%
- +$209
- After-tax cash flow
- $3,762/yr
For passive investors: Depreciation is non-cash, so a rental often shows a tax loss while cash-flowing — sheltering income. Rental losses are passive: they offset passive income freely, and up to $25,000/yr can offset ordinary (W-2) income if you actively participate and your MAGI is under $100k (phasing out to $0 by $150k); unused losses carry forward. On sale, claimed depreciation is recaptured at up to 25%, and gains may owe capital-gains tax (a 1031 exchange can defer both). Figures are a year-1 estimate at your 24.0% rate — not tax advice; consult a CPA.
Schools (NCES district)
- District
- Spartanburg 02
- NCES district ID
- 4503510
- Math proficiency
- 49% ▼ -7.00%
- Reading proficiency
- 56% ▲ 2.00%
- Median HH income
- $49,591
- Composite
- 44.79/100
- National rank
- #2742
- State rank
- #6 of 80 in SC
Livability — Boiling Springs
- Score
- 78/100
- State rank
- #17
- US rank
- #2429
Category grades
Schools grade is shown separately in the Schools card above.
Census & demographics
- Census place
- Boiling Springs, SC
- County
- Spartanburg County · 258,607 people
- City population
- 33,104
- Metro
- Spartanburg, SC
- Population (ZIP)
- 33,104
- Household income
- $74,735
- Rent vs Own
- Severe rent burden
- 524.0
Population outlook (Spartanburg County) Hauer SSP2
- Today (2025)
- 325,495 people
- By 2030
- 338,800 · +4.1%
- By 2040
- 363,471 · +11.7%
- By 2050
- 384,156 · +18.0%
- By 2075
- 430,137 · +32.1%
- By 2100
- 442,733 · +36.0%
Race, ethnicity, and origin ACS 2023
- Neighborhood character
- Predominantly White (72%)
- Race & ethnicity
- White 72% Black 15% Two or more races 6% Hispanic / Latino 5% Asian 4%
- Hispanic origin (detail)
- Mexican 3%
- Common ancestry
- Slovak 3% Subsaharan African 3% Scotch-Irish 2%
- Foreign-born
- 11% · Canada, Jamaica
- Languages at home
- 84% English-only · Russian/Polish/Slavic 7% Spanish 5% Other Asian/Pacific 2%
Political lean MEDSL · Spartanburg
- 2024 margin
- Solid R (+33.6) · D 32.6% · R 66.2% · Other 1.2%
- 2008→2024 swing
- -12.0pp toward R · 2008: -21.6pp · 2024: -33.6pp
- All cycles
- 2024: R+33.6 2020: R+27.3 2016: R+30.0 2012: R+23.1 2008: R+21.6
Not yet ingested
- Civics
- —
Market trends
- HPI YoY
- ▼ -51.42%
- Current HPI
- 220.8438
- Rent YoY
- ▲ 0.69%
- Metro
- Spartanburg, SC
- State GDP YoY
- ▲ 4.51%
- F500 in state
- 2
Industry mix (Fortune 500 HQ in SC)
| Industry | F500 HQs | Revenue |
|---|---|---|
| Packaging | 1 | $7B |
|
||
Price history
1 event — show timeline
- 2026-05-27 Listed $270,000 SPMLS
Property tax history
+2.6%/yrLatest (2025): $2,830 · +1.3% YoY. Source: county tax records.
Cash-flow waterfall
monthlySold comps — $/sqft
last 12 mo · ≤1 miLoading sold comps…