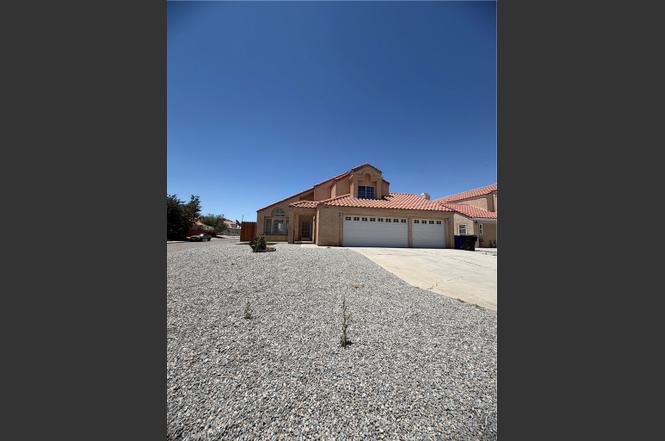
15268 San Jose · Victorville, CA
Flood risk 4/10 · Minor
- FEMA flood zone
- X (unshaded)
- Chance of flooding over 30 yrs
- 0.22%
- Est. flood insurance / yr
- $507 – $1,088
Fire risk 5/10 · Moderate
- Est. fire insurance / yr
- $659 – $1,223
Heat risk 7/10 · Major
- Hot days now (above 100°F)
- 2 days/yr
- Hot days in 30 yrs
- 5 days/yr
Wind risk 1/10 · Minimal
- Chance of severe wind over 30 yrs
- —
Air-quality risk 9/10 · Severe
- Unhealthy air days now
- 22 days/yr
- Unhealthy air days in 30 yrs
- 28 days/yr
Risk factors via First Street. Map © Google.
Why this score? — see what drove the C- grade
The composite is a weighted blend of 9 inputs, each scored 0–100. Each bar is that input's sub-score; the figure is the points it added to the 100-point composite (weight × sub-score).
- Cash flow +15.3/30.0
- ARV discount +15.0/15.0
- DSCR +4.7/10.0
- Rent growth +4.1/5.0
- 1% rule +3.4/10.0
- Livability +2.7/5.0
- Condition / age +2.5/5.0
- Appreciation +2.4/10.0
- Schools +2.2/10.0
$330,000
🖨 Deal sheet 📄 Offer letter ✓ Due diligence
Listing remarks MLS
Lots Of Extras In This Victorville Home. All Tile Kitchen W/ Breakfast Nook, Enclosed Patio W/ Spa. Fully Landscapedtriple Car Garage W/ Drive Thru To Rear. 4 Bedrooms, 3 Baths, 1 Bedroom Downstairs.
Key facts
- Convenient access
- Great bones
- Endless potential
Tags
Property features AI
Finance
- Other: Living area and lot size sourced from assessor; Parcel number available
- HOA & community: Curbs; Biking; Street lighting
Exterior
- Parking: Attached garage; 3 garage spaces; Driveway; Total 3 parking spaces
- Utilities: Public sewer; District/public water
- Home design: House; 2 stories; Entry level 1
- Construction: Tile roof; Built year per assessor; No common walls; Single-unit property
- Exterior features: Enclosed patio; Has patio; No pool; Paved roads; Has view; Lot features: 0-1 unit/acre
Interior
- Kitchen: Eating area
- Bedrooms: 4 bedrooms on the main level; Entry on level 1
- Bathrooms: 3 full bathrooms; Bathrooms with bathtub and shower
- Heating & cooling: Central cooling; Central furnace heating; Fireplace heating
- Interior features: Cathedral/vaulted ceilings; Two levels; Living room fireplace; Repairs cosmetic
- Laundry & utility: Laundry in garage; Has laundry
Neighborhood map
What this means for you Summary
Snapshot
- This is a 4-bed/3.0-bath single-family listed at $330k.
Deal economics
- At list price, monthly cash flow is $124 ($1k/yr) — positive.
- The deal already cash-flows at list — no discount required.
- To meet the 1% rule (rent ≥ 1% of price), the offer needs to be $276k (16.5% below list).
- Recommended offer: $276k (16.5% below list) — sets the bar for 1% rule.
- Cap rate 6.7% vs local median 4.2% in Victorville — top-decile yield for the area; either an underpriced asset or a hidden risk that comps aren't pricing in. Stress-test before assuming the spread holds.
Location & tenants
- Location reads 54/100 on livability (#906 in CA) — a working-class tenant base; expect higher turnover. Strengths: housing A+; Watch: employment D+, schools D-, crime F.
- Victor Elementary (urban): math 25% / reading 25% proficiency, ranked #408 of 517 in CA (top 79%) — low school quality limits family demand, transient renter base, plan for 1-2y turnover; 70% free/reduced lunch — lower-income household profile, screen leases tightly.
- Market conditions: Rents rising fast (+6.5%/yr); 166 active listings in the ZIP; 16 comparable units currently listed for rent nearby; rentals leasing fast (median 2d on market — plan ~1-2 weeks tenant-placement turnaround); solid renter incomes; 5,458 units permitted in San Bernardino County in 2024 (1,500 in 5+ unit buildings).
- This rent runs 42% of the median local income ($78k/yr) — at the standard rent-burdened threshold; future hikes will face affordability resistance.
Forward outlook
- Local home prices are declining (-3.0%/yr); year-one equity from $2k of loan paydown is wiped out by about $10k of value loss. Plan a longer hold.
- San Bernardino County population projected at +15% by 2050 — modest demand growth; plan on rents tracking national, not racing it.
Negotiation context
- Only 2 days on market — expect competitive offers; lowballing is unlikely to land.
- Current owner paid $194k; list at $330k implies a 70% gain — meaningful room to come down on a strong offer.
Risks & watch-outs
- Climate carrying-cost: moderate wildfire risk; extreme-heat days projected 2→5/yr by 2055 (HVAC capex compounding) — expect insurance premiums to compound above CPI over the hold.
Questions for the listing agent
- Is there a deadline driving the sale (1031 exchange, divorce, estate, relocation)? That informs how much negotiation room exists.
- Schools are D-rated, which usually means shorter tenancies and higher turnover. Who's the typical renter profile here, and what's been the actual vacancy rate?
- Crime grade is F in this area — have there been break-ins, vandalism, or insurance claims at this property in the last 3 years? What carrier currently insures it and at what premium?
- What's the average days-on-market for RENTAL listings here right now (not sales)? A rising rental-DOM trend means longer vacancies and softer asking-rent achievability than the comps imply.
- What's the recent tenant-quality profile in this submarket — average credit score on applications, eviction rate, late-payment / NSF rate, and stable-employment percentage? A property-management company in the area should have these aggregated.
- How much new for-sale + rental construction is in the pipeline within 1–3 miles? Heavy new supply typically softens prices + rents 12–24 months out; constrained supply supports both.
Investment metrics
- 1% rule
- 0.84% ✗
- Cap rate
- 6.74%
- Cash-on-cash
- 1.61%
- DSCR
- 1.07
- GRM
- 10.0
CMA / ARV
- ARV (on-the-fly)
- $455,280
- Comps found
- 12
Show comp detail 12 sales within ~0.75 mi
| Address | Dist | Beds/Ba | Sqft | Sold | Price | $/sf | Match |
|---|---|---|---|---|---|---|---|
| 15151 Desert Oak | 0.27mi | 4/2.0 | 1,831 (-4%) | 0mo | $455,000 | $248 | 77 |
| 15376 San Miguel Way | 0.22mi | 4/3.0 | 2,019 (+6%) | 5mo | $427,000 | $211 | 75 |
| 15168 Dakota | 0.14mi | 4/2.0 | 1,730 (-9%) | 1mo | $360,000 | $208 | 74 |
| 15576 War Arrow | 0.40mi | 4/2.0 | 1,809 (-5%) | 1mo | $432,000 | $239 | 68 |
| 15587 Great Spirit St | 0.41mi | 5/2.0 (+1) | 1,963 (+4%) | 2mo | $420,000 | $214 | 65 |
| 15208 Indian Springs Dr | 0.49mi | 3/2.0 (-1) | 1,831 (-4%) | 1mo | $430,000 | $235 | 61 |
| 15021-15021 Highlander | 0.52mi | 4/3.0 | 1,767 (-7%) | 8mo | $435,000 | $246 | 58 |
| 15413 Burwood Rd | 0.60mi | 4/2.0 | 1,810 (-5%) | 3mo | $485,000 | $268 | 58 |
| 15536 Jojoba | 0.39mi | 4/2.0 | 1,648 (-13%) | 2mo | $310,000 | $188 | 54 |
| 14747 Saguaro St | 0.36mi | 4/2.0 | 1,648 (-13%) | 6mo | $395,000 | $240 | 52 |
| 15488 Jojoba Ln | 0.38mi | 4/2.0 | 1,648 (-13%) | 8mo | $415,000 | $252 | 50 |
| 15400 Don Roberto Rd | 0.72mi | 4/3.0 | 1,752 (-8%) | 8mo | $435,000 | $248 | 47 |
Match score weights: distance 35% · size 25% · config 20% · recency 20%. Top-matched comps best support the ARV.
Projected returns pro-forma
-3.0% appreciation · 6.46% rent growth · sell at horizon
- IRR
- -10.3%
- Equity multiple
- 0.61×
- Total profit
- $-35,770
- Equity at exit
- $49,204
- IRR
- 2.9%
- Equity multiple
- 1.24×
- Total profit
- $22,334
- Equity at exit
- $28,532
Cash invested: $92,400 (down + closing). Projections, not guarantees.
Landlord ↔ Tenant lean methodology
- Overall (STATE)
- 18 Strongly Tenant-Friendly
- State California
- 18 Strongly Tenant-Friendly · D+13
- County
- — inherits STATE
- City
- — inherits STATE
ZIP-level market 92394
- Home prices YoY
- -1.3%
- Rents YoY
- 6.5%
- Active inventory
- 166
- Price-to-rent
- 10.0×
Monthly cashflow live
- Estimated rent
- $2,756 high interval (Pro) →
- Mortgage (P&I)
- −$1,731
- Tax from tax record
- −$185 /mo · $2,222/yr
- Insurance
- −$138
- HOA
- −$0
- Vacancy / Maint / Mgmt
- −$579
- Net cashflow
- $124
Break-even live
UW: 25.0% down · 7.5% · 30yr · 1.5% tax · 5.0% vac · 8.0% maint · 8.0% mgmt
Financing live
Cash to close
- Down payment
- $82,500
- Closing costs
- $9,900
- Reserves months
- —
- Total cash needed
- —
Loan-product check · same deal, 3 products live
Conventional
25% down · 7.5% · 30yr
- Down + closing
- —
- Monthly P&I
- —
- Monthly cashflow
- —
- DSCR
- —
- Eligible?
- —
Personal DTI + credit; lowest rate.
DSCR
20% down · 8.5% · 30yr
- Down + closing
- —
- Monthly P&I
- —
- Monthly cashflow
- —
- DSCR
- —
- Eligible?
- —
No personal income docs; deal must DSCR.
Hard money
10% down · 12.0% · 12mo
- Down + closing
- —
- Monthly P&I
- —
- Monthly cashflow
- —
- DSCR
- —
- Eligible?
- —
Short-term bridge; refi at stabilization.
Rent comps 16 comps
| Address | Beds | Baths | Sqft | Rent | $/sqft | DOM | Units | Dist |
|---|---|---|---|---|---|---|---|---|
| 14929 Flagstaff Ct Victorville, CA | 4.0 | 3.0 | 2019 | $2,350 | $1.16 | 1d | 1 | 0.26mi |
| 15191 Wildrose St Victorville, CA | 3.0 | 2.0 | 1500 | $2,400 | $1.60 | 10d | 1 | 0.38mi |
| 14861 Ann Dr Victorville, CA | 3.0 | 3.0 | 1657 | $2,395 | $1.45 | 1d | 1 | 0.68mi |
| 14600 Rosemary Dr Victorville, CA | 4.0 | 2.5 | 2334 | $3,000 | $1.29 | 10d | 1 | 0.80mi |
| 14304 Gray Fox Ln Victorville, CA | 3.0 | 2.5 | 1795 | $2,600 | $1.45 | 15d | 1 | 1.00mi |
| 15083 Brown Ln Victorville, CA | 4.0 | 2.0 | 1842 | $2,150 | $1.17 | 1d | 1 | 1.00mi |
| 15112 Brown Ln Victorville, CA | 3.0 | 2.0 | 1400 | $850 | $0.61 | 1d | 1 | 1.04mi |
| 15338 Baxter St Victorville, CA | 5.0 | 3.5 | 2460 | $2,800 | $1.14 | 10d | 1 | 1.16mi |
| 14979 Buckskin Rd Victorville, CA | 3.0 | 2.0 | 1277 | $2,250 | $1.76 | 1d | 1 | 1.16mi |
| 14373 Lorado Way Victorville, CA | 4.0 | 2.0 | 1858 | $2,900 | $1.56 | 1d | 1 | 1.19mi |
| 14610 Green River Rd Victorville, CA | 3.0 | 2.5 | 1493 | $2,595 | $1.74 | 1d | 1 | 1.20mi |
| 14073 Mare Ln Victorville, CA | 4.0 | 2.5 | 1954 | $2,290 | $1.17 | 1d | 1 | 1.24mi |
| 16315 Orick Ave Victorville, CA | 4.0 | 2.5 | 1977 | $3,300 | $1.67 | 1d | 1 | 1.34mi |
| 13998 Old Mill Ln Victorville, CA | 4.0 | 2.0 | 2001 | $2,850 | $1.42 | 1d | 1 | 1.34mi |
| 15558 Del Rey Dr Victorville, CA | 4.0 | 3.0 | 1905 | $2,300 | $1.21 | 1d | 1 | 1.43mi |
| 16413 Solvang Ave Victorville, CA | 3.0 | 2.0 | 1410 | $2,000 | $1.42 | 1d | 1 | 1.46mi |
Listing history 3 events
-
2026-06-18days on market $330,000 Active 2 DOM
-
2026-06-17remarks 601-char remark
-
2026-06-17$330,000 Active 1 DOM
ⓘ Source: listings_history table (triggers on properties + properties_extension) + one-shot
backfill from property_details.listing_events for pre-trigger history.
Tax reassessment forecast CA · Resets to sale price
- Current annual tax
- $2,222 · $185/mo
- Projected year-2 tax
- $2,508 · $209/mo
- Expected delta
- +$286/yr (+$24/mo · 12.9%)
ⓘ Screening estimate from a state-policy table — verify with the county assessor before closing.
Climate risk First Street
- Flood 4/10 Moderate FEMA zone X (unshaded) · 22% chance over 30 yrs
- Wildfire 5/10 Major
- Heat 7/10 Severe 2 d/yr ≥100°F today · 5 d/yr by 30 yrs out
- Wind 1/10 Low
- Air quality 9/10 Extreme 22 unhealthy d/yr today · 28 by 30 yrs out
Nearby sold comps map
Loading sold comps map…
Walkable amenities ~0.75 mi
Loading nearby amenities…
Taxation est. · year 1
- Rental income
- $33,067
- − Mortgage interest
- −$18,485
- − Property taxes
- −$2,222
- − Insurance
- −$1,650
- − Repairs & maintenance
- −$2,645
- − Management
- −$2,645
- − Depreciation
- −$9,600
- Taxable loss
- −$4,181
- Est. tax savings @ 24.0%
- +$1,003
- After-tax cash flow
- $2,488/yr
For passive investors: Depreciation is non-cash, so a rental often shows a tax loss while cash-flowing — sheltering income. Rental losses are passive: they offset passive income freely, and up to $25,000/yr can offset ordinary (W-2) income if you actively participate and your MAGI is under $100k (phasing out to $0 by $150k); unused losses carry forward. On sale, claimed depreciation is recaptured at up to 25%, and gains may owe capital-gains tax (a 1031 exchange can defer both). Figures are a year-1 estimate at your 24.0% rate — not tax advice; consult a CPA.
Schools (NCES district)
- District
- Victor Elementary
- NCES district ID
- 0641040
- Math proficiency
- 25% ▬ 0.00%
- Reading proficiency
- 25% ▼ -9.00%
- Median HH income
- $44,949
- Composite
- 21.58/100
- National rank
- #8304
- State rank
- #408 of 517 in CA
Livability — Victorville
- Score
- 54/100
- State rank
- #906
- US rank
- #24038
Category grades
Schools grade is shown separately in the Schools card above.
Census & demographics
- Census place
- Victorville, CA
- County
- San Bernardino County · 2,030,291 people
- City population
- 154,418
- Metro
- Riverside-San Bernardino-Ontario, CA
- Population (ZIP)
- 41,614
- Household income
- $78,466
- Rent vs Own
- Severe rent burden
- 1485.0
Population outlook (San Bernardino County) Hauer SSP2
- Today (2025)
- 2,300,329 people
- By 2030
- 2,378,907 · +3.4%
- By 2040
- 2,523,137 · +9.7%
- By 2050
- 2,642,388 · +14.9%
- By 2075
- 2,880,769 · +25.2%
- By 2100
- 2,909,436 · +26.5%
Race, ethnicity, and origin ACS 2023
- Neighborhood character
- Diverse neighborhood (Simpson 0.61)
- Race & ethnicity
- Hispanic / Latino 57% Two or more races 24% Black 20% White 15% Asian 4% Native American 2%
- Hispanic origin (detail)
- Mexican 44% Puerto Rican 1%
- Common ancestry
- Italian 1% Romanian 1% Lithuanian 1%
- Foreign-born
- 20% · Canada, South Korea
- Languages at home
- 58% English-only · Spanish 38% Tagalog/Filipino 2% Arabic 1%
Political lean MEDSL · San Bernardino
- 2024 margin
- Toss-up / Even · D 47.5% · R 49.7% · Other 2.8%
- 2008→2024 swing
- -8.5pp toward R · 2008: 6.3pp · 2024: -2.1pp
- All cycles
- 2024: R+2.1 2020: D+10.7 2016: D+9.8 2012: D+5.4 2008: D+6.3
Not yet ingested
- Civics
- —
Market trends
- HPI YoY
- ▼ -5.17%
- Current HPI
- 384.3185
- Rent YoY
- ▲ 6.46%
- Metro
- Riverside-San Bernardino-Ontario, CA
- State GDP YoY
- ▲ 3.21%
- F500 in state
- 116
Industry mix (Fortune 500 HQ in CA)
| Industry | F500 HQs | Revenue |
|---|---|---|
| Technology | 27 | $1,492B |
|
||
| Financial Services | 3 | $174B |
|
||
| Retail | 3 | $44B |
|
||
| Insurance | 3 | $26B |
|
||
| Media / Entertainment | 2 | $115B |
|
||
| Pharmaceuticals / Biotech | 2 | $62B |
|
||
Price history
+175.0% since first listed4 events — show timeline
- 2026-06-16 Listed $330,000 CRMLS
- 2004-07-27 Sold (Public Records) $194,000 Public Records
- 2001-02-09 Sold (Public Records) $120,000 Public Records
- 2001-02-09 Sold (MLS) $120,000 CRMLS
Property tax history
+2.3%/yrLatest (2025): $2,222 · +6.9% YoY. Source: county tax records.
Cash-flow waterfall
monthlySold comps — $/sqft
last 12 mo · ≤1 miLoading sold comps…