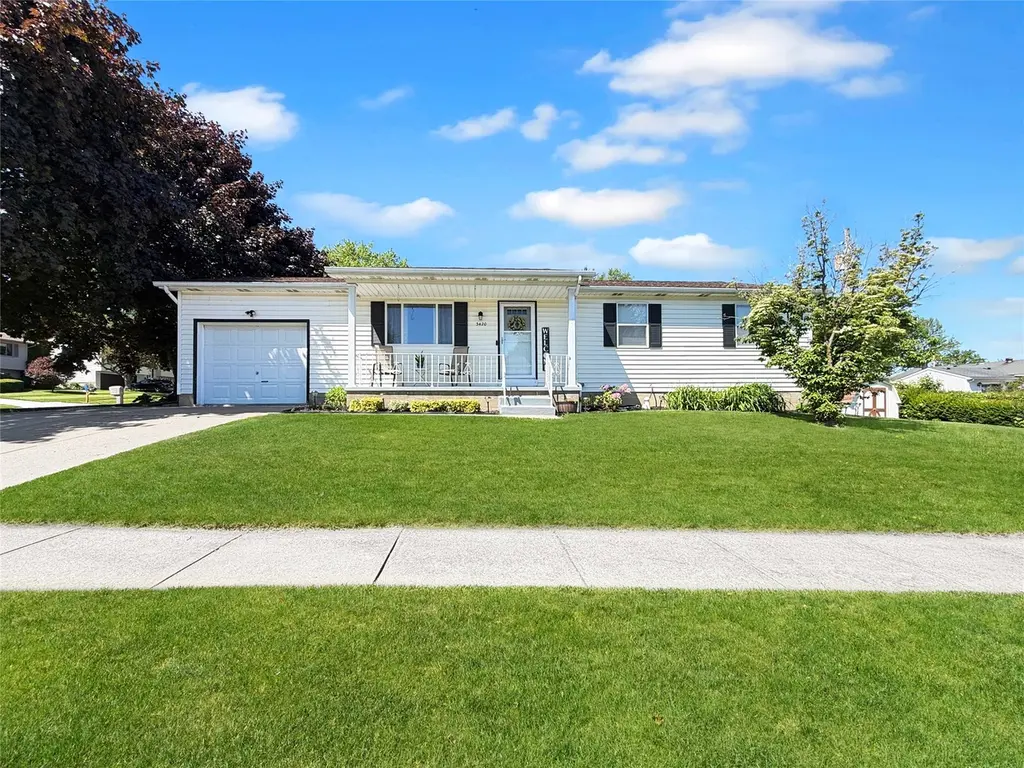
3420 Debra Dr · Erie, PA
Flood risk 1/10 · Minimal
- FEMA flood zone
- X (unshaded)
- Chance of flooding over 30 yrs
- 0.0%
- Est. flood insurance / yr
- $473 – $860
Fire risk 1/10 · Minimal
- Est. fire insurance / yr
- $511 – $949
Heat risk 2/10 · Minimal
- Hot days now (above 90°F)
- 7 days/yr
- Hot days in 30 yrs
- 17 days/yr
Wind risk 1/10 · Minimal
- Chance of severe wind over 30 yrs
- —
Air-quality risk 2/10 · Minimal
- Unhealthy air days now
- 1 days/yr
- Unhealthy air days in 30 yrs
- 3 days/yr
Risk factors via First Street. Map © Google.
Why this score? — see what drove the F grade
The composite is a weighted blend of 9 inputs, each scored 0–100. Each bar is that input's sub-score; the figure is the points it added to the 100-point composite (weight × sub-score).
- Cash flow +12.7/30.0
- Schools +4.8/10.0
- Livability +4.2/5.0
- DSCR +3.8/10.0
- 1% rule +3.5/10.0
- Rent growth +2.5/5.0
- Condition / age +2.5/5.0
- ARV discount +0.1/15.0
- Appreciation +0.0/10.0
$241,000
🖨 Deal sheet (PDF) 📄 Offer letter ✓ Due diligence
Listing remarks MLS
METICULOUSLY CARED FOR IN GREAT LOCATION!CAREFREE & EASY ONE FLOOR LIVING. PLASTER CEILINGS AND WALLS THROUGHOUT THE HOME. THE KITCHEN IS FULLY APPLIANCED AND ROOM FOR A SMALL TABLE. SPACIOUS ROOMS WITH AMPLE CLOSET SPACE. CONVENIENT FIRST FLOOR LAUNDRY. COVERED FRONT PATIO AND AN AWNING FOR BACK PATIO. NICE SIDE YARD WITH SHED. INCLUDES SHELVING IN BASEMENT AND EXTRA REFRIGERATOR. UPDATED ROOF AND A/C THREE YEARS AGO, WATER TANK, SLIDING DOOR IN 2016. HURRY AND CALL NOW FOR AN APPOINTMENT!
Key facts
- Lower level bathroom
- Paver stone patio
- First floor laundry
Tags
Property features AI
Finance
- HOA & community: Sidewalks in the neighborhood
Exterior
- Parking: Attached garage with garage door opener (1 car)
- Utilities: Public water; Public sewer; Cable available; Natural gas available
- Home design: Single-family residence; One level; Corner lot, landscaped; Paved road access; R-1 zoning
- Construction: Vinyl siding; Composition roof
- Exterior features: Covered patio; Storage shed(s)
Interior
- Kitchen: Dishwasher; Electric oven; Electric range; Microwave; Refrigerator; Disposal
- Bedrooms: Total rooms: 9
- Flooring: Carpet; Vinyl
- Bathrooms: 2 full bathrooms
- Heating & cooling: Forced-air heating; Central air conditioning
- Interior features: Ceiling fans; Window coverings and drapes; Full unfinished basement
- Laundry & utility: Electric dryer hookup
Neighborhood map
What this means for you Summary
Snapshot
- This is a 3-bed/1.0-bath single-family listed at $241k.
Deal economics
- At list price, monthly cash flow is $-29 ($-343/yr) — negative.
- To cash-flow at today's rent, offer at most $236k (2.1% below list).
- To meet the 1% rule (rent ≥ 1% of price), the offer needs to be $205k (15.0% below list).
- Recommended offer: $205k (15.0% below list) — sets the bar for 1% rule.
Location & tenants
- Location reads 83/100 on livability (#109 in PA, #840 nationally) — a professional / high-income tenant draw. Strengths: amenities A+, commute A+, cost of living A+; Watch: crime D+, employment F.
- Millcreek Township SD (suburban): math 46% / reading 65% proficiency, ranked #105 of 539 in PA (top 20%) — acceptable for families but not a draw, mixed tenant base, ~2y average lease.
- Zoned schools: Grandview El Sch (math 55% / reading 69%, grade B, #313 of 1,518 statewide, top 24%, 659 students, 46% FRL); Walnut Creek Ms (math 43% / reading 72%, grade B, #61 of 512 statewide, top 13%, 449 students, 31% FRL); Mcdowell Hs (math 76% / reading 50%, grade B-, #72 of 437 statewide, top 16%, 2,205 students, 40% FRL).
- Market conditions: 99 active listings in the ZIP; 8 comparable units currently listed for rent nearby; rentals lingering (median 46d on market — plan ~5-8 weeks vacancy on turnover, expect pricing pressure); 100% of comp listings sitting > 30 days — soft ceiling on asking rent; solid renter incomes; 364 units permitted in Erie County in 2024 (188 in 5+ unit buildings).
- This rent runs 30% of the median local income ($81k/yr) — at the standard rent-burdened threshold; future hikes will face affordability resistance.
Forward outlook
- Local home prices are declining (-3.0%/yr); year-one equity from $2k of loan paydown is wiped out by about $7k of value loss. Plan a longer hold.
- Erie County population projected at -14% by 2050 — secular population decline; favor cash flow + early exit over multi-decade hold.
Negotiation context
- Only 3 days on market — expect competitive offers; lowballing is unlikely to land.
- 2 sale attempts since 9y ago with the ask held roughly flat each time — persistent listings suggest the price (not the market) is what's stuck; bring a comps-based counter.
- Current owner paid $131k; list at $241k implies a 84% gain — meaningful room to come down on a strong offer.
Questions for the listing agent
- What do current leases actually rent for vs. the listed asking? Can we see a recent rent roll and the last 12 months of T-12 income?
- Is there a deadline driving the sale (1031 exchange, divorce, estate, relocation)? That informs how much negotiation room exists.
- Crime grade is D in this area — have there been break-ins, vandalism, or insurance claims at this property in the last 3 years? What carrier currently insures it and at what premium?
- The area grade is low — what's the realistic commute time and amenity access for the typical tenant pool here? Any planned neighborhood developments (good or bad) we should know about?
- What's the average days-on-market for RENTAL listings here right now (not sales)? A rising rental-DOM trend means longer vacancies and softer asking-rent achievability than the comps imply.
- What's the recent tenant-quality profile in this submarket — average credit score on applications, eviction rate, late-payment / NSF rate, and stable-employment percentage? A property-management company in the area should have these aggregated.
- How much new for-sale + rental construction is in the pipeline within 1–3 miles? Heavy new supply typically softens prices + rents 12–24 months out; constrained supply supports both.
Investment metrics
- 1% rule
- 0.85% ✗
- Cap rate
- 6.15%
- Cash-on-cash
- -0.51%
- DSCR
- 0.98
- GRM
- 9.8
CMA / ARV
- ARV (on-the-fly)
- $207,064
- Comps found
- 12
Show comp detail 12 sales within ~0.75 mi
| Address | Dist | Beds/Ba | Sqft | Sold | Price | $/sf | Match |
|---|---|---|---|---|---|---|---|
| 3001 Highland Rd | 0.54mi | 3/1.0 | 1,139 (-0%) | 1mo | $240,000 | $211 | 74 |
| 2408 W 36th St | 0.48mi | 3/1.5 | 1,114 (-3%) | 3mo | $279,900 | $251 | 68 |
| 4041 Calico Dr | 0.43mi | 3/2.0 | 1,167 (+2%) | 6mo | $275,000 | $236 | 68 |
| 3159 Aberdeen Ave | 0.45mi | 3/2.0 | 1,172 (+2%) | 6mo | $180,000 | $154 | 65 |
| 2901 Legion Rd | 0.34mi | 4/2.0 (+1) | 1,104 (-4%) | 6mo | $200,000 | $181 | 64 |
| 3025 Berkley Rd | 0.46mi | 3/2.0 | 1,206 (+5%) | 5mo | $175,000 | $145 | 62 |
| 2845 W 31st St | 0.25mi | 3/2.0 | 1,304 (+14%) | 1mo | $219,900 | $169 | 60 |
| 3723 Court Ave | 0.75mi | 3/1.0 | 1,162 (+2%) | 7mo | $85,000 | $73 | 57 |
| 3012 Bement St | 0.59mi | 4/2.0 (+1) | 1,140 (-0%) | 8mo | $250,000 | $219 | 56 |
| 2653 W 25th St | 0.62mi | 3/1.0 | 1,253 (+10%) | 4mo | $170,000 | $136 | 51 |
| 3002 Bement St | 0.60mi | 2/2.0 (-1) | 1,200 (+5%) | 7mo | $195,000 | $163 | 49 |
| 3118 Greeley Ave | 0.40mi | 4/2.0 (+1) | 1,298 (+14%) | 4mo | $285,000 | $220 | 46 |
Match score weights: distance 35% · size 25% · config 20% · recency 20%. Top-matched comps best support the ARV.
Projected returns pro-forma
-3.0% appreciation · 3.0% rent growth · sell at horizon
- IRR
- -17.1%
- Equity multiple
- 0.39×
- Total profit
- $-40,855
- Equity at exit
- $35,934
- IRR
- -9.1%
- Equity multiple
- 0.44×
- Total profit
- $-37,842
- Equity at exit
- $20,837
Cash invested: $67,480 (down + closing). Projections, not guarantees.
Landlord ↔ Tenant lean methodology
- Overall (STATE)
- 62 Landlord-Friendly
- State Pennsylvania
- 62 Landlord-Friendly · EVEN
- County
- — inherits STATE
- City
- — inherits STATE
ZIP-level market 16506
- Active inventory
- 99
- Price-to-rent
- 9.8×
Monthly cashflow live
- Estimated rent
- $2,049 high interval (Pro) →
- Mortgage (P&I)
- −$1,264
- Tax from tax record
- −$283 /mo · $3,398/yr
- Insurance
- −$100
- HOA
- −$0
- Vacancy / Maint / Mgmt
- −$430
- Net cashflow
- $-29
Break-even live
Sensitivity live
| Price | -10% $108 | -5% $40 | +0% $-29 | +5% $-97 | +10% $-165 |
|---|---|---|---|---|---|
| Rent | -10% $-190 | -5% $-110 | +0% $-29 | +5% $52 | +10% $133 |
| Rate | -1.0pp $93 | -0.5pp $33 | base $-29 | +0.5pp $-91 | +1.0pp $-155 |
UW: 25.0% down · 7.5% · 30yr · 1.5% tax · 5.0% vac · 8.0% maint · 8.0% mgmt
Financing live
Cash to close
- Down payment
- $60,250
- Closing costs
- $7,230
- Reserves months
- —
- Total cash needed
- —
Loan-product check · same deal, 3 products live
Conventional
25% down · 7.5% · 30yr
- Down + closing
- —
- Monthly P&I
- —
- Monthly cashflow
- —
- DSCR
- —
- Eligible?
- —
Personal DTI + credit; lowest rate.
DSCR
20% down · 8.5% · 30yr
- Down + closing
- —
- Monthly P&I
- —
- Monthly cashflow
- —
- DSCR
- —
- Eligible?
- —
No personal income docs; deal must DSCR.
Hard money
10% down · 12.0% · 12mo
- Down + closing
- —
- Monthly P&I
- —
- Monthly cashflow
- —
- DSCR
- —
- Eligible?
- —
Short-term bridge; refi at stabilization.
Rent comps 8 comps
| Address | Beds | Baths | Sqft | Rent | $/sqft | DOM | Units | Dist |
|---|---|---|---|---|---|---|---|---|
| 2857 Willowood Dr Unit 2901 Erie, PA | 2.0 | 1.5 | 1300 | $1,750 | $1.35 | 45d | 1 | 0.16mi |
| 4024 Canterbury Dr Erie, PA | 2.0 | 1.5 | 1044 | $1,350 | $1.29 | 45d | 1 | 0.53mi |
| 3158 W 40th St Erie, PA | 2.0 | 2.0 | 1024 | $1,280 | $1.25 | 45d | 1 | 0.57mi |
| 4500 Hammocks Dr Erie, PA | 2.0–3.0 | 2.0 | 1312 | $3,270 | $2.49 | 45d | 7 | 0.63mi |
| 4536 Hammocks Dr Unit 542401 Erie, PA | 2.0 | 2.0 | 1327 | $2,160 | $1.63 | 45d | 1 | 0.66mi |
| 4536 Hammocks Dr Unit 536404 Erie, PA | 3.0 | 2.0 | 1416 | $2,290 | $1.62 | 45d | 1 | 0.66mi |
| 4536 Hammocks Dr Unit 536204 Erie, PA | 3.0 | 2.0 | 1416 | $2,275 | $1.61 | 45d | 1 | 0.66mi |
| 2412 Powell Ave Erie, PA | 3.0 | 2.0 | 1500 | $1,550 | $1.03 | 45d | 1 | 1.49mi |
Listing history 3 events
-
2026-06-08status $241,000 Pending 3 DOM
-
2026-06-07remarks 699-char remark
-
2026-06-07$241,000 Active 3 DOM
ⓘ Source: listings_history table (triggers on properties + properties_extension) + one-shot
backfill from property_details.listing_events for pre-trigger history.
Tax reassessment forecast PA · Partial reset (capped growth)
- Current annual tax
- $3,398 · $283/mo
- Projected year-2 tax
- $3,603 · $300/mo
- Expected delta
- +$205/yr (+$17/mo · 6.0%)
ⓘ Screening estimate from a state-policy table — verify with the county assessor before closing.
Climate risk First Street
- Flood 1/10 Low FEMA zone X (unshaded) · 0% chance over 30 yrs
- Wildfire 1/10 Low
- Heat 2/10 Low 7 d/yr ≥90°F today · 17 d/yr by 30 yrs out
- Wind 1/10 Low
- Air quality 2/10 Low 1 unhealthy d/yr today · 3 by 30 yrs out
Nearby sold comps map
Loading sold comps map…
Walkable amenities ~0.75 mi
Loading nearby amenities…
Taxation est. · year 1
- Rental income
- $24,590
- − Mortgage interest
- −$13,500
- − Property taxes
- −$3,398
- − Insurance
- −$1,205
- − Repairs & maintenance
- −$1,967
- − Management
- −$1,967
- − Depreciation
- −$7,011
- Taxable loss
- −$4,459
- Est. tax savings @ 24.0%
- +$1,070
- After-tax cash flow
- $727/yr
For passive investors: Depreciation is non-cash, so a rental often shows a tax loss while cash-flowing — sheltering income. Rental losses are passive: they offset passive income freely, and up to $25,000/yr can offset ordinary (W-2) income if you actively participate and your MAGI is under $100k (phasing out to $0 by $150k); unused losses carry forward. On sale, claimed depreciation is recaptured at up to 25%, and gains may owe capital-gains tax (a 1031 exchange can defer both). Figures are a year-1 estimate at your 24.0% rate — not tax advice; consult a CPA.
Schools (NCES district)
- District
- Millcreek Township SD
- NCES district ID
- 4215330
- Math proficiency
- 46% ▼ -13.00%
- Reading proficiency
- 65% ▼ -9.00%
- Median HH income
- $55,734
- Composite
- 47.82/100
- National rank
- #2224
- State rank
- #105 of 539 in PA
Livability — Erie
- Score
- 83/100
- State rank
- #109
- US rank
- #840
Category grades
Schools grade is shown separately in the Schools card above.
Census & demographics
- County
- Erie County · 92,215 people
- City population
- 92,215
- Metro
- Erie, PA
- Population (ZIP)
- 24,070
- Household income
- $81,060
- Rent vs Own
- Severe rent burden
- 894.0
Population outlook (Erie County) Hauer SSP2
- Today (2025)
- 272,159 people
- By 2030
- 266,299 · -2.2%
- By 2040
- 250,987 · -7.8%
- By 2050
- 234,925 · -13.7%
- By 2075
- 199,164 · -26.8%
- By 2100
- 162,985 · -40.1%
Race, ethnicity, and origin ACS 2023
- Neighborhood character
- Predominantly White (88%)
- Race & ethnicity
- White 88% Two or more races 5% Asian 4% Black 2% Hispanic / Latino 2%
- Common ancestry
- Romanian 11% Italian 2% Lithuanian 1%
- Foreign-born
- 5% · Canada, China
- Languages at home
- 93% English-only · Other Indo-European 2% Spanish 1% Russian/Polish/Slavic 1%
Political lean MEDSL · Erie
- 2024 margin
- Toss-up / Even · D 49.0% · R 50.0%
- 2008→2024 swing
- -20.9pp toward R · 2008: 19.9pp · 2024: -1.0pp
- All cycles
- 2024: R+1.0 2020: D+1.0 2016: R+2.0 2012: D+16.9 2008: D+19.9
Not yet ingested
- Civics
- —
Market trends
- HPI YoY
- ▼ -152.21%
- Current HPI
- 228.7506
- Rent YoY
- —
- Metro
- Erie, PA
- State GDP YoY
- ▲ 1.68%
- F500 in state
- 34
Industry mix (Fortune 500 HQ in PA)
| Industry | F500 HQs | Revenue |
|---|---|---|
| Healthcare | 2 | $309B |
|
||
| Insurance | 2 | $27B |
|
||
| Telecommunications / Media | 1 | $124B |
|
||
| Industrial Distribution | 1 | $22B |
|
||
| Financial Services | 1 | $20B |
|
||
| Chemicals / Materials | 1 | $18B |
|
||
Price history
+1621.4% since first listed6 events — show timeline
- 2026-06-04 Listed $241,000 GEBOR
- 2017-07-21 Sold (Public Records) $130,900 Public Records
- 2017-07-20 Sold (MLS) $130,900 GEBOR
- 2017-05-30 Listed $134,900 GEBOR
- 2005-07-26 Sold (Public Records) $119,500 Public Records
- 1987-03-06 Sold (Public Records) $14,000 Public Records
Property tax history
+2.5%/yrLatest (2026): $3,398 · +3.6% YoY. Source: county tax records.
Cash-flow waterfall
monthlySold comps — $/sqft
last 12 mo · ≤1 miLoading sold comps…