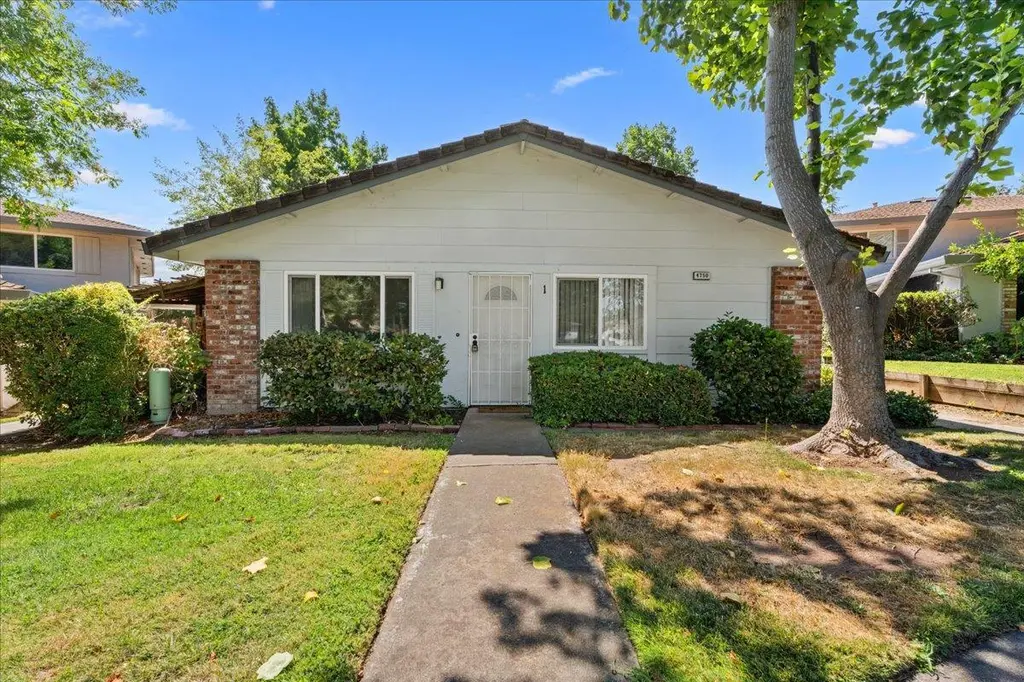
4750 Greenholme Dr #1 · Foothill Farms, CA
Flood risk No data
- FEMA flood zone
- —
- Chance of flooding over 30 yrs
- —
- Est. flood insurance / yr
- —
Fire risk No data
- Est. fire insurance / yr
- —
Heat risk No data
- Hot days now (above threshold)
- —
- Hot days in 30 yrs
- —
Wind risk No data
- Chance of severe wind over 30 yrs
- —
Air-quality risk No data
- Unhealthy air days now
- —
- Unhealthy air days in 30 yrs
- —
Risk factors via First Street. Map © Google.
Why this score? — see what drove the C- grade
The composite is a weighted blend of 9 inputs, each scored 0–100. Each bar is that input's sub-score; the figure is the points it added to the 100-point composite (weight × sub-score).
- ARV discount +15.0/15.0
- Cash flow +12.9/30.0
- 1% rule +6.6/10.0
- Rent growth +4.1/5.0
- DSCR +3.9/10.0
- Livability +3.2/5.0
- Schools +3.1/10.0
- Condition / age +2.5/5.0
- Appreciation +0.0/10.0
$150,500
🖨 Deal sheet 📄 Offer letter ✓ Due diligence
Listing remarks
Back on the Market! Welcome to your new happy place! Nestled in a quiet, well-maintained community, this adorable lower-level condo offers the perfect blend of comfort, style, and serenity. With serene views of a manicured courtyard and tasteful updates throughout, this residence delivers refined living in a private, ground-floor setting. Move in ready this popular single story model offers a kitchen w/ tile floors, oak cabinets, granite counters and stainless steel appliances, plus a large pantry closet. Newer heat/air with dual pane windows. Covered private patio w/ tile floor is great for outdoor dining. Unit shares a 2 car garage with extra storage. 2nd parking spot on driveway. Shared
Key facts
- Manicured courtyard
- Tile floors
- Oak cabinets
Tags
Neighborhood map
What this means for you Summary
Snapshot
- This is a 2-bed/1.0-bath condo listed at $150k.
Deal economics
- At list price, monthly cash flow is $-10 ($-120/yr) — negative.
- To cash-flow at today's rent, offer at most $149k (1.2% below list).
- Meets the 1% rule at list price ($2k rent vs $150k).
- Recommended offer: $132k (12.0% below list) — sets the bar for market timing.
- Cap rate 6.2% vs local median 3.9% in Foothill Farms — top-decile yield for the area; either an underpriced asset or a hidden risk that comps aren't pricing in. Stress-test before assuming the spread holds.
Location & tenants
- Location reads 64/100 on livability (#433 in CA) — a middle-class / working-renter tenant base. Strengths: housing A+, schools A; Watch: employment D+, crime F, amenities F.
- Twin Rivers Unified (suburban): math 29% / reading 37% proficiency, ranked #970 of 1,400 in CA (top 69%) — families likely to look elsewhere, expect single-tenant / working-renter base with shorter leases; 76% free/reduced lunch — lower-income household profile, screen leases tightly.
- Market conditions: Rents rising fast (+6.5%/yr); 130 active listings in the ZIP; 40 comparable units currently listed for rent nearby; rentals leasing fast (median 2d on market — plan ~1-2 weeks tenant-placement turnaround); 6,825 units permitted in Sacramento County in 2024 (1,752 in 5+ unit buildings).
- This rent runs 31% of the median local income ($68k/yr) — at the standard rent-burdened threshold; future hikes will face affordability resistance.
Forward outlook
- Local home prices are declining (-3.0%/yr); year-one equity from $1k of loan paydown is wiped out by about $5k of value loss. Plan a longer hold.
- Sacramento County population projected at +17% by 2050 — long-run rental-demand tailwind backs the buy-and-hold thesis.
Negotiation context
- It's been on market 222 days — a 12% lower offer ($132k) is reasonable based on typical stale-listing flexibility.
Questions for the listing agent
- What do current leases actually rent for vs. the listed asking? Can we see a recent rent roll and the last 12 months of T-12 income?
- It's been on market 222 days. Have you received any prior offers? Is the seller open to a 12% concession, seller financing, or rate buy-down credit?
- Built in 1977 — when were the roof, HVAC, electrical panel, plumbing, and water heater last replaced?
- What does the HOA fee cover, when was the last increase, and are there any pending special assessments or reserve-fund shortfalls?
- Any open or pending special assessments — roof, HVAC, plumbing, elevator, façade? What's the per-unit balance and payoff schedule, and is the seller paying it off at close or rolling it to the buyer?
- Why hasn't it sold? Are there any deal-killer items the seller is aware of (foundation, flood, title, zoning, code violations)?
- Is there a deadline driving the sale (1031 exchange, divorce, estate, relocation)? That informs how much negotiation room exists.
- Schools are A-rated — typically a magnet for longer-tenancy family renters. What's the average tenant stay here, and is there a school-zone premium baked into asking?
- Crime grade is F in this area — have there been break-ins, vandalism, or insurance claims at this property in the last 3 years? What carrier currently insures it and at what premium?
- What's the average days-on-market for RENTAL listings here right now (not sales)? A rising rental-DOM trend means longer vacancies and softer asking-rent achievability than the comps imply.
- What's the recent tenant-quality profile in this submarket — average credit score on applications, eviction rate, late-payment / NSF rate, and stable-employment percentage? A property-management company in the area should have these aggregated.
- How much new apartment / multifamily construction is in the pipeline within 1–3 miles? Heavy new supply (>2% of stock underway) typically softens rents 12–24 months out; light construction supports rent growth.
Investment metrics
- 1% rule
- 1.16% ✓
- Cap rate
- 6.21%
- Cash-on-cash
- -0.29%
- DSCR
- 0.99
- GRM
- 7.2
CMA / ARV
- ARV (median comp)
- $216,651
- List price
- $150,500
- Delta
- -30.53%
- Verdict
- UNDERPRICED
- Comps
- 20 within 1.0 mi
Projected returns pro-forma
-3.0% appreciation · 6.52% rent growth · sell at horizon
- IRR
- -11.5%
- Equity multiple
- 0.56×
- Total profit
- $-18,359
- Equity at exit
- $22,440
- IRR
- 3.4%
- Equity multiple
- 1.30×
- Total profit
- $12,518
- Equity at exit
- $13,012
Cash invested: $42,140 (down + closing). Projections, not guarantees.
Landlord ↔ Tenant lean methodology
- Overall (STATE)
- 18 Strongly Tenant-Friendly
- State California
- 18 Strongly Tenant-Friendly · D+13
- County
- — inherits STATE
- City
- — inherits STATE
ZIP-level market 95842
- Home prices YoY
- -30.3%
- Rents YoY
- 6.5%
- Active inventory
- 130
- Price-to-rent
- 7.2×
Monthly cashflow live
- Estimated rent
- $1,752 high interval (Pro) →
- Mortgage (P&I)
- −$789
- Tax from tax record
- −$218 /mo · $2,613/yr
- Insurance
- −$63
- HOA
- −$324
- Vacancy / Maint / Mgmt
- −$368
- Net cashflow
- $-10
Break-even live
UW: 25.0% down · 7.5% · 30yr · 1.5% tax · 5.0% vac · 8.0% maint · 8.0% mgmt
Financing live
Cash to close
- Down payment
- $37,625
- Closing costs
- $4,515
- Reserves months
- —
- Total cash needed
- —
Loan-product check · same deal, 3 products live
Conventional
25% down · 7.5% · 30yr
- Down + closing
- —
- Monthly P&I
- —
- Monthly cashflow
- —
- DSCR
- —
- Eligible?
- —
Personal DTI + credit; lowest rate.
DSCR
20% down · 8.5% · 30yr
- Down + closing
- —
- Monthly P&I
- —
- Monthly cashflow
- —
- DSCR
- —
- Eligible?
- —
No personal income docs; deal must DSCR.
Hard money
10% down · 12.0% · 12mo
- Down + closing
- —
- Monthly P&I
- —
- Monthly cashflow
- —
- DSCR
- —
- Eligible?
- —
Short-term bridge; refi at stabilization.
Rent comps 40 comps
| Address | Beds | Baths | Sqft | Rent | $/sqft | DOM | Units | Dist |
|---|---|---|---|---|---|---|---|---|
| 4758 Greenholme Dr Sacramento, CA | 2.0 | 1.0 | 924 | $1,595 | $1.73 | 43d | 1 | 0.03mi |
| 5525 Missie Way Unit 8346003001/85 Sacramento, CA | 2.0 | 1.0 | 1000 | $1,985 | $1.99 | 1d | 1 | 0.16mi |
| 5600 Walerga Rd #4 Sacramento, CA | 2.0 | 1.0 | 924 | $1,700 | $1.84 | 1d | 1 | 0.18mi |
| 4821 Mary Kate Dr Unit 4823 Sacramento, CA | 2.0 | 2.0 | 1050 | $1,675 | $1.60 | 1d | 1 | 0.21mi |
| 4815 Mary Kate Dr Sacramento, CA | 2.0 | 2.0 | 1100 | $1,850 | $1.68 | 43d | 1 | 0.22mi |
| 4549 Greenholme Dr #2 Sacramento, CA | 2.0 | 1.0 | 840 | $2,000 | $2.38 | 3d | 1 | 0.25mi |
| 5443 College Oak Dr Sacramento, CA | 1.0–2.0 | 1.0–2.0 | 821 | $1,850 | $2.25 | 43d | 3 | 0.28mi |
| 5415 College Oak Dr Sacramento, CA | 1.0–2.0 | 1.0–2.0 | 850 | $1,725 | $2.03 | 1d | 3 | 0.36mi |
| 5674 Hillsdale Blvd Sacramento, CA | 2.0 | 1.5 | 933 | $1,600 | $1.71 | 1d | 1 | 0.36mi |
| Venuto Way North Highlands, CA | 2.0 | 1.0 | 906 | $2,095 | $2.31 | 10d | 2 | 0.40mi |
| 5614 Hillsdale Blvd Unit A Sacramento, CA | 2.0 | 1.5 | 933 | $1,450 | $1.55 | 22d | 1 | 0.44mi |
| 5341 Walnut Ave Sacramento, CA | 1.0–2.0 | 1.0 | 750 | $1,795 | $2.39 | 1d | 6 | 0.47mi |
| 5948 Walerga Rd #3 Sacramento, CA | 2.0 | 1.0 | 840 | $1,395 | $1.66 | 1d | 1 | 0.53mi |
| 5500 Foothill Garden Ct Sacramento, CA | 1.0 | 1.0 | 750 | $1,472 | $1.96 | 1d | 2 | 0.53mi |
| 5954 Walerga Rd #1 Sacramento, CA | 2.0 | 1.0 | 800 | $1,345 | $1.68 | 1d | 1 | 0.54mi |
| 5954 Walerga Rd #3 Sacramento, CA | 2.0 | 1.0 | 840 | $1,395 | $1.66 | 10d | 1 | 0.54mi |
| 4358 Greenholme Dr #9 Sacramento, CA | 1.0 | 1.0 | 844 | $1,695 | $2.01 | 3d | 1 | 0.55mi |
| 5966 Walerga Rd #4 Sacramento, CA | 2.0 | 1.0 | 924 | $1,550 | $1.68 | 1d | 1 | 0.56mi |
| 4440 Oakhollow Dr Sacramento, CA | 1.0–2.0 | 1.0 | 842 | $1,590 | $1.89 | 1d | 8 | 0.59mi |
| 5800 Hamilton St Sacramento, CA | 1.0–2.0 | 1.0–2.0 | 823 | $1,770 | $2.15 | 1d | 4 | 0.62mi |
| 5322 Hemlock St Sacramento, CA | 1.0–2.0 | 1.0 | 800 | $1,875 | $2.34 | 1d | 2 | 0.72mi |
| 4215 Palm Ave Sacramento, CA | 1.0–2.0 | 1.0–2.0 | 775 | $1,660 | $2.14 | 1d | 3 | 0.72mi |
| 5048 Date Ave Sacramento, CA | 2.0 | 1.0 | 1000 | $1,588 | $1.59 | 43d | 1 | 0.77mi |
| 5516 Palmdale Way Sacramento, CA | 3.0 | 2.0 | 1115 | $2,250 | $2.02 | 20d | 1 | 0.78mi |
| 5011 Bremner Way #3 Sacramento, CA | 2.0 | 1.0 | 850 | $1,700 | $2.00 | 23d | 1 | 0.80mi |
| 5011 Bremner Way #2 Sacramento, CA | 2.0 | 1.0 | 850 | $1,700 | $2.00 | 1d | 1 | 0.80mi |
| 5226 Hemlock St #35 Sacramento, CA | 1.0 | 1.0 | 682 | $1,650 | $2.42 | 23d | 1 | 0.81mi |
| 5008 Bremner Way #3 Sacramento, CA | 2.0 | 1.0 | 850 | $1,650 | $1.94 | 1d | 1 | 0.81mi |
| 5425 Garfield Ave Sacramento, CA | 1.0–2.0 | 1.0–2.0 | 787 | $1,650 | $2.10 | 20d | 5 | 0.82mi |
| 5012 Sunshine Ln Sacramento, CA | 2.0 | 1.0 | 970 | $1,775 | $1.83 | 10d | 1 | 0.82mi |
| 5501 Keoncrest Cir Unit 1 Sacramento, CA | 2.0 | 1.0 | 750 | $1,300 | $1.73 | 1d | 1 | 0.85mi |
| 4728 Amber Ln Sacramento, CA | 2.0 | 1.0 | 730 | $1,900 | $2.60 | 19d | 1 | 0.86mi |
| 5587 Keoncrest Cir Unit 2 Sacramento, CA | 2.0 | 1.5 | 900 | $2,000 | $2.22 | 1d | 1 | 0.88mi |
| 5001 Date Ave Sacramento, CA | 3.0 | 2.0 | 1106 | $2,400 | $2.17 | 1d | 1 | 0.88mi |
| 5840 Garfield Ave Sacramento, CA | 2.0 | 1.0 | 850 | $1,545 | $1.82 | 1d | 2 | 0.89mi |
| 4605 Cyclamen Way Sacramento, CA | 2.0 | 1.0 | 870 | $1,695 | $1.95 | 1d | 1 | 0.92mi |
| 4901 Little Oak Ln Sacramento, CA | 1.0–3.0 | 1.0–2.0 | 915 | $1,540 | $1.68 | 1d | 7 | 0.95mi |
| 5922 Petaluma Ct Sacramento, CA | 2.0 | 2.0 | 1048 | $2,075 | $1.98 | 1d | 1 | 0.98mi |
| 5520 Harrison St North Highlands, CA | 2.0 | 1.0 | 735 | $1,478 | $2.01 | 7d | 1 | 0.98mi |
| 5119 Hillsdale Blvd Sacramento, CA | 1.0 | 1.0 | 592 | $1,250 | $2.11 | 1d | 1 | 1.02mi |
HOA detail condo
- Monthly dues
- $324 · $3,888/yr
- Assessments
- None detected in remarks — confirm with the listing agent.
Listing history 4 events
-
2019-08-12soldstatus $150,000
-
2006-03-02soldstatus $165,000
-
2003-11-26soldstatus $115,000
-
2003-11-26soldstatus $115,000
ⓘ Source: listings_history table (triggers on properties + properties_extension) + one-shot
backfill from property_details.listing_events for pre-trigger history.
Tax reassessment forecast CA · Resets to sale price
- Current annual tax
- $2,613 · $218/mo
- Projected year-2 tax
- $2,613 · $218/mo
- Expected delta
- $0/yr ($0/mo · 0.0%)
ⓘ Screening estimate from a state-policy table — verify with the county assessor before closing.
Nearby sold comps map
Loading sold comps map…
Walkable amenities ~0.75 mi
Loading nearby amenities…
Taxation est. · year 1
- Rental income
- $21,019
- − Mortgage interest
- −$8,430
- − Property taxes
- −$2,613
- − Insurance
- −$752
- − Repairs & maintenance
- −$1,681
- − Management
- −$1,681
- − HOA
- −$3,888
- − Depreciation
- −$4,378
- Taxable loss
- −$2,407
- Est. tax savings @ 24.0%
- +$578
- After-tax cash flow
- $458/yr
For passive investors: Depreciation is non-cash, so a rental often shows a tax loss while cash-flowing — sheltering income. Rental losses are passive: they offset passive income freely, and up to $25,000/yr can offset ordinary (W-2) income if you actively participate and your MAGI is under $100k (phasing out to $0 by $150k); unused losses carry forward. On sale, claimed depreciation is recaptured at up to 25%, and gains may owe capital-gains tax (a 1031 exchange can defer both). Figures are a year-1 estimate at your 24.0% rate — not tax advice; consult a CPA.
Schools (NCES district)
- District
- Twin Rivers Unified
- NCES district ID
- 0601332
- Math proficiency
- 29% ▲ 2.00%
- Reading proficiency
- 37% ▲ 2.00%
- Median HH income
- $42,481
- Composite
- 30.67/100
- National rank
- #11437
- State rank
- #970 of 1400 in CA
Livability — Foothill Farms
- Score
- 64/100
- State rank
- #433
- US rank
- #14728
Category grades
Schools grade is shown separately in the Schools card above.
Census & demographics
- Census place
- Foothill Farms, CA
- County
- Sacramento County · 1,539,646 people
- City population
- 35,031
- Metro
- Sacramento-Roseville-Folsom, CA
- Population (ZIP)
- 34,034
- Household income
- $68,276
- Rent vs Own
- Severe rent burden
- 1906.0
Population outlook (Sacramento County) Hauer SSP2
- Today (2025)
- 1,660,763 people
- By 2030
- 1,732,990 · +4.3%
- By 2040
- 1,855,755 · +11.7%
- By 2050
- 1,941,335 · +16.9%
- By 2075
- 2,046,162 · +23.2%
- By 2100
- 1,961,444 · +18.1%
Race, ethnicity, and origin ACS 2023
- Neighborhood character
- Highly diverse neighborhood (Simpson 0.71)
- Race & ethnicity
- White 45% Hispanic / Latino 23% Two or more races 14% Asian 12% Black 12% Native American 1%
- Hispanic origin (detail)
- Mexican 19%
- Common ancestry
- Scotch-Irish 5% Subsaharan African 5% Lithuanian 2%
- Foreign-born
- 26% · Canada, Vietnam, South Korea
- Languages at home
- 61% English-only · Spanish 14% Russian/Polish/Slavic 11% Other Indo-European 5%
Political lean MEDSL · Sacramento
- 2024 margin
- D (+19.7) · D 58.1% · R 38.4% · Other 3.5%
- 2008→2024 swing
- +0.7pp no change · 2008: 19.0pp · 2024: 19.7pp
- All cycles
- 2024: D+19.7 2020: D+25.3 2016: D+23.7 2012: D+16.3 2008: D+19.0
Not yet ingested
- Civics
- —
Market trends
- HPI YoY
- ▼ -166.74%
- Current HPI
- 384.1812
- Rent YoY
- ▲ 6.52%
- Metro
- Sacramento-Roseville-Folsom, CA
- State GDP YoY
- ▲ 3.21%
- F500 in state
- 116
Industry mix (Fortune 500 HQ in CA)
| Industry | F500 HQs | Revenue |
|---|---|---|
| Technology | 27 | $1,492B |
|
||
| Financial Services | 3 | $174B |
|
||
| Retail | 3 | $44B |
|
||
| Insurance | 3 | $26B |
|
||
| Media / Entertainment | 2 | $115B |
|
||
| Pharmaceuticals / Biotech | 2 | $62B |
|
||
Price history
+30.4% since first listed4 events — show timeline
- 2019-08-12 Sold (Public Records) $150,000 Public Records
- 2006-03-02 Sold (Public Records) $165,000 Public Records
- 2003-11-26 Sold (Public Records) $115,000 Public Records
- 2003-11-26 Sold (Public Records) $115,000 Public Records
Property tax history
+3.6%/yrLatest (2025): $2,613 · +47.3% YoY. Source: county tax records.
Cash-flow waterfall
monthlySold comps — $/sqft
last 12 mo · ≤1 miLoading sold comps…