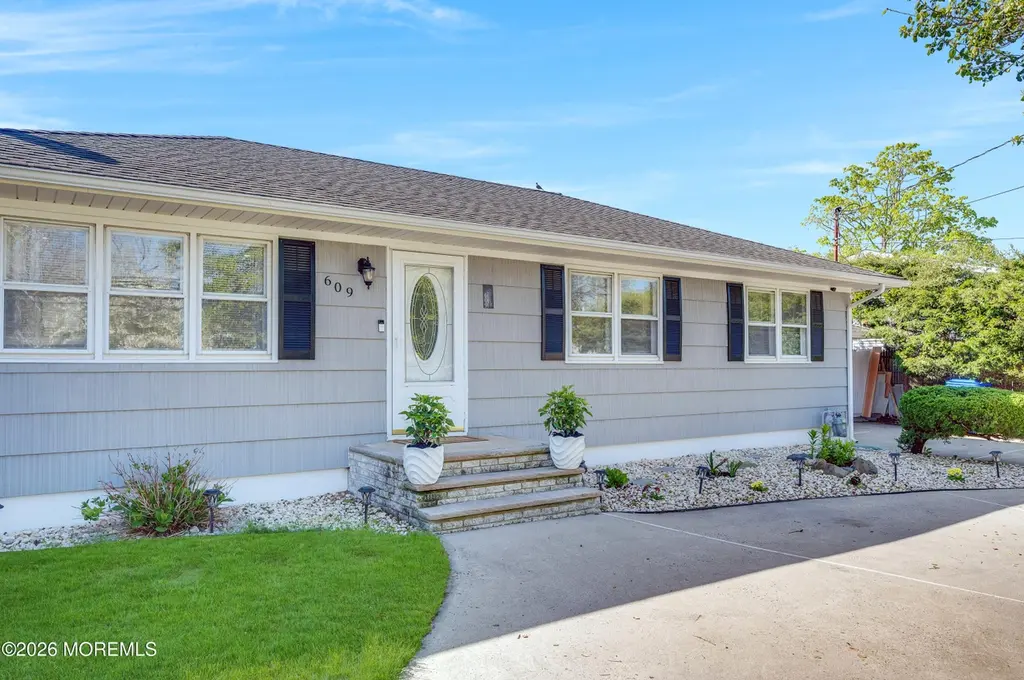
609 Adamston Rd · Toms River, NJ
Flood risk 1/10 · Minimal
- FEMA flood zone
- X (unshaded)
- Chance of flooding over 30 yrs
- 0.0%
- Est. flood insurance / yr
- $507 – $1,088
Fire risk 3/10 · Minor
- Est. fire insurance / yr
- $526 – $976
Heat risk 8/10 · Major
- Hot days now (above 98°F)
- 7 days/yr
- Hot days in 30 yrs
- 15 days/yr
Wind risk 8/10 · Major
- Chance of severe wind over 30 yrs
- 80.0%
Air-quality risk 3/10 · Minor
- Unhealthy air days now
- 3 days/yr
- Unhealthy air days in 30 yrs
- 4 days/yr
Risk factors via First Street. Map © Google.
Why this score? — see what drove the C+ grade
The composite is a weighted blend of 9 inputs, each scored 0–100. Each bar is that input's sub-score; the figure is the points it added to the 100-point composite (weight × sub-score).
- Cash flow +25.3/30.0
- ARV discount +9.8/15.0
- DSCR +8.3/10.0
- 1% rule +6.5/10.0
- Livability +4.0/5.0
- Schools +2.8/10.0
- Rent growth +2.5/5.0
- Condition / age +2.5/5.0
- Appreciation +0.0/10.0
$449,900
🖨 Deal sheet 📄 Offer letter ✓ Due diligence
Listing remarks MLS
Pretty as a picture; Very convenient location. This home has everything you need: Good size living room; inviting dining room; pretty kitchen; 1.5 baths; 3 nice size bedrooms & garage Private & fenced backyard with wrap around deck. Circular driveway, a must see.
Key facts
- Built ins
- Granite countertops
- Patio
Tags
Property features AI
Exterior
- Parking: Attached garage (1 car)
- Utilities: Public sewer
- Home design: Fee simple ownership
- Construction: Shingle roof
- Exterior features: Level lot
Interior
- Kitchen: Electric cooking; Stove; Microwave; Refrigerator
- Bedrooms: 3 bedrooms (all on the first level)
- Flooring: Ceramic tile; Wood
- Bathrooms: 1 full bath and 1 half bath (1.5 total)
- Heating & cooling: Forced air heating; Central air conditioning
- Interior features: Ceiling fans; Attic fan; Blinds/shades; Light fixtures; Screens; Fireplace (1)
- Laundry & utility: Washer; Dryer
Neighborhood map
What this means for you Summary
Snapshot
- This is a 3-bed/2.0-bath single-family listed at $450k.
Deal economics
- At list price, monthly cash flow is $1k ($12k/yr) — positive.
- The deal already cash-flows at list — no discount required.
- Meets the 1% rule at list price ($5k rent vs $450k).
- Cap rate 9.0% vs local median 3.8% in Toms River — top-decile yield for the area; either an underpriced asset or a hidden risk that comps aren't pricing in. Stress-test before assuming the spread holds.
Location & tenants
- Location reads 81/100 on livability (#61 in NJ, #1,538 nationally) — a professional / high-income tenant draw. Strengths: employment A+, housing A+, health & safety A+; Watch: commute D, cost of living F.
- Brick Township Public School District (suburban): math 18% / reading 43% proficiency, ranked #330 of 472 in NJ (top 70%) — families likely to look elsewhere, expect single-tenant / working-renter base with shorter leases.
- Market conditions: 210 active listings in the ZIP; 2 comparable units currently listed for rent nearby; solid renter incomes; 4,434 units permitted in Ocean County in 2024 (868 in 5+ unit buildings).
- At $5,152/mo this rent would consume 57% of the median local household income ($109k/yr) (locally 404% of renters already pay >50% of income on rent) — very limited rent-growth headroom before tenants either downsize or default.
Forward outlook
- Local home prices are declining (-3.0%/yr); year-one equity from $3k of loan paydown is wiped out by about $13k of value loss. Plan a longer hold.
- Ocean County population projected to shrink 8% by 2050 — rents likely to lag national; underwrite the cash flow, not the appreciation.
Negotiation context
- Only 14 days on market — expect competitive offers; lowballing is unlikely to land.
- 4 sale attempts since 28y ago with the ask held roughly flat each time — persistent listings suggest the price (not the market) is what's stuck; bring a comps-based counter.
- Current owner paid $215k; list at $450k implies a 109% gain — meaningful room to come down on a strong offer.
Risks & watch-outs
- Watch-outs: built in 1957 — expect roof / HVAC / electrical / plumbing capex.
- Climate carrying-cost: severe wind risk, 80% chance of damaging wind over 30y; extreme-heat days projected 7→15/yr by 2055 (HVAC capex compounding) — expect insurance premiums to compound above CPI over the hold.
Questions for the listing agent
- Built in 1957 — when were the roof, HVAC, electrical panel, plumbing, and water heater last replaced?
- Is there a deadline driving the sale (1031 exchange, divorce, estate, relocation)? That informs how much negotiation room exists.
- What's the average days-on-market for RENTAL listings here right now (not sales)? A rising rental-DOM trend means longer vacancies and softer asking-rent achievability than the comps imply.
- What's the recent tenant-quality profile in this submarket — average credit score on applications, eviction rate, late-payment / NSF rate, and stable-employment percentage? A property-management company in the area should have these aggregated.
- How much new for-sale + rental construction is in the pipeline within 1–3 miles? Heavy new supply typically softens prices + rents 12–24 months out; constrained supply supports both.
Investment metrics
- 1% rule
- 1.15% ✓
- Cap rate
- 9.03%
- Cash-on-cash
- 9.78%
- DSCR
- 1.43
- GRM
- 7.3
CMA / ARV
- ARV (on-the-fly)
- $473,625
- Comps found
- 12
Show comp detail 12 sales within ~0.75 mi
| Address | Dist | Beds/Ba | Sqft | Sold | Price | $/sf | Match |
|---|---|---|---|---|---|---|---|
| 13 Baywood Blvd | 0.27mi | 3/1.0 | 1,014 (-10%) | 1mo | $438,750 | $433 | 66 |
| 280 Leswing Dr | 0.24mi | 3/1.0 | 1,020 (-9%) | 6mo | $420,000 | $412 | 64 |
| 323 Church Rd | 0.28mi | 3/1.0 | 988 (-12%) | 5mo | $405,000 | $410 | 59 |
| 72 Baywood Blvd | 0.51mi | 2/1.0 (-1) | 1,079 (-4%) | 2mo | $436,000 | $404 | 58 |
| 251 Huppert Dr | 0.42mi | 3/1.0 | 1,040 (-8%) | 7mo | $455,000 | $438 | 58 |
| 48 Birch Dr | 0.48mi | 3/1.0 | 1,000 (-11%) | 2mo | $421,000 | $421 | 54 |
| 84 Woodland Dr | 0.67mi | 3/1.0 | 1,186 (+5%) | 3mo | $436,000 | $368 | 54 |
| 22 Homestead Dr | 0.66mi | 3/2.0 | 1,184 (+5%) | 9mo | $435,000 | $367 | 53 |
| 300 Bellanca Rd | 0.52mi | 3/3.0 | 1,218 (+8%) | 6mo | $525,000 | $431 | 52 |
| 553 Kingfisher Cir | 0.64mi | 3/1.5 | 1,219 (+8%) | 5mo | $505,000 | $414 | 50 |
| 63 Willetta Dr | 0.55mi | 3/1.0 | 1,020 (-9%) | 9mo | $429,000 | $421 | 47 |
| 52 Burlington Dr | 0.69mi | 2/1.5 (-1) | 960 (-15%) | 6mo | $420,000 | $438 | 31 |
Match score weights: distance 35% · size 25% · config 20% · recency 20%. Top-matched comps best support the ARV.
Projected returns pro-forma
-3.0% appreciation · 3.0% rent growth · sell at horizon
- IRR
- -1.6%
- Equity multiple
- 0.94×
- Total profit
- $-7,508
- Equity at exit
- $67,082
- IRR
- 8.1%
- Equity multiple
- 1.62×
- Total profit
- $77,772
- Equity at exit
- $38,899
Cash invested: $125,972 (down + closing). Projections, not guarantees.
Landlord ↔ Tenant lean methodology
- Overall (STATE)
- 21 Tenant-Leaning
- State New Jersey
- 21 Tenant-Leaning · D+6
- County
- — inherits STATE
- City
- — inherits STATE
ZIP-level market 08723
- Active inventory
- 210
- Price-to-rent
- 7.3×
Monthly cashflow live
- Estimated rent
- $5,152 medium interval (Pro) →
- Mortgage (P&I)
- −$2,359
- Tax from tax record
- −$497 /mo · $5,963/yr
- Insurance
- −$187
- HOA
- −$0
- Vacancy / Maint / Mgmt
- −$1,082
- Net cashflow
- $1,026
Break-even live
UW: 25.0% down · 7.5% · 30yr · 1.5% tax · 5.0% vac · 8.0% maint · 8.0% mgmt
Financing live
Cash to close
- Down payment
- $112,475
- Closing costs
- $13,497
- Reserves months
- —
- Total cash needed
- —
Loan-product check · same deal, 3 products live
Conventional
25% down · 7.5% · 30yr
- Down + closing
- —
- Monthly P&I
- —
- Monthly cashflow
- —
- DSCR
- —
- Eligible?
- —
Personal DTI + credit; lowest rate.
DSCR
20% down · 8.5% · 30yr
- Down + closing
- —
- Monthly P&I
- —
- Monthly cashflow
- —
- DSCR
- —
- Eligible?
- —
No personal income docs; deal must DSCR.
Hard money
10% down · 12.0% · 12mo
- Down + closing
- —
- Monthly P&I
- —
- Monthly cashflow
- —
- DSCR
- —
- Eligible?
- —
Short-term bridge; refi at stabilization.
Rent comps 2 comps
| Address | Beds | Baths | Sqft | Rent | $/sqft | DOM | Units | Dist |
|---|---|---|---|---|---|---|---|---|
| 58 E Lagoona Dr Brick, NJ | 4.0 | 2.0 | 1483 | $11,000 | $7.42 | 1d | 1 | 1.29mi |
| 53 E Coral Dr Brick, NJ | 2.0 | 1.0 | 960 | $2,400 | $2.50 | 10d | 1 | 1.44mi |
Listing history 12 events
-
2026-05-13status Pending
-
2026-04-30$449,900 Active
-
2017-11-14soldstatus $215,000
-
2017-11-03soldstatus $215,000 Sold 274-char remark
Show marketing remark (274 chars)
Pretty as a picture; Very convenient location. This home has everything you need: Good size living room; inviting dining room; pretty kitchen; 1.5 baths; 3 nice size bedrooms & garage Private & fenced backyard with wrap around deck. Circular driveway, a must see.
-
2017-09-01status Pending 274-char remark
Show marketing remark (274 chars)
Pretty as a picture; Very convenient location. This home has everything you need: Good size living room; inviting dining room; pretty kitchen; 1.5 baths; 3 nice size bedrooms & garage Private & fenced backyard with wrap around deck. Circular driveway, a must see.
-
2017-08-25$223,000 Active 274-char remark
Show marketing remark (274 chars)
Pretty as a picture; Very convenient location. This home has everything you need: Good size living room; inviting dining room; pretty kitchen; 1.5 baths; 3 nice size bedrooms & garage Private & fenced backyard with wrap around deck. Circular driveway, a must see.
-
2011-11-19$214,900
-
1999-07-29soldstatus $100,000
-
1999-06-18soldstatus $100,000
-
1999-05-30historical
-
1998-12-22$104,900
-
1978-03-01soldstatus $32,000
ⓘ Source: listings_history table (triggers on properties + properties_extension) + one-shot
backfill from property_details.listing_events for pre-trigger history.
Tax reassessment forecast NJ · Partial reset (capped growth)
- Current annual tax
- $5,963 · $497/mo
- Projected year-2 tax
- $8,583 · $715/mo
- Expected delta
- +$2,620/yr (+$218/mo · 43.9%)
ⓘ Screening estimate from a state-policy table — verify with the county assessor before closing.
Climate risk First Street
- Flood 1/10 Low FEMA zone X (unshaded) · 0% chance over 30 yrs
- Wildfire 3/10 Moderate
- Heat 8/10 Severe 7 d/yr ≥98°F today · 15 d/yr by 30 yrs out
- Wind 8/10 Severe 80% chance of damaging wind over 30 yrs
- Air quality 3/10 Moderate 3 unhealthy d/yr today · 4 by 30 yrs out
Nearby sold comps map
Loading sold comps map…
Walkable amenities ~0.75 mi
Loading nearby amenities…
Taxation est. · year 1
- Rental income
- $61,820
- − Mortgage interest
- −$25,201
- − Property taxes
- −$5,963
- − Insurance
- −$2,250
- − Repairs & maintenance
- −$4,946
- − Management
- −$4,946
- − Depreciation
- −$13,088
- Taxable income
- $5,428
- Est. tax owed @ 24.0%
- −$1,303
- After-tax cash flow
- $11,011/yr
For passive investors: Depreciation is non-cash, so a rental often shows a tax loss while cash-flowing — sheltering income. Rental losses are passive: they offset passive income freely, and up to $25,000/yr can offset ordinary (W-2) income if you actively participate and your MAGI is under $100k (phasing out to $0 by $150k); unused losses carry forward. On sale, claimed depreciation is recaptured at up to 25%, and gains may owe capital-gains tax (a 1031 exchange can defer both). Figures are a year-1 estimate at your 24.0% rate — not tax advice; consult a CPA.
Schools (NCES district)
- District
- Brick Township Public School District
- NCES district ID
- 3402220
- Math proficiency
- 18% ▼ -24.00%
- Reading proficiency
- 43% ▼ -15.00%
- Median HH income
- $68,717
- Composite
- 28.31/100
- National rank
- #6785
- State rank
- #330 of 472 in NJ
Livability — Toms River
- Score
- 81/100
- State rank
- #61
- US rank
- #1538
Category grades
Schools grade is shown separately in the Schools card above.
Census & demographics
- County
- Ocean County · 439,426 people
- City population
- 131,205
- Metro
- New York-Newark-Jersey City, NY-NJ-PA
- Population (ZIP)
- 32,141
- Household income
- $108,643
- Rent vs Own
- Severe rent burden
- 404.0
Population outlook (Ocean County) Hauer SSP2
- Today (2025)
- 586,991 people
- By 2030
- 581,403 · -1.0%
- By 2040
- 564,913 · -3.8%
- By 2050
- 538,149 · -8.3%
- By 2075
- 468,845 · -20.1%
- By 2100
- 350,297 · -40.3%
Race, ethnicity, and origin ACS 2023
- Neighborhood character
- Predominantly White (80%)
- Race & ethnicity
- White 80% Hispanic / Latino 14% Two or more races 9% Black 2%
- Hispanic origin (detail)
- Mexican 4% Puerto Rican 4% Dominican 1%
- Common ancestry
- Romanian 6% Slovak 1% Portuguese 1%
- Foreign-born
- 10% · Canada, Jamaica
- Languages at home
- 86% English-only · Spanish 10% Other Indo-European 2% French/Haitian/Cajun 1%
Political lean MEDSL · Ocean
- 2024 margin
- Solid R (+36.0) · D 31.4% · R 67.4% · Other 1.2%
- 2008→2024 swing
- -17.6pp toward R · 2008: -18.4pp · 2024: -36.0pp
- All cycles
- 2024: R+36.0 2020: R+28.7 2016: R+34.0 2012: R+17.7 2008: R+18.4
Not yet ingested
- Civics
- —
Market trends
- HPI YoY
- ▼ -454.38%
- Current HPI
- 350.5719
- Rent YoY
- —
- Metro
- New York-Newark-Jersey City, NY-NJ-PA
- State GDP YoY
- ▲ 2.05%
- F500 in state
- 34
Industry mix (Fortune 500 HQ in NJ)
| Industry | F500 HQs | Revenue |
|---|---|---|
| Consumer Goods | 3 | $31B |
|
||
| Pharmaceuticals | 2 | $153B |
|
||
| Technology | 2 | $21B |
|
||
| Insurance | 2 | $20B |
|
||
| Healthcare | 2 | $19B |
|
||
| Financial Services | 1 | $70B |
|
||
Price history
+1305.9% since first listed12 events — show timeline
- 2026-05-13 Pending — MOMLS
- 2026-04-30 Listed $449,900 MOMLS
- 2017-11-14 Sold (Public Records) $215,000 Public Records
- 2017-11-03 Sold (MLS) $215,000 MOMLS
- 2017-09-01 Pending — MOMLS
- 2017-08-25 Listed $223,000 MOMLS
- 2011-11-19 Listed $214,900 MOMLS
- 1999-07-29 Sold (Public Records) $100,000 Public Records
- 1999-06-18 Sold (MLS) $100,000 MOMLS
- 1999-05-30 Delisted — MOMLS
- 1998-12-22 Listed $104,900 MOMLS
- 1978-03-01 Sold (Public Records) $32,000 Public Records
Property tax history
+2.6%/yrLatest (2025): $5,963 · +5.1% YoY. Source: county tax records.
Cash-flow waterfall
monthlySold comps — $/sqft
last 12 mo · ≤1 miLoading sold comps…