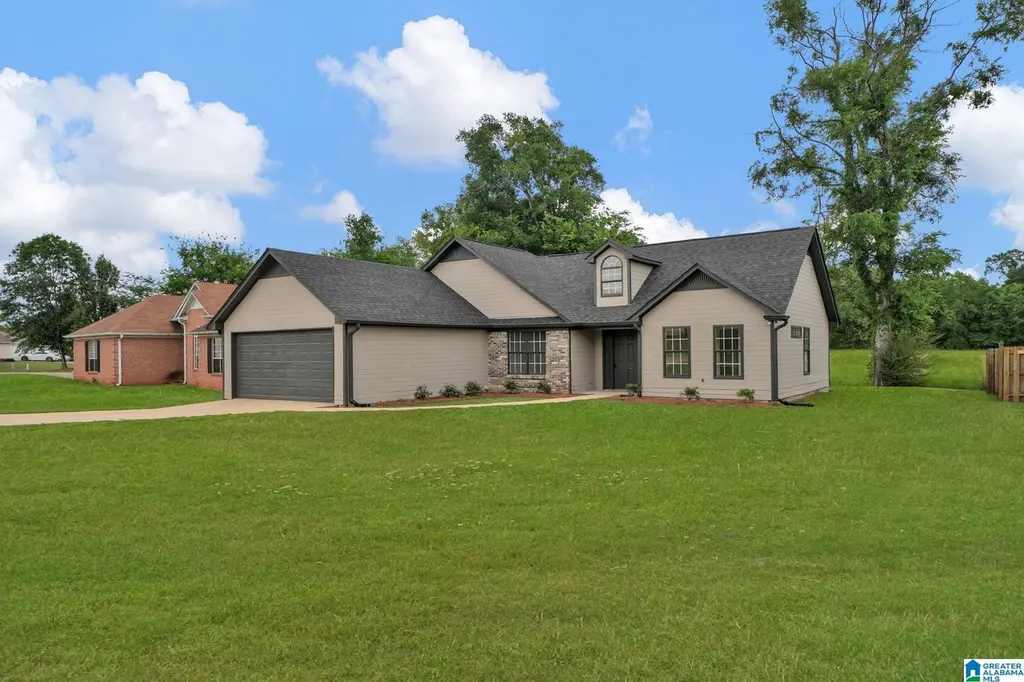
1751 Bradford Ln · Bessemer, AL
Flood risk 1/10 · Minimal
- FEMA flood zone
- X (unshaded)
- Chance of flooding over 30 yrs
- 0.0%
- Est. flood insurance / yr
- $507 – $1,088
Fire risk 4/10 · Minor
- Est. fire insurance / yr
- $916 – $1,700
Heat risk 6/10 · Moderate
- Hot days now (above 108°F)
- 7 days/yr
- Hot days in 30 yrs
- 19 days/yr
Wind risk 6/10 · Moderate
- Chance of severe wind over 30 yrs
- 50.0%
Air-quality risk 2/10 · Minimal
- Unhealthy air days now
- 2 days/yr
- Unhealthy air days in 30 yrs
- 2 days/yr
Risk factors via First Street. Map © Google.
Why this score? — see what drove the D grade
The composite is a weighted blend of 9 inputs, each scored 0–100. Each bar is that input's sub-score; the figure is the points it added to the 100-point composite (weight × sub-score).
- Cash flow +13.1/30.0
- ARV discount +8.5/15.0
- Rent growth +5.0/5.0
- DSCR +3.9/10.0
- Livability +3.0/5.0
- 1% rule +2.5/10.0
- Condition / age +2.5/5.0
- Schools +1.8/10.0
- Appreciation +0.0/10.0
$260,000
🖨 Deal sheet (PDF) 📄 Offer letter ✓ Due diligence
Listing remarks MLS
Great neighborhood for investment property. Home needs renovation. I marked that is can go conventional but that will be up to buyers lender.
Key facts
- Move-in ready
- Fully renovated
- Renovated bathrooms
Tags
Property features AI
Finance
- Other: Subdivision: Bradford Park
- HOA & community: Annual association fee of $150; HOA fees include common grounds maintenance
Exterior
- Parking: Front garage entry; 2-car garage (main level); Driveway parking
- Utilities: Public water; Septic sewer; Electric water heater; Underground utilities; Internet service availability unknown
- Home design: Existing construction; One-side brick and Hardiplank siding; Slab foundation
- Construction: 1-side brick and Hardiplank siding; Slab foundation
- Exterior features: Open patio; Garden/patio area; Pond on the property; Located in a subdivision; Not waterfront; No pool; Not in a flood plain
Interior
- Kitchen: Stone countertops; Built-in dishwasher; Electric stove; Pantry and butler's pantry
- Bedrooms: Master bedroom on main level; Additional bedrooms on main and upper levels; Walk-in closets; Bedrooms include linen closet access
- Flooring: Tile flooring; Vinyl flooring
- Bathrooms: Two full baths; Separate shower; Master bath on main level
- Heating & cooling: Central heating; Central cooling
- Interior features: Smooth ceilings; Tile and vinyl flooring; Brick gas fireplace in the family room; All window treatments remain; Pantry and butler's pantry; Pull-down attic
- Laundry & utility: Main-level laundry room; Washer hookup; Electric dryer hookup; Room-sized laundry space
Neighborhood map
What this means for you Summary
Snapshot
- This is a 3-bed/2.0-bath single-family listed at $260k.
Deal economics
- At list price, monthly cash flow is $-11 ($-131/yr) — negative.
- To cash-flow at today's rent, offer at most $258k (0.7% below list).
- To meet the 1% rule (rent ≥ 1% of price), the offer needs to be $195k (25.2% below list).
- Recommended offer: $195k (25.2% below list) — sets the bar for 1% rule.
Location & tenants
- Location reads 59/100 on livability (#331 in AL) — a working-class tenant base; expect higher turnover. Strengths: commute A+, cost of living A+, housing A; Watch: crime F, amenities F, employment F.
- Jefferson County (suburban): math 9% / reading 32% proficiency, ranked #104 of 129 in AL (top 81%) — low school quality limits family demand, transient renter base, plan for 1-2y turnover.
- Zoned schools: Mcadory Elementary School (math 14% / reading 40%, grade F, #392 of 627 statewide, top 65%, 667 students, 61% FRL); Mcadory Middle School (math 2% / reading 33%, grade F, #199 of 257 statewide, top 77%, 854 students, 74% FRL); Mcadory High School (math 8% / reading 17%, grade F, #237 of 305 statewide, top 78%, 1,162 students, 72% FRL) — zoned schools average 69% FRL vs 49% district-wide (21 pts higher); higher-poverty schools than district average — tighter screening recommended.
- Market conditions: Rents rising fast (+14.8%/yr); 311 active listings in the ZIP; 6 comparable units currently listed for rent nearby; rentals leasing fast (median 4d on market — plan ~1-2 weeks tenant-placement turnaround); solid renter incomes; 2,114 units permitted in Jefferson County in 2024 (556 in 5+ unit buildings).
Forward outlook
- Local home prices are declining (-3.0%/yr); year-one equity from $2k of loan paydown is wiped out by about $8k of value loss. Plan a longer hold.
- Jefferson County population projected to shrink 4% by 2050 — rents likely to lag national; underwrite the cash flow, not the appreciation.
Negotiation context
- It's been on market 45 days — a 3% lower offer ($252k) is reasonable based on typical stale-listing flexibility.
- 2 sale attempts with the ask held roughly flat each time — persistent listings suggest the price (not the market) is what's stuck; bring a comps-based counter.
- Current owner paid $167k; list at $260k implies a 56% gain — meaningful room to come down on a strong offer.
Risks & watch-outs
- Climate carrying-cost: major wind risk, 50% chance of damaging wind over 30y; extreme-heat days projected 7→19/yr by 2055 (HVAC capex compounding) — expect insurance premiums to compound above CPI over the hold.
Questions for the listing agent
- What do current leases actually rent for vs. the listed asking? Can we see a recent rent roll and the last 12 months of T-12 income?
- It's been on market 45 days. Have you received any prior offers? Is the seller open to a 25% concession, seller financing, or rate buy-down credit?
- What does the HOA fee cover, when was the last increase, and are there any pending special assessments or reserve-fund shortfalls?
- Is there a deadline driving the sale (1031 exchange, divorce, estate, relocation)? That informs how much negotiation room exists.
- Schools are D-rated, which usually means shorter tenancies and higher turnover. Who's the typical renter profile here, and what's been the actual vacancy rate?
- Crime grade is F in this area — have there been break-ins, vandalism, or insurance claims at this property in the last 3 years? What carrier currently insures it and at what premium?
- The area grade is low — what's the realistic commute time and amenity access for the typical tenant pool here? Any planned neighborhood developments (good or bad) we should know about?
- What's the average days-on-market for RENTAL listings here right now (not sales)? A rising rental-DOM trend means longer vacancies and softer asking-rent achievability than the comps imply.
- What's the recent tenant-quality profile in this submarket — average credit score on applications, eviction rate, late-payment / NSF rate, and stable-employment percentage? A property-management company in the area should have these aggregated.
- How much new for-sale + rental construction is in the pipeline within 1–3 miles? Heavy new supply typically softens prices + rents 12–24 months out; constrained supply supports both.
Investment metrics
- 1% rule
- 0.75% ✗
- Cap rate
- 6.24%
- Cash-on-cash
- -0.18%
- DSCR
- 0.99
- GRM
- 11.1
CMA / ARV
- ARV (median comp)
- $265,624
- List price
- $260,000
- Delta
- -2.12%
- Verdict
- FAIR
- Comps
- 20 within 1.0 mi
Show comp detail 12 sales within ~0.75 mi
| Address | Dist | Beds/Ba | Sqft | Sold | Price | $/sf | Match |
|---|---|---|---|---|---|---|---|
| 1837 Brandon Way | 0.07mi | 3/2.0 | 1,461 (-1%) | 8mo | $239,900 | $164 | 89 |
| 1705 Bradford Ln | 0.15mi | 3/2.0 | 1,499 (+2%) | 2mo | $270,000 | $180 | 88 |
| 4551 Rosser Loop Dr | 0.22mi | 3/2.0 | 1,386 (-6%) | 4mo | $253,000 | $183 | 76 |
| 4712 Rosser Loop Dr | 0.43mi | 3/2.0 | 1,469 (-0%) | 7mo | $249,900 | $170 | 73 |
| 4413 Wild Flower Cir | 0.24mi | 3/2.0 | 1,571 (+7%) | 7mo | $244,900 | $156 | 72 |
| 4542 Rosser Loop Dr | 0.19mi | 3/2.0 | 1,638 (+11%) | 6mo | $275,000 | $168 | 67 |
| 4501 Rosser Farms Pkwy | 0.30mi | 3/2.0 | 1,618 (+10%) | 4mo | $299,900 | $185 | 66 |
| 4762 Rosser Loop Dr | 0.29mi | 3/2.0 | 1,365 (-7%) | 11mo | $260,000 | $190 | 65 |
| 1671 Bradford Ln | 0.34mi | 3/2.0 | 1,591 (+8%) | 7mo | $256,345 | $161 | 65 |
| 5397 Summerset Way | 0.56mi | 3/2.0 | 1,560 (+6%) | 4mo | $240,100 | $154 | 61 |
| 4468 Rosser Farms Pkwy | 0.33mi | 3/2.0 | 1,618 (+10%) | 10mo | $319,900 | $198 | 60 |
| 4456 Rosser Farms Pkwy | 0.45mi | 3/2.0 | 1,618 (+10%) | 4mo | $314,900 | $195 | 60 |
Match score weights: distance 35% · size 25% · config 20% · recency 20%. Top-matched comps best support the ARV.
Projected returns pro-forma
-3.0% appreciation · 8.0% rent growth · sell at horizon
- IRR
- -11.9%
- Equity multiple
- 0.55×
- Total profit
- $-32,668
- Equity at exit
- $38,767
- IRR
- 2.7%
- Equity multiple
- 1.23×
- Total profit
- $16,952
- Equity at exit
- $22,480
Cash invested: $72,800 (down + closing). Projections, not guarantees.
Landlord ↔ Tenant lean methodology
- Overall (STATE)
- 90 Strongly Landlord-Friendly
- State Alabama
- 90 Strongly Landlord-Friendly · R+15
- County
- — inherits STATE
- City
- — inherits STATE
ZIP-level market 35022
- Home prices YoY
- -20.2%
- Rents YoY
- 14.8%
- Active inventory
- 311
- Price-to-rent
- 11.1×
Monthly cashflow live
- Estimated rent
- $1,945 high interval (Pro) →
- Mortgage (P&I)
- −$1,363
- Tax from tax record
- −$63 /mo · $756/yr
- Insurance
- −$108
- HOA
- −$13
- Vacancy / Maint / Mgmt
- −$409
- Net cashflow
- $-11
Break-even live
Sensitivity live
| Price | -10% $136 | -5% $63 | +0% $-11 | +5% $-84 | +10% $-158 |
|---|---|---|---|---|---|
| Rent | -10% $-165 | -5% $-88 | +0% $-11 | +5% $66 | +10% $143 |
| Rate | -1.0pp $120 | -0.5pp $55 | base $-11 | +0.5pp $-78 | +1.0pp $-147 |
UW: 25.0% down · 7.5% · 30yr · 1.5% tax · 5.0% vac · 8.0% maint · 8.0% mgmt
Financing live
Cash to close
- Down payment
- $65,000
- Closing costs
- $7,800
- Reserves months
- —
- Total cash needed
- —
Loan-product check · same deal, 3 products live
Conventional
25% down · 7.5% · 30yr
- Down + closing
- —
- Monthly P&I
- —
- Monthly cashflow
- —
- DSCR
- —
- Eligible?
- —
Personal DTI + credit; lowest rate.
DSCR
20% down · 8.5% · 30yr
- Down + closing
- —
- Monthly P&I
- —
- Monthly cashflow
- —
- DSCR
- —
- Eligible?
- —
No personal income docs; deal must DSCR.
Hard money
10% down · 12.0% · 12mo
- Down + closing
- —
- Monthly P&I
- —
- Monthly cashflow
- —
- DSCR
- —
- Eligible?
- —
Short-term bridge; refi at stabilization.
Rent comps 6 comps
| Address | Beds | Baths | Sqft | Rent | $/sqft | DOM | Units | Dist |
|---|---|---|---|---|---|---|---|---|
| 4737 Rosser Loop Dr Bessemer, AL | 3.0 | 2.0 | 1638 | $1,886 | $1.15 | 3d | 1 | 0.33mi |
| 457 Flint Hill Rd Bessemer, AL | 2.0 | 1.5 | 975 | $860 | $0.88 | 3d | 3 | 0.94mi |
| 5725 Riverbirch Dr Bessemer, AL | 3.0 | 2.0 | 1620 | $2,050 | $1.27 | 3d | 1 | 0.96mi |
| 63 Carriage House Rd SW Bessemer, AL | 3.0 | 2.0 | 1802 | $1,780 | $0.99 | 17d | 1 | 1.15mi |
| 505 Westchester Dr Bessemer, AL | 4.0 | 2.0 | 1706 | $1,850 | $1.08 | 45d | 1 | 1.16mi |
| 600 Flint Hill Ln Bessemer, AL | 2.0–3.0 | 2.0 | 1005 | $1,099 | $1.09 | 3d | 7 | 1.46mi |
HOA detail
- Monthly dues
- $13 · $156/yr
Listing history 19 events
-
2026-06-22days on market $260,000 Active 45 DOM
-
2026-06-18days on market $260,000 Active 42 DOM
-
2026-06-17days on market $260,000 Active 41 DOM
-
2026-06-16pricedays on market $260,000 Active 40 DOM
-
2026-06-15days on market $264,000 Active 39 DOM
-
2026-06-13days on market $264,000 Active 37 DOM
-
2026-06-10days on market $264,000 Active 34 DOM
-
2026-06-09days on market $264,000 Active 33 DOM
-
2026-06-08days on market $264,000 Active 32 DOM
-
2026-06-07days on market $264,000 Active 31 DOM
-
2026-06-03days on market $264,000 Active 27 DOM
-
2026-06-02days on market $264,000 Active 26 DOM
-
2026-06-01pricedays on market $264,000 Active 25 DOM
-
2026-05-31days on market $269,000 Active 24 DOM
-
2026-05-07$269,000 Active 326-char remark
-
2026-02-10soldstatus $167,000
-
2026-02-02soldstatus $167,000 Sold 141-char remark
Show marketing remark (141 chars)
Great neighborhood for investment property. Home needs renovation. I marked that is can go conventional but that will be up to buyers lender.
-
2026-01-19status Pending 141-char remark
Show marketing remark (141 chars)
Great neighborhood for investment property. Home needs renovation. I marked that is can go conventional but that will be up to buyers lender.
-
2026-01-12$175,000 Active 141-char remark
Show marketing remark (141 chars)
Great neighborhood for investment property. Home needs renovation. I marked that is can go conventional but that will be up to buyers lender.
ⓘ Source: listings_history table (triggers on properties + properties_extension) + one-shot
backfill from property_details.listing_events for pre-trigger history.
Tax reassessment forecast AL · Resets to sale price
- Current annual tax
- $756 · $63/mo
- Projected year-2 tax
- $1,066 · $89/mo
- Expected delta
- +$310/yr (+$26/mo · 41.0%)
ⓘ Screening estimate from a state-policy table — verify with the county assessor before closing.
Climate risk First Street
- Flood 1/10 Low FEMA zone X (unshaded) · 0% chance over 30 yrs
- Wildfire 4/10 Moderate
- Heat 6/10 Major 7 d/yr ≥108°F today · 19 d/yr by 30 yrs out
- Wind 6/10 Major 50% chance of damaging wind over 30 yrs
- Air quality 2/10 Low 2 unhealthy d/yr today · 2 by 30 yrs out
Nearby sold comps map
Loading sold comps map…
Walkable amenities ~0.75 mi
Loading nearby amenities…
Taxation est. · year 1
- Rental income
- $23,345
- − Mortgage interest
- −$14,564
- − Property taxes
- −$756
- − Insurance
- −$1,300
- − Repairs & maintenance
- −$1,868
- − Management
- −$1,868
- − HOA
- −$156
- − Depreciation
- −$7,564
- Taxable loss
- −$4,730
- Est. tax savings @ 24.0%
- +$1,135
- After-tax cash flow
- $1,004/yr
For passive investors: Depreciation is non-cash, so a rental often shows a tax loss while cash-flowing — sheltering income. Rental losses are passive: they offset passive income freely, and up to $25,000/yr can offset ordinary (W-2) income if you actively participate and your MAGI is under $100k (phasing out to $0 by $150k); unused losses carry forward. On sale, claimed depreciation is recaptured at up to 25%, and gains may owe capital-gains tax (a 1031 exchange can defer both). Figures are a year-1 estimate at your 24.0% rate — not tax advice; consult a CPA.
Schools (NCES district)
- District
- Jefferson County
- NCES district ID
- 0101920
- Math proficiency
- 9% ▼ -24.00%
- Reading proficiency
- 32% ▼ -5.00%
- Median HH income
- $51,712
- Composite
- 18.4/100
- National rank
- #8937
- State rank
- #104 of 129 in AL
Livability — Bessemer
- Score
- 59/100
- State rank
- #331
- US rank
- #20078
Category grades
Schools grade is shown separately in the Schools card above.
Census & demographics
- County
- Jefferson County · 527,445 people
- City population
- 48,018
- Metro
- Birmingham-Hoover, AL
- Population (ZIP)
- 23,126
- Household income
- $81,846
- Rent vs Own
- Severe rent burden
- 554.0
Population outlook (Jefferson County) Hauer SSP2
- Today (2025)
- 669,185 people
- By 2030
- 669,694 · +0.1%
- By 2040
- 661,388 · -1.2%
- By 2050
- 643,086 · -3.9%
- By 2075
- 577,267 · -13.7%
- By 2100
- 474,758 · -29.1%
Race, ethnicity, and origin ACS 2023
- Neighborhood character
- Diverse neighborhood (Simpson 0.56)
- Race & ethnicity
- Black 53% White 41% Hispanic / Latino 3% Two or more races 2% Asian 1%
- Common ancestry
- Italian 1% Slovak 1% Iranian 1%
- Foreign-born
- 4% · Canada, China
- Languages at home
- 96% English-only · Spanish 3% Chinese 1%
Political lean MEDSL · Jefferson
- 2024 margin
- D (+10.4) · D 54.6% · R 44.2% · Other 1.2%
- 2008→2024 swing
- +5.4pp toward D · 2008: 5.1pp · 2024: 10.4pp
- All cycles
- 2024: D+10.4 2020: D+13.2 2016: D+7.2 2012: D+6.0 2008: D+5.1
Not yet ingested
- Civics
- —
Market trends
- HPI YoY
- ▼ -55.40%
- Current HPI
- 219.3839
- Rent YoY
- ▲ 14.80%
- Metro
- Birmingham-Hoover, AL
- State GDP YoY
- ▲ 2.94%
- F500 in state
- 4
Industry mix (Fortune 500 HQ in AL)
| Industry | F500 HQs | Revenue |
|---|---|---|
| Financial Services | 1 | $8B |
|
||
| Healthcare | 1 | $5B |
|
||
Price history
+48.6% since first listed7 events — show timeline
- 2026-06-16 Price Changed $260,000 Greater Alabama MLS
- 2026-06-01 Price Changed $264,000 Greater Alabama MLS
- 2026-05-07 Listed $269,000 Greater Alabama MLS
- 2026-02-10 Sold (Public Records) $167,000 Public Records
- 2026-02-02 Sold (MLS) $167,000 Greater Alabama MLS
- 2026-01-19 Pending — Greater Alabama MLS
- 2026-01-12 Listed $175,000 Greater Alabama MLS
Cash-flow waterfall
monthlySold comps — $/sqft
last 12 mo · ≤1 miLoading sold comps…