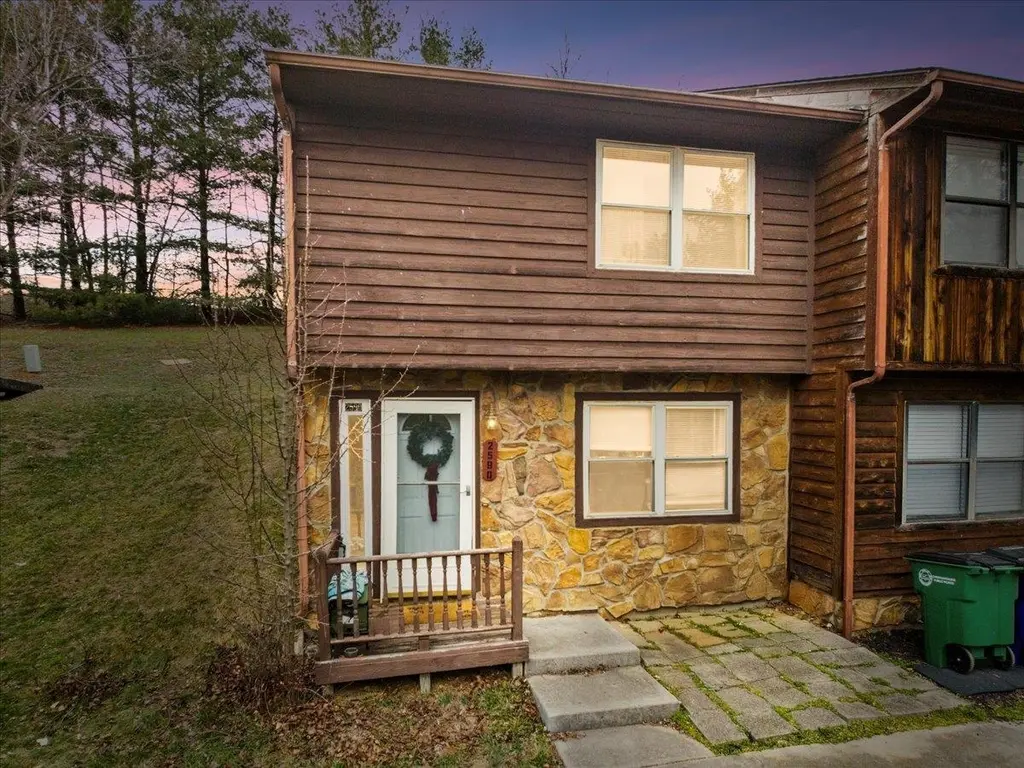
2590 Townhouse St · Christiansburg, VA
Flood risk 1/10 · Minimal
- FEMA flood zone
- X (unshaded)
- Chance of flooding over 30 yrs
- 0.0%
- Est. flood insurance / yr
- $507 – $1,088
Fire risk 4/10 · Minor
- Est. fire insurance / yr
- $666 – $1,236
Heat risk 3/10 · Minor
- Hot days now (above 95°F)
- 7 days/yr
- Hot days in 30 yrs
- 19 days/yr
Wind risk 2/10 · Minimal
- Chance of severe wind over 30 yrs
- 1.0%
Air-quality risk 1/10 · Minimal
- Unhealthy air days now
- 0 days/yr
- Unhealthy air days in 30 yrs
- 0 days/yr
Risk factors via First Street. Map © Google.
Why this score? — see what drove the D grade
The composite is a weighted blend of 9 inputs, each scored 0–100. Each bar is that input's sub-score; the figure is the points it added to the 100-point composite (weight × sub-score).
- Cash flow +15.5/30.0
- Schools +5.4/10.0
- DSCR +4.8/10.0
- Livability +4.0/5.0
- ARV discount +3.3/15.0
- 1% rule +3.2/10.0
- Rent growth +2.8/5.0
- Condition / age +2.5/5.0
- Appreciation +0.0/10.0
$189,000
🖨 Deal sheet (PDF) 📄 Offer letter ✓ Due diligence
Listing remarks MLS
Located close to, schools, restaurants, shopping, and I81, this rental property is a great investment opportunity or your new home. This townhouse has 2 bedrooms and 2.5 baths and as a rental it earned $1,400 per month.
Key facts
- Built 1988
- Listed 141 days
Neighborhood map
What this means for you Summary
Snapshot
- This is a 2-bed/2.5-bath townhouse listed at $189k.
Deal economics
- At list price, monthly cash flow is $78 ($932/yr) — positive.
- The deal already cash-flows at list — no discount required.
- To meet the 1% rule (rent ≥ 1% of price), the offer needs to be $154k (18.3% below list).
- Recommended offer: $154k (18.3% below list) — sets the bar for 1% rule.
- Cap rate 6.8% vs local median 3.9% in Christiansburg — top-decile yield for the area; either an underpriced asset or a hidden risk that comps aren't pricing in. Stress-test before assuming the spread holds.
Location & tenants
- Location reads 81/100 on livability (#53 in VA, #1,452 nationally) — a professional / high-income tenant draw. Strengths: cost of living A+, housing A+, commute A-; Watch: amenities F.
- Montgomery County Public School District (urban): math 57% / reading 70% proficiency, ranked #47 of 131 in VA (top 36%) — acceptable for families but not a draw, mixed tenant base, ~2y average lease.
- Zoned schools: Falling Branch Elementary (math 56% / reading 68%, grade B, #480 of 1,108 statewide, top 46%, 576 students, 52% FRL); Christiansburg Middle (math 38% / reading 63%, grade C, #226 of 342 statewide, top 67%, 752 students, 44% FRL); Christiansburg High (math 79% / reading 77%, grade A-, #80 of 319 statewide, top 25%, 1,116 students, 41% FRL).
- Market conditions: Rents rising (+1.1%/yr); 250 active listings in the ZIP; solid renter incomes; 323 units permitted in Montgomery County in 2024 (0 in 5+ unit buildings).
Forward outlook
- Local home prices are declining (-3.0%/yr); year-one equity from $1k of loan paydown is wiped out by about $6k of value loss. Plan a longer hold.
- Montgomery County population projected at +13% by 2050 — modest demand growth; plan on rents tracking national, not racing it.
Negotiation context
- It's been on market 141 days — a 12% lower offer ($166k) is reasonable based on typical stale-listing flexibility.
- 7 sale attempts since 2y ago with the ask held roughly flat each time — persistent listings suggest the price (not the market) is what's stuck; bring a comps-based counter.
Questions for the listing agent
- It's been on market 141 days. Have you received any prior offers? Is the seller open to a 18% concession, seller financing, or rate buy-down credit?
- Why hasn't it sold? Are there any deal-killer items the seller is aware of (foundation, flood, title, zoning, code violations)?
- Is there a deadline driving the sale (1031 exchange, divorce, estate, relocation)? That informs how much negotiation room exists.
- Schools are A-rated — typically a magnet for longer-tenancy family renters. What's the average tenant stay here, and is there a school-zone premium baked into asking?
- The area grade is low — what's the realistic commute time and amenity access for the typical tenant pool here? Any planned neighborhood developments (good or bad) we should know about?
- What's the average days-on-market for RENTAL listings here right now (not sales)? A rising rental-DOM trend means longer vacancies and softer asking-rent achievability than the comps imply.
- What's the recent tenant-quality profile in this submarket — average credit score on applications, eviction rate, late-payment / NSF rate, and stable-employment percentage? A property-management company in the area should have these aggregated.
- How much new for-sale + rental construction is in the pipeline within 1–3 miles? Heavy new supply typically softens prices + rents 12–24 months out; constrained supply supports both.
Investment metrics
- 1% rule
- 0.82% ✗
- Cap rate
- 6.79%
- Cash-on-cash
- 1.76%
- DSCR
- 1.08
- GRM
- 10.2
CMA / ARV
- ARV (median comp)
- $172,820
- List price
- $189,000
- Delta
- 9.36%
- Verdict
- FAIR
- Comps
- 8 within 1.0 mi
Show comp detail 6 sales within ~0.75 mi
| Address | Dist | Beds/Ba | Sqft | Sold | Price | $/sf | Match |
|---|---|---|---|---|---|---|---|
| 2602 Glade Dr | 0.04mi | 2/2.5 | 1,080 (+2%) | 4mo | $170,000 | $157 | 92 |
| 2594 Townhouse St | 0.01mi | 2/2.5 | 1,062 (0%) | 10mo | $180,000 | $169 | 91 |
| 2596 Glade Dr SE | 0.04mi | 2/2.5 | 1,080 (+2%) | 8mo | $170,000 | $157 | 89 |
| 2576 Townhouse St | 0.03mi | 2/2.5 | 1,033 (-3%) | 10mo | $170,000 | $165 | 86 |
| 2665 Glade Dr SE | 0.10mi | 2/2.5 | 1,166 (+10%) | 6mo | $210,000 | $180 | 74 |
| 2615 Glade Dr SE | 0.08mi | 2/1.5 | 916 (-14%) | 1mo | $191,000 | $209 | 68 |
Match score weights: distance 35% · size 25% · config 20% · recency 20%. Top-matched comps best support the ARV.
Projected returns pro-forma
-3.0% appreciation · 1.05% rent growth · sell at horizon
- IRR
- -15.5%
- Equity multiple
- 0.46×
- Total profit
- $-28,730
- Equity at exit
- $28,181
- IRR
- -10.3%
- Equity multiple
- 0.42×
- Total profit
- $-30,688
- Equity at exit
- $16,341
Cash invested: $52,920 (down + closing). Projections, not guarantees.
Landlord ↔ Tenant lean methodology
- Overall (STATE)
- 55 Moderately Landlord-Leaning
- State Virginia
- 55 Moderately Landlord-Leaning · D+2
- County
- — inherits STATE
- City
- — inherits STATE
ZIP-level market 24073
- Home prices YoY
- -26.2%
- Rents YoY
- 1.1%
- Active inventory
- 250
- Price-to-rent
- 10.2×
Monthly cashflow live
- Estimated rent
- $1,543 medium interval (Pro) →
- Mortgage (P&I)
- −$991
- Tax from tax record
- −$72 /mo · $861/yr
- Insurance
- −$79
- HOA
- −$0
- Vacancy / Maint / Mgmt
- −$324
- Net cashflow
- $78
Break-even live
Sensitivity live
| Price | -10% $185 | -5% $131 | +0% $78 | +5% $24 | +10% $-29 |
|---|---|---|---|---|---|
| Rent | -10% $-44 | -5% $17 | +0% $78 | +5% $139 | +10% $200 |
| Rate | -1.0pp $173 | -0.5pp $126 | base $78 | +0.5pp $29 | +1.0pp $-21 |
UW: 25.0% down · 7.5% · 30yr · 1.5% tax · 5.0% vac · 8.0% maint · 8.0% mgmt
Financing live
Cash to close
- Down payment
- $47,250
- Closing costs
- $5,670
- Reserves months
- —
- Total cash needed
- —
Loan-product check · same deal, 3 products live
Conventional
25% down · 7.5% · 30yr
- Down + closing
- —
- Monthly P&I
- —
- Monthly cashflow
- —
- DSCR
- —
- Eligible?
- —
Personal DTI + credit; lowest rate.
DSCR
20% down · 8.5% · 30yr
- Down + closing
- —
- Monthly P&I
- —
- Monthly cashflow
- —
- DSCR
- —
- Eligible?
- —
No personal income docs; deal must DSCR.
Hard money
10% down · 12.0% · 12mo
- Down + closing
- —
- Monthly P&I
- —
- Monthly cashflow
- —
- DSCR
- —
- Eligible?
- —
Short-term bridge; refi at stabilization.
Listing history 37 events
-
2026-06-21days on market $189,000 Active 141 DOM
-
2026-06-19days on market $189,000 Active 139 DOM
-
2026-06-18days on market $189,000 Active 138 DOM
-
2026-06-17days on market $189,000 Active 137 DOM
-
2026-06-16days on market $189,000 Active 136 DOM
-
2026-06-15days on market $189,000 Active 135 DOM
-
2026-06-14days on market $189,000 Active 133 DOM
-
2026-06-13days on market $189,000 Active 132 DOM
-
2026-06-10days on market $189,000 Active 130 DOM
-
2026-06-09days on market $189,000 Active 129 DOM
-
2026-06-08days on market $189,000 Active 128 DOM
-
2026-06-07days on market $189,000 Active 127 DOM
-
2026-06-05days on market $189,000 Active 124 DOM
-
2026-06-03days on market $189,000 Active 123 DOM
-
2026-06-02days on market $189,000 Active 122 DOM
-
2026-06-01days on market $189,000 Active 121 DOM
-
2026-05-31days on market $189,000 Active 120 DOM
-
2026-05-30days on market $189,000 Active 119 DOM
-
2026-04-15price $189,000 219-char remark
Show marketing remark (219 chars)
Located close to, schools, restaurants, shopping, and I81, this rental property is a great investment opportunity or your new home. This townhouse has 2 bedrooms and 2.5 baths and as a rental it earned $1,400 per month.
-
2026-04-03status Active 219-char remark
Show marketing remark (219 chars)
Located close to, schools, restaurants, shopping, and I81, this rental property is a great investment opportunity or your new home. This townhouse has 2 bedrooms and 2.5 baths and as a rental it earned $1,400 per month.
-
2026-03-26status Pending 219-char remark
Show marketing remark (219 chars)
Located close to, schools, restaurants, shopping, and I81, this rental property is a great investment opportunity or your new home. This townhouse has 2 bedrooms and 2.5 baths and as a rental it earned $1,400 per month.
-
2026-03-09price $193,000 219-char remark
Show marketing remark (219 chars)
Located close to, schools, restaurants, shopping, and I81, this rental property is a great investment opportunity or your new home. This townhouse has 2 bedrooms and 2.5 baths and as a rental it earned $1,400 per month.
-
2026-01-22$195,000 Active 219-char remark
Show marketing remark (219 chars)
Located close to, schools, restaurants, shopping, and I81, this rental property is a great investment opportunity or your new home. This townhouse has 2 bedrooms and 2.5 baths and as a rental it earned $1,400 per month.
-
2025-07-03historical $1,400
-
2025-07-03historical
-
2025-06-20$195,000 Active
-
2025-06-06price $1,400
-
2025-05-15$1,500
-
2025-05-05historical $1,500
-
2025-04-08$1,500
-
2024-09-06soldstatus $175,000 Closed
-
2024-09-06soldstatus $175,000
-
2024-08-04status Pending
-
2024-05-04price $175,000
-
2024-01-24status Active
-
2024-01-11status Pending
-
2024-01-10$195,000 Active
ⓘ Source: listings_history table (triggers on properties + properties_extension) + one-shot
backfill from property_details.listing_events for pre-trigger history.
Tax reassessment forecast VA · Resets to sale price
- Current annual tax
- $861 · $72/mo
- Projected year-2 tax
- $1,550 · $129/mo
- Expected delta
- +$689/yr (+$57/mo · 80.0%)
ⓘ Screening estimate from a state-policy table — verify with the county assessor before closing.
Climate risk First Street
- Flood 1/10 Low FEMA zone X (unshaded) · 0% chance over 30 yrs
- Wildfire 4/10 Moderate
- Heat 3/10 Moderate 7 d/yr ≥95°F today · 19 d/yr by 30 yrs out
- Wind 2/10 Low 100% chance of damaging wind over 30 yrs
- Air quality 1/10 Low 0 unhealthy d/yr today · 0 by 30 yrs out
Nearby sold comps map
Loading sold comps map…
Walkable amenities ~0.75 mi
Loading nearby amenities…
Taxation est. · year 1
- Rental income
- $18,521
- − Mortgage interest
- −$10,587
- − Property taxes
- −$861
- − Insurance
- −$945
- − Repairs & maintenance
- −$1,482
- − Management
- −$1,482
- − Depreciation
- −$5,498
- Taxable loss
- −$2,334
- Est. tax savings @ 24.0%
- +$560
- After-tax cash flow
- $1,492/yr
For passive investors: Depreciation is non-cash, so a rental often shows a tax loss while cash-flowing — sheltering income. Rental losses are passive: they offset passive income freely, and up to $25,000/yr can offset ordinary (W-2) income if you actively participate and your MAGI is under $100k (phasing out to $0 by $150k); unused losses carry forward. On sale, claimed depreciation is recaptured at up to 25%, and gains may owe capital-gains tax (a 1031 exchange can defer both). Figures are a year-1 estimate at your 24.0% rate — not tax advice; consult a CPA.
Schools (NCES district)
- District
- Montgomery County Public School District
- NCES district ID
- 5102520
- Math proficiency
- 57% ▼ -29.00%
- Reading proficiency
- 70% ▼ -11.00%
- Median HH income
- $46,618
- Composite
- 53.6/100
- National rank
- #1440
- State rank
- #47 of 131 in VA
Livability — Christiansburg
- Score
- 81/100
- State rank
- #53
- US rank
- #1452
Category grades
Schools grade is shown separately in the Schools card above.
Census & demographics
- Census place
- Christiansburg, VA
- County
- Montgomery County · 78,218 people
- City population
- 29,677
- Metro
- Blacksburg-Christiansburg, VA
- Population (ZIP)
- 29,677
- Household income
- $76,800
- Rent vs Own
- Severe rent burden
- 861.0
Population outlook (Montgomery County) Hauer SSP2
- Today (2025)
- 105,748 people
- By 2030
- 110,301 · +4.3%
- By 2040
- 115,652 · +9.4%
- By 2050
- 119,651 · +13.1%
- By 2075
- 126,005 · +19.2%
- By 2100
- 129,771 · +22.7%
Race, ethnicity, and origin ACS 2023
- Neighborhood character
- Predominantly White (86%)
- Race & ethnicity
- White 86% Two or more races 5% Black 4% Hispanic / Latino 4% Asian 3%
- Common ancestry
- Italian 3% Slovak 3% Serbian 2%
- Foreign-born
- 5% · Canada, South Korea, Jamaica
- Languages at home
- 94% English-only · Spanish 3% Other Indo-European 2% Korean 1%
Political lean MEDSL · Montgomery
- 2024 margin
- Toss-up / Even · D 50.9% · R 47.4% · Other 1.7%
- 2008→2024 swing
- -1.4pp toward R · 2008: 4.9pp · 2024: 3.5pp
- All cycles
- 2024: D+3.5 2020: D+5.8 2016: D+1.3 2012: R+0.2 2008: D+4.9
Not yet ingested
- Civics
- —
Market trends
- HPI YoY
- ▼ -94.98%
- Current HPI
- 267.2504
- Rent YoY
- ▲ 1.05%
- Metro
- Blacksburg-Christiansburg, VA
- State GDP YoY
- ▲ 2.40%
- F500 in state
- 50
Industry mix (Fortune 500 HQ in VA)
| Industry | F500 HQs | Revenue |
|---|---|---|
| Aerospace / Defense | 4 | $236B |
|
||
| Technology / Defense | 3 | $32B |
|
||
| Financial Services | 2 | $176B |
|
||
| Utilities | 2 | $27B |
|
||
| Insurance | 2 | $25B |
|
||
| Technology | 2 | $15B |
|
||
Price history
-3.1% since first listed19 events — show timeline
- 2026-04-15 Price Changed $189,000 NRVMLS
- 2026-04-03 Relisted — NRVMLS
- 2026-03-26 Pending — NRVMLS
- 2026-03-09 Price Changed $193,000 NRVMLS
- 2026-01-22 Listed $195,000 NRVMLS
- 2025-07-03 Rental Removed $1,400 MLSRV
- 2025-07-03 Listing Removed — MLSRV
- 2025-06-20 Listed $195,000 MLSRV
- 2025-06-06 Price Changed $1,400 MLSRV
- 2025-05-15 Listed for Rent $1,500 MLSRV
- 2025-05-05 Rental Removed $1,500 MLSRV
- 2025-04-08 Listed for Rent $1,500 MLSRV
- 2024-09-06 Sold (Public Records) $175,000 Public Records
- 2024-09-06 Sold (MLS) $175,000 NRVMLS
- 2024-08-04 Pending — NRVMLS
- 2024-05-04 Price Changed $175,000 NRVMLS
- 2024-01-24 Relisted — NRVMLS
- 2024-01-11 Pending — NRVMLS
- 2024-01-10 Listed $195,000 NRVMLS
Property tax history
-0.3%/yrLatest (2025): $861 · +1.3% YoY. Source: county tax records.
Cash-flow waterfall
monthlySold comps — $/sqft
last 12 mo · ≤1 miLoading sold comps…