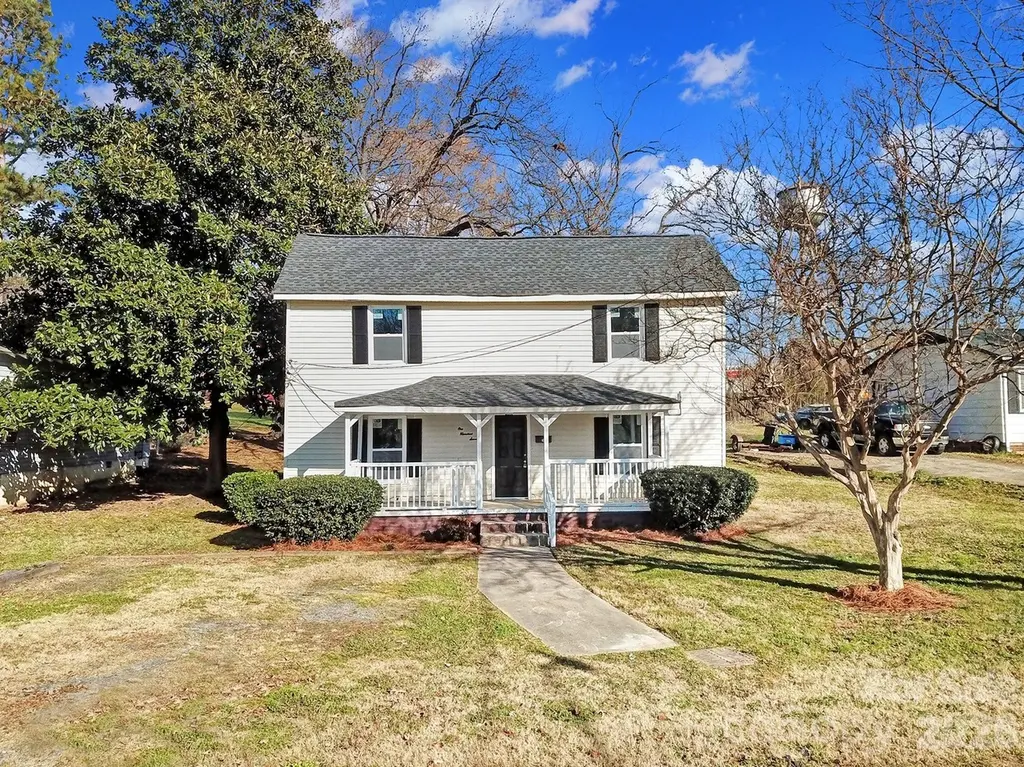
107 E Georgia Ave · Bessemer City, NC
Flood risk 1/10 · Minimal
- FEMA flood zone
- X (unshaded)
- Chance of flooding over 30 yrs
- 0.0%
- Est. flood insurance / yr
- $473 – $860
Fire risk 3/10 · Minor
- Est. fire insurance / yr
- $906 – $1,684
Heat risk 6/10 · Moderate
- Hot days now (above 103°F)
- 7 days/yr
- Hot days in 30 yrs
- 17 days/yr
Wind risk 4/10 · Minor
- Chance of severe wind over 30 yrs
- 13.0%
Air-quality risk 3/10 · Minor
- Unhealthy air days now
- 2 days/yr
- Unhealthy air days in 30 yrs
- 4 days/yr
Risk factors via First Street. Map © Google.
Why this score? — see what drove the D+ grade
The composite is a weighted blend of 9 inputs, each scored 0–100. Each bar is that input's sub-score; the figure is the points it added to the 100-point composite (weight × sub-score).
- ARV discount +15.0/15.0
- Cash flow +14.9/30.0
- DSCR +4.6/10.0
- Schools +3.6/10.0
- 1% rule +3.3/10.0
- Livability +2.9/5.0
- Rent growth +2.5/5.0
- Condition / age +2.5/5.0
- Appreciation +0.0/10.0
$174,900
🖨 Deal sheet (PDF) 📄 Offer letter ✓ Due diligence
Listing remarks
Welcome home to this charming three-bedroom residence offering a comfortable and functional layout with one bedroom on the main level and two additional bedrooms upstairs. Freshly updated throughout, the home features new flooring, fresh paint, and several thoughtful upgrades including some new plumbing, new fixtures, a new sink disposal, and a new water heater. The main level provides a welcoming flow with a cozy living room, a bright kitchen, and a dedicated dining room perfect for gatherings. A spacious mud room adds everyday convenience with laundry hookups and direct access to the backyard. Enjoy relaxing on the covered front porch, ideal for morning coffee or evening unwinding. Additi
Key facts
- New plumbing
- Fresh paint
- New flooring
Tags
Property features AI
Finance
- HOA & community: No HOA
Exterior
- Parking: Driveway
- Utilities: City water; Public sewer; Electricity connected
- Home design: Single-family residence; Residential property; Two levels; Crawl space foundation
- Construction: Site-built construction; Vinyl exterior
- Exterior features: Road access includes dirt, gravel and paved surfaces; Publicly maintained road
Interior
- Kitchen: Electric range
- Bedrooms: 3 bedrooms total (1 on main level, 2 on upper level)
- Bathrooms: 1 full bathroom
- Heating & cooling: Central heating; Central air conditioning
- Interior features: Insulated windows; Mud room
- Laundry & utility: Mud room serves as laundry area
Neighborhood map
What this means for you Summary
Snapshot
- This is a 3-bed/1.0-bath single-family listed at $175k.
Deal economics
- At list price, monthly cash flow is $52 ($618/yr) — positive.
- The deal already cash-flows at list — no discount required.
- To meet the 1% rule (rent ≥ 1% of price), the offer needs to be $144k (17.4% below list).
- Recommended offer: $144k (17.4% below list) — sets the bar for 1% rule.
- Cap rate 6.6% vs local median 3.0% in Bessemer City — top-decile yield for the area; either an underpriced asset or a hidden risk that comps aren't pricing in. Stress-test before assuming the spread holds.
Location & tenants
- Location reads 57/100 on livability (#596 in NC) — a working-class tenant base; expect higher turnover. Strengths: cost of living A+, housing A+; Watch: crime D, amenities F, commute F.
- Gaston County Schools (suburban): math 44% / reading 42% proficiency, ranked #93 of 178 in NC (top 52%) — families likely to look elsewhere, expect single-tenant / working-renter base with shorter leases.
- Zoned schools: Bessemer City Primary (445 students, 99% FRL); Bessemer City Middle (math 30% / reading 30%, grade F, #335 of 475 statewide, top 72%, 500 students, 99% FRL); Bessemer City High (math 37% / reading 32%, grade F, #427 of 535 statewide, top 81%, 566 students, 80% FRL) — zoned schools average 93% FRL vs 37% district-wide (56 pts higher); higher-poverty schools than district average — tighter screening recommended.
- Market conditions: 159 active listings in the ZIP; 5 comparable units currently listed for rent nearby; rentals at typical pace (median 17d on market — plan ~3-4 weeks tenant-placement turnaround); 2,069 units permitted in Gaston County in 2024 (142 in 5+ unit buildings).
- This rent runs 30% of the median local income ($57k/yr) — at the standard rent-burdened threshold; future hikes will face affordability resistance.
Forward outlook
- Local home prices are declining (-3.0%/yr); year-one equity from $1k of loan paydown is wiped out by about $5k of value loss. Plan a longer hold.
- Gaston County population projected at +12% by 2050 — modest demand growth; plan on rents tracking national, not racing it.
Negotiation context
- It's been on market 90 days — a 6% lower offer ($164k) is reasonable based on typical stale-listing flexibility.
Risks & watch-outs
- Watch-outs: built in 1920 — expect roof / HVAC / electrical / plumbing capex.
- Climate carrying-cost: extreme-heat days projected 7→17/yr by 2055 (HVAC capex compounding) — expect insurance premiums to compound above CPI over the hold.
Questions for the listing agent
- It's been on market 90 days. Have you received any prior offers? Is the seller open to a 17% concession, seller financing, or rate buy-down credit?
- Built in 1920 — when were the roof, HVAC, electrical panel, plumbing, and water heater last replaced?
- Why hasn't it sold? Are there any deal-killer items the seller is aware of (foundation, flood, title, zoning, code violations)?
- Is there a deadline driving the sale (1031 exchange, divorce, estate, relocation)? That informs how much negotiation room exists.
- Schools are F-rated, which usually means shorter tenancies and higher turnover. Who's the typical renter profile here, and what's been the actual vacancy rate?
- Crime grade is D in this area — have there been break-ins, vandalism, or insurance claims at this property in the last 3 years? What carrier currently insures it and at what premium?
- The area grade is low — what's the realistic commute time and amenity access for the typical tenant pool here? Any planned neighborhood developments (good or bad) we should know about?
- What's the average days-on-market for RENTAL listings here right now (not sales)? A rising rental-DOM trend means longer vacancies and softer asking-rent achievability than the comps imply.
- What's the recent tenant-quality profile in this submarket — average credit score on applications, eviction rate, late-payment / NSF rate, and stable-employment percentage? A property-management company in the area should have these aggregated.
- How much new for-sale + rental construction is in the pipeline within 1–3 miles? Heavy new supply typically softens prices + rents 12–24 months out; constrained supply supports both.
Investment metrics
- 1% rule
- 0.83% ✗
- Cap rate
- 6.65%
- Cash-on-cash
- 1.26%
- DSCR
- 1.06
- GRM
- 10.1
CMA / ARV
- ARV (on-the-fly)
- $290,043
- Comps found
- 12
Show comp detail 12 sales within ~0.75 mi
| Address | Dist | Beds/Ba | Sqft | Sold | Price | $/sf | Match |
|---|---|---|---|---|---|---|---|
| 208 Virginia Ave W | 0.30mi | 3/1.0 | 1,460 (+1%) | 4mo | $200,000 | $137 | 80 |
| 104 E Louisiana Ave | 0.10mi | 3/2.0 | 1,255 (-13%) | 1mo | $255,000 | $203 | 68 |
| 211 E Ohio Ave | 0.43mi | 3/2.0 | 1,496 (+4%) | 2mo | $283,000 | $189 | 68 |
| 420 N 9th St | 0.56mi | 3/2.5 | 1,382 (-4%) | 0mo | $255,000 | $185 | 61 |
| 416 N 9th St | 0.56mi | 3/2.5 | 1,380 (-4%) | 0mo | $260,000 | $188 | 61 |
| 116 N Gould Ave | 0.52mi | 3/2.5 | 1,323 (-8%) | 2mo | $265,500 | $201 | 54 |
| 108 W Iowa Ave | 0.72mi | 4/2.0 (+1) | 1,414 (-2%) | 1mo | $325,000 | $230 | 54 |
| 112 N Gould Ave | 0.52mi | 3/2.5 | 1,323 (-8%) | 3mo | $262,500 | $198 | 53 |
| 605 E Hartford Ave | 0.67mi | 3/2.0 | 1,336 (-7%) | 3mo | $269,900 | $202 | 50 |
| 124 E Iowa Ave | 0.67mi | 3/2.0 | 1,245 (-14%) | 1mo | $260,000 | $209 | 41 |
| 601 N 12th St | 0.56mi | 2/2.0 (-1) | 1,232 (-15%) | 2mo | $230,000 | $187 | 39 |
| 608 E Boston Ave | 0.66mi | 3/2.5 | 1,234 (-14%) | 1mo | $249,900 | $203 | 38 |
Match score weights: distance 35% · size 25% · config 20% · recency 20%. Top-matched comps best support the ARV.
Projected returns pro-forma
-3.0% appreciation · 3.0% rent growth · sell at horizon
- IRR
- -14.3%
- Equity multiple
- 0.49×
- Total profit
- $-25,112
- Equity at exit
- $26,078
- IRR
- -5.6%
- Equity multiple
- 0.64×
- Total profit
- $-17,851
- Equity at exit
- $15,122
Cash invested: $48,972 (down + closing). Projections, not guarantees.
Landlord ↔ Tenant lean methodology
- Overall (STATE)
- 85 Strongly Landlord-Friendly
- State North Carolina
- 85 Strongly Landlord-Friendly · R+3
- County
- — inherits STATE
- City
- — inherits STATE
ZIP-level market 28016
- Home prices YoY
- -22.1%
- Active inventory
- 159
- Price-to-rent
- 10.1×
Monthly cashflow live
- Estimated rent
- $1,444 high interval (Pro) →
- Mortgage (P&I)
- −$917
- Tax from tax record
- −$100 /mo · $1,194/yr
- Insurance
- −$73
- HOA
- −$0
- Vacancy / Maint / Mgmt
- −$303
- Net cashflow
- $52
Break-even live
Sensitivity live
| Price | -10% $151 | -5% $101 | +0% $52 | +5% $2 | +10% $-47 |
|---|---|---|---|---|---|
| Rent | -10% $-63 | -5% $-6 | +0% $52 | +5% $109 | +10% $166 |
| Rate | -1.0pp $140 | -0.5pp $96 | base $52 | +0.5pp $6 | +1.0pp $-40 |
UW: 25.0% down · 7.5% · 30yr · 1.5% tax · 5.0% vac · 8.0% maint · 8.0% mgmt
Financing live
Cash to close
- Down payment
- $43,725
- Closing costs
- $5,247
- Reserves months
- —
- Total cash needed
- —
Loan-product check · same deal, 3 products live
Conventional
25% down · 7.5% · 30yr
- Down + closing
- —
- Monthly P&I
- —
- Monthly cashflow
- —
- DSCR
- —
- Eligible?
- —
Personal DTI + credit; lowest rate.
DSCR
20% down · 8.5% · 30yr
- Down + closing
- —
- Monthly P&I
- —
- Monthly cashflow
- —
- DSCR
- —
- Eligible?
- —
No personal income docs; deal must DSCR.
Hard money
10% down · 12.0% · 12mo
- Down + closing
- —
- Monthly P&I
- —
- Monthly cashflow
- —
- DSCR
- —
- Eligible?
- —
Short-term bridge; refi at stabilization.
Rent comps 5 comps
| Address | Beds | Baths | Sqft | Rent | $/sqft | DOM | Units | Dist |
|---|---|---|---|---|---|---|---|---|
| 107 S Inman Ave Bessemer City, NC | 2.0 | 1.0 | 880 | $1,250 | $1.42 | 16d | 1 | 0.41mi |
| 425 E Washington Ave Unit 401-202 Bessemer City, NC | 2.0 | 2.0 | 900 | $1,150 | $1.28 | 0d | 1 | 0.51mi |
| 505 Caswell Ave Bessemer City, NC | 3.0 | 2.0 | 1170 | $1,575 | $1.35 | 26d | 1 | 0.89mi |
| 1000 Heather Ct Bessemer City, NC | 2.0–3.0 | 1.0–1.5 | 928 | $1,618 | $1.74 | 26d | 10 | 1.15mi |
| 445 Bess Town Rd Bessemer City, NC | 3.0 | 1.0 | 1010 | $1,250 | $1.24 | 16d | 1 | 1.45mi |
Listing history 18 events
-
2026-06-21days on market $174,900 Active 90 DOM
-
2026-06-18days on market $174,900 Active 87 DOM
-
2026-06-17days on market $174,900 Active 86 DOM
-
2026-06-16days on market $174,900 Active 85 DOM
-
2026-06-15days on market $174,900 Active 84 DOM
-
2026-06-13days on market $174,900 Active 82 DOM
-
2026-06-09days on market $174,900 Active 78 DOM
-
2026-06-08days on market $174,900 Active 77 DOM
-
2026-06-07days on market $174,900 Active 76 DOM
-
2026-06-04days on market $174,900 Active 73 DOM
-
2026-06-03days on market $174,900 Active 72 DOM
-
2026-06-02days on market $174,900 Active 71 DOM
-
2026-06-01days on market $174,900 Active 70 DOM
-
2026-05-31days on market $174,900 Active 69 DOM
-
2026-03-16$174,900 Active
-
2023-10-26soldstatus $300,000
-
2023-07-22historical
-
1999-09-17soldstatus $18,000
ⓘ Source: listings_history table (triggers on properties + properties_extension) + one-shot
backfill from property_details.listing_events for pre-trigger history.
Tax reassessment forecast NC · Resets to sale price
- Current annual tax
- $1,194 · $100/mo
- Projected year-2 tax
- $1,434 · $120/mo
- Expected delta
- +$240/yr (+$20/mo · 20.1%)
ⓘ Screening estimate from a state-policy table — verify with the county assessor before closing.
Climate risk First Street
- Flood 1/10 Low FEMA zone X (unshaded) · 0% chance over 30 yrs
- Wildfire 3/10 Moderate
- Heat 6/10 Major 7 d/yr ≥103°F today · 17 d/yr by 30 yrs out
- Wind 4/10 Moderate 13% chance of damaging wind over 30 yrs
- Air quality 3/10 Moderate 2 unhealthy d/yr today · 4 by 30 yrs out
Nearby sold comps map
Loading sold comps map…
Walkable amenities ~0.75 mi
Loading nearby amenities…
Taxation est. · year 1
- Rental income
- $17,333
- − Mortgage interest
- −$9,797
- − Property taxes
- −$1,194
- − Insurance
- −$874
- − Repairs & maintenance
- −$1,387
- − Management
- −$1,387
- − Depreciation
- −$5,088
- Taxable loss
- −$2,394
- Est. tax savings @ 24.0%
- +$575
- After-tax cash flow
- $1,193/yr
For passive investors: Depreciation is non-cash, so a rental often shows a tax loss while cash-flowing — sheltering income. Rental losses are passive: they offset passive income freely, and up to $25,000/yr can offset ordinary (W-2) income if you actively participate and your MAGI is under $100k (phasing out to $0 by $150k); unused losses carry forward. On sale, claimed depreciation is recaptured at up to 25%, and gains may owe capital-gains tax (a 1031 exchange can defer both). Figures are a year-1 estimate at your 24.0% rate — not tax advice; consult a CPA.
Schools (NCES district)
- District
- Gaston County Schools
- NCES district ID
- 3701620
- Math proficiency
- 44% ▲ 4.00%
- Reading proficiency
- 42% ▲ 1.00%
- Median HH income
- $43,644
- Composite
- 36.39/100
- National rank
- #4680
- State rank
- #93 of 178 in NC
Livability — Bessemer City
- Score
- 57/100
- State rank
- #596
- US rank
- #21724
Category grades
Schools grade is shown separately in the Schools card above.
Census & demographics
- Census place
- Bessemer City, NC
- County
- Gaston County · 201,497 people
- City population
- 13,109
- Metro
- Charlotte-Concord-Gastonia, NC-SC
- Population (ZIP)
- 13,109
- Household income
- $57,147
- Rent vs Own
- Severe rent burden
- 310.0
Population outlook (Gaston County) Hauer SSP2
- Today (2025)
- 230,027 people
- By 2030
- 237,300 · +3.2%
- By 2040
- 249,659 · +8.5%
- By 2050
- 257,806 · +12.1%
- By 2075
- 272,163 · +18.3%
- By 2100
- 268,652 · +16.8%
Race, ethnicity, and origin ACS 2023
- Neighborhood character
- Predominantly White (83%)
- Race & ethnicity
- White 83% Black 7% Hispanic / Latino 6% Two or more races 5%
- Hispanic origin (detail)
- Mexican 2% Puerto Rican 1%
- Common ancestry
- Serbian 3% Slovak 2% Italian 1%
- Foreign-born
- 3% · Canada
- Languages at home
- 94% English-only · Spanish 5%
Political lean MEDSL · Gaston
- 2024 margin
- Strong R (+25.0) · D 37.0% · R 62.1%
- 2008→2024 swing
- 0.0pp no change · 2008: -25.0pp · 2024: -25.0pp
- All cycles
- 2024: R+25.0 2020: R+27.8 2016: R+32.1 2012: R+25.6 2008: R+25.0
Not yet ingested
- Civics
- —
Market trends
- HPI YoY
- ▼ -68.47%
- Current HPI
- 241.2689
- Rent YoY
- —
- Metro
- Charlotte-Concord-Gastonia, NC-SC
- State GDP YoY
- ▲ 3.28%
- F500 in state
- 26
Industry mix (Fortune 500 HQ in NC)
| Industry | F500 HQs | Revenue |
|---|---|---|
| Financial Services | 2 | $213B |
|
||
| Retail | 2 | $95B |
|
||
| Industrial Conglomerate | 1 | $38B |
|
||
| Metals / Steel | 1 | $35B |
|
||
| Utilities | 1 | $30B |
|
||
| Industrial Machinery | 1 | $19B |
|
||
Price history
+871.7% since first listed4 events — show timeline
- 2026-03-16 Listed $174,900 CANOPYMLS as Distributed by MLS Grid
- 2023-10-26 Sold (Public Records) $300,000 Public Records
- 2023-07-22 Rental Removed — RENTLY
- 1999-09-17 Sold (Public Records) $18,000 Public Records
Property tax history
+6.8%/yrLatest (2025): $1,194 · +0.0% YoY. Source: county tax records.
Cash-flow waterfall
monthlySold comps — $/sqft
last 12 mo · ≤1 miLoading sold comps…