 🌊 Lakefront
531 W Kalmia Dr #5 · Lake Park, FL
Flood risk 9/10 · Severe
- FEMA flood zone
- X (shaded)
- Chance of flooding over 30 yrs
- 0.99%
- Est. flood insurance / yr
- $507 – $1,088
Fire risk 1/10 · Minimal
- Est. fire insurance / yr
- $947 – $1,759
Heat risk 10/10 · Severe
- Hot days now (above 106°F)
- 7 days/yr
- Hot days in 30 yrs
- 24 days/yr
Wind risk 10/10 · Severe
- Chance of severe wind over 30 yrs
- 99.0%
Air-quality risk 2/10 · Minimal
- Unhealthy air days now
- 0 days/yr
- Unhealthy air days in 30 yrs
- 1 days/yr
Risk factors via First Street. Map © Google.
Why this score? — see what drove the B- grade
The composite is a weighted blend of 9 inputs, each scored 0–100. Each bar is that input's sub-score; the figure is the points it added to the 100-point composite (weight × sub-score).
- Cash flow +25.2/30.0
- 1% rule +10.0/10.0
- DSCR +8.3/10.0
- ARV discount +7.5/15.0
- Schools +4.3/10.0
- Rent growth +4.0/5.0
- Livability +3.4/5.0
- Condition / age +2.5/5.0
- Appreciation +0.0/10.0
$224,900
🖨 Deal sheet 📄 Offer letter ✓ Due diligence
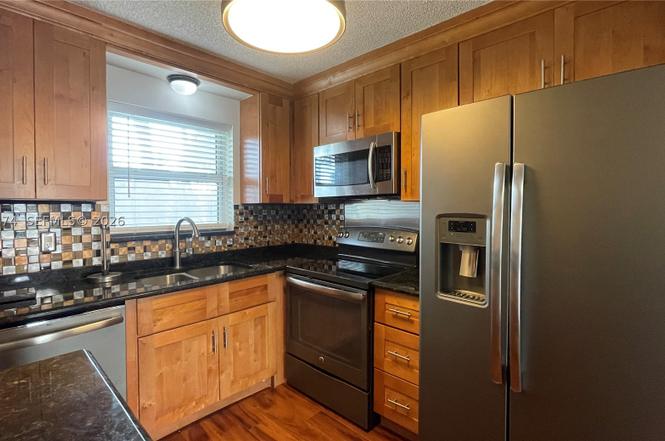
Listing remarks
Amazing Waterfront Access and views from this Hidden Gem of a 2 bed / 2 bath condo. ICW Access from a dedicated boat dock, perfect for small vessels, paddleboarding, kayaking ect. Features include an enclosed patio with access from the Living Room & Master bedroom. Water views from living room & bedrooms, wood throughout. Updated kitchen and bath. Washer and dryer in unit. Water is included in the rent. 1 Parking spot + guest parking, Tenant occupied until 7/31/2026
Key facts
- Water views
- Dedicated boat dock
- Icw access
Tags
Property features AI
Finance
- Other: Waterfront property with Intracoastal access
- Financial info: Pets allowed
- HOA & community: Monthly association fee of $724; Association covers common area maintenance, structure maintenance, and water; Community boat dock
Exterior
- Parking: One designated parking space
- Utilities: Water service included in association fee; Has cooling; Has heating
- Home design: 2-story building; Attached property; Has a view; Entry on level 1; Effective year built
- Construction: Block construction
- Exterior features: Balcony; Deck; Patio; Screened porch
Interior
- Kitchen: Refrigerator
- Bedrooms: Includes a bedroom on the main level
- Flooring: Vinyl
- Bathrooms: 2 full bathrooms
- Heating & cooling: Central air conditioning; Electric heating
- Interior features: First-floor entry; Bedroom on main level
- Laundry & utility: Dryer; Electric water heater
Neighborhood map
What this means for you Summary
Snapshot
- This is a 2-bed/1.5-bath condo listed at $225k.
Deal economics
- At list price, monthly cash flow is $435 ($5k/yr) — positive.
- The deal already cash-flows at list — no discount required.
- Meets the 1% rule at list price ($4k rent vs $225k).
Location & tenants
- Location reads 67/100 on livability (#542 in FL) — a middle-class / working-renter tenant base. Strengths: housing A+, health & safety A+, cost of living A-; Watch: crime F, amenities F, commute F.
- Palm Beach (suburban): math 46% / reading 53% proficiency, ranked #34 of 73 in FL (top 47%) — families likely to look elsewhere, expect single-tenant / working-renter base with shorter leases.
- Market conditions: Rents rising fast (+6.0%/yr); 134 active listings in the ZIP; 10 comparable units currently listed for rent nearby; rentals at typical pace (median 25d on market — plan ~3-4 weeks tenant-placement turnaround); 3,974 units permitted in Palm Beach County in 2024 (1,012 in 5+ unit buildings).
- At $3,560/mo this rent would consume 60% of the median local household income ($71k/yr) (locally 903% of renters already pay >50% of income on rent) — very limited rent-growth headroom before tenants either downsize or default.
Forward outlook
- Local home prices are declining (-3.0%/yr); year-one equity from $2k of loan paydown is wiped out by about $7k of value loss. Plan a longer hold.
- Palm Beach County population projected at +30% by 2050 — long-run rental-demand tailwind backs the buy-and-hold thesis.
- At projected returns (-3.0% appreciation + 6.0% rent growth), your $63k cash investment doubles in ~9 years — after that, you're playing with house money.
Negotiation context
- Only 2 days on market — expect competitive offers; lowballing is unlikely to land.
- Current owner paid $137k; list at $225k implies a 64% gain — meaningful room to come down on a strong offer.
Risks & watch-outs
- Watch-outs: flood insurance adds $66/mo; HOA is 20% of rent.
- Climate carrying-cost: severe flood risk; severe wind risk, 99% chance of damaging wind over 30y; extreme-heat days projected 7→24/yr by 2055 (HVAC capex compounding) — expect insurance premiums to compound above CPI over the hold.
Questions for the listing agent
- Built in 1973 — when were the roof, HVAC, electrical panel, plumbing, and water heater last replaced?
- What's the actual annual flood-insurance premium (NFIP or private), and is the property in a SFHA with mandatory coverage?
- What does the HOA fee cover, when was the last increase, and are there any pending special assessments or reserve-fund shortfalls?
- Any open or pending special assessments — roof, HVAC, plumbing, elevator, façade? What's the per-unit balance and payoff schedule, and is the seller paying it off at close or rolling it to the buyer?
- Is there a deadline driving the sale (1031 exchange, divorce, estate, relocation)? That informs how much negotiation room exists.
- Schools are B-rated — typically a magnet for longer-tenancy family renters. What's the average tenant stay here, and is there a school-zone premium baked into asking?
- Crime grade is F in this area — have there been break-ins, vandalism, or insurance claims at this property in the last 3 years? What carrier currently insures it and at what premium?
- This sits on a lake — are riparian / water-frontage rights deeded with the parcel? Any dock permits, shoreline easements, or HOA water-use restrictions?
- What's the documented flood / surge / shoreline-erosion history here (FEMA AND non-FEMA — e.g., storm surge, creek backup, septic-field saturation)?
- Any water-quality or seasonal algae-bloom issues that affect tenant satisfaction or short-term-rental demand?
- What's the average days-on-market for RENTAL listings here right now (not sales)? A rising rental-DOM trend means longer vacancies and softer asking-rent achievability than the comps imply.
- What's the recent tenant-quality profile in this submarket — average credit score on applications, eviction rate, late-payment / NSF rate, and stable-employment percentage? A property-management company in the area should have these aggregated.
- How much new apartment / multifamily construction is in the pipeline within 1–3 miles? Heavy new supply (>2% of stock underway) typically softens rents 12–24 months out; light construction supports rent growth.
Investment metrics
- 1% rule
- 1.58% ✓
- Cap rate
- 8.97%
- Cash-on-cash
- 9.56%
- DSCR
- 1.43
- GRM
- 5.3
CMA / ARV
No comps found within radius.
Projected returns pro-forma
-3.0% appreciation · 5.97% rent growth · sell at horizon
- IRR
- 1.1%
- Equity multiple
- 1.04×
- Total profit
- $2,803
- Equity at exit
- $33,533
- IRR
- 14.5%
- Equity multiple
- 2.40×
- Total profit
- $88,206
- Equity at exit
- $19,445
Cash invested: $62,972 (down + closing). Projections, not guarantees.
Landlord ↔ Tenant lean methodology
- Overall (STATE)
- 87 Strongly Landlord-Friendly
- State Florida
- 87 Strongly Landlord-Friendly · R+3
- County
- — inherits STATE
- City
- — inherits STATE
ZIP-level market 33403
- Home prices YoY
- -19.6%
- Rents YoY
- 6.0%
- Active inventory
- 134
- Price-to-rent
- 5.3×
Monthly cashflow live
- Estimated rent
- $3,560 high interval (Pro) →
- Mortgage (P&I)
- −$1,179
- Tax from tax record
- −$314 /mo · $3,764/yr
- Insurance
- −$94
- Flood insurance flood zone
- −$66 /mo · $798/yr
- HOA
- −$724
- Vacancy / Maint / Mgmt
- −$748
- Net cashflow
- $435
Break-even live
UW: 25.0% down · 7.5% · 30yr · 1.5% tax · 5.0% vac · 8.0% maint · 8.0% mgmt
Financing live
Cash to close
- Down payment
- $56,225
- Closing costs
- $6,747
- Reserves months
- —
- Total cash needed
- —
Loan-product check · same deal, 3 products live
Conventional
25% down · 7.5% · 30yr
- Down + closing
- —
- Monthly P&I
- —
- Monthly cashflow
- —
- DSCR
- —
- Eligible?
- —
Personal DTI + credit; lowest rate.
DSCR
20% down · 8.5% · 30yr
- Down + closing
- —
- Monthly P&I
- —
- Monthly cashflow
- —
- DSCR
- —
- Eligible?
- —
No personal income docs; deal must DSCR.
Hard money
10% down · 12.0% · 12mo
- Down + closing
- —
- Monthly P&I
- —
- Monthly cashflow
- —
- DSCR
- —
- Eligible?
- —
Short-term bridge; refi at stabilization.
Rent comps 10 comps
| Address | Beds | Baths | Sqft | Rent | $/sqft | DOM | Units | Dist |
|---|---|---|---|---|---|---|---|---|
| 308 Southwind Ct Unit 8 North Palm Beach, FL | 2.0 | 2.0 | 1100 | $2,900 | $2.64 | 24d | 1 | 0.17mi |
| 624 Southwind Cir #2 North Palm Beach, FL | 2.0 | 2.0 | 718 | $3,750 | $5.22 | 24d | 1 | 0.32mi |
| 526 Eastwind Dr Unit 526 North Palm Beach, FL | 2.0 | 1.0 | 840 | $3,995 | $4.76 | 24d | 1 | 0.63mi |
| 522 Eastwind Dr North Palm Beach, FL | 2.0 | 2.0 | 948 | $3,995 | $4.21 | 24d | 1 | 0.63mi |
| 524 Eastwind Dr Unit 524 North Palm Beach, FL | 2.0 | 1.0 | 774 | $3,995 | $5.16 | 24d | 1 | 0.63mi |
| 2545 Conroy Dr West Palm Beach, FL | 3.0 | 2.0 | 1066 | $3,295 | $3.09 | 24d | 1 | 0.64mi |
| 913 Lake Shore Dr Lake Park, FL | 1.0–2.0 | 1.0–2.0 | 1066 | $3,731 | $3.50 | 2d | 9 | 0.83mi |
| 901 W 37th St Riviera Beach, FL | 3.0 | 1.0 | 900 | $2,895 | $3.22 | 24d | 1 | 1.00mi |
| 913 Lighthouse Dr North Palm Beach, FL | 3.0 | 2.5 | 1092 | $5,900 | $5.40 | 24d | 1 | 1.04mi |
| 220 Lake Shore Dr Lake Park, FL | 1.0–3.0 | 1.5–3.5 | 1575 | $14,498 | $9.20 | 5d | 18 | 1.13mi |
HOA detail condo
- Monthly dues
- $724 · $8,688/yr
- Likely covers
- water
- Assessments
- None detected in remarks — confirm with the listing agent.
Listing history 3 events
-
2026-06-18days on market $224,900 Active 2 DOM
-
2026-06-17remarks 474-char remark
-
2026-06-17$224,900 Active 1 DOM
ⓘ Source: listings_history table (triggers on properties + properties_extension) + one-shot
backfill from property_details.listing_events for pre-trigger history.
Tax reassessment forecast FL · Resets to sale price
- Current annual tax
- $3,764 · $314/mo
- Projected year-2 tax
- $3,764 · $314/mo
- Expected delta
- $0/yr ($0/mo · -0.0%)
ⓘ Screening estimate from a state-policy table — verify with the county assessor before closing.
Climate risk First Street
- Flood 9/10 Extreme FEMA zone X (shaded) · 99% chance over 30 yrs
- Wildfire 1/10 Low
- Heat 10/10 Extreme 7 d/yr ≥106°F today · 24 d/yr by 30 yrs out
- Wind 10/10 Extreme 99% chance of damaging wind over 30 yrs
- Air quality 2/10 Low 0 unhealthy d/yr today · 1 by 30 yrs out
Nearby sold comps map
Loading sold comps map…
Walkable amenities ~0.75 mi
Loading nearby amenities…
Taxation est. · year 1
- Rental income
- $42,724
- − Mortgage interest
- −$12,598
- − Property taxes
- −$3,764
- − Insurance
- −$1,922
- − Repairs & maintenance
- −$3,418
- − Management
- −$3,418
- − HOA
- −$8,688
- − Depreciation
- −$6,543
- Taxable income
- $2,373
- Est. tax owed @ 24.0%
- −$570
- After-tax cash flow
- $4,655/yr
For passive investors: Depreciation is non-cash, so a rental often shows a tax loss while cash-flowing — sheltering income. Rental losses are passive: they offset passive income freely, and up to $25,000/yr can offset ordinary (W-2) income if you actively participate and your MAGI is under $100k (phasing out to $0 by $150k); unused losses carry forward. On sale, claimed depreciation is recaptured at up to 25%, and gains may owe capital-gains tax (a 1031 exchange can defer both). Figures are a year-1 estimate at your 24.0% rate — not tax advice; consult a CPA.
Schools (NCES district)
- District
- Palm Beach
- NCES district ID
- 1201500
- Math proficiency
- 46% ▼ -16.00%
- Reading proficiency
- 53% ▼ -4.00%
- Median HH income
- $53,943
- Composite
- 42.72/100
- National rank
- #3160
- State rank
- #34 of 73 in FL
Livability — Lake Park
- Score
- 67/100
- State rank
- #542
- US rank
- #10167
Category grades
Schools grade is shown separately in the Schools card above.
Census & demographics
- Census place
- Lake Park, FL
- County
- Palm Beach County · 1,438,312 people
- City population
- 14,370
- Metro
- Miami-Fort Lauderdale-Pompano Beach, FL
- Population (ZIP)
- 14,370
- Household income
- $70,646
- Rent vs Own
- Severe rent burden
- 903.0
Population outlook (Palm Beach County) Hauer SSP2
- Today (2025)
- 1,637,487 people
- By 2030
- 1,743,255 · +6.5%
- By 2040
- 1,948,712 · +19.0%
- By 2050
- 2,132,979 · +30.3%
- By 2075
- 2,530,027 · +54.5%
- By 2100
- 2,706,979 · +65.3%
Race, ethnicity, and origin ACS 2023
- Neighborhood character
- Diverse neighborhood (Simpson 0.67)
- Race & ethnicity
- Black 46% White 31% Hispanic / Latino 17% Two or more races 12% Asian 2%
- Hispanic origin (detail)
- Mexican 3% Puerto Rican 4% Cuban 5%
- Common ancestry
- Hispanic 15% Italian 2% Romanian 1%
- Foreign-born
- 26% · Canada, China, Jamaica
- Languages at home
- 69% English-only · French/Haitian/Cajun 17% Spanish 12% Chinese 1%
Political lean MEDSL · Palm Beach
- 2024 margin
- Toss-up / Even · D 50.0% · R 49.2%
- 2008→2024 swing
- -22.1pp toward R · 2008: 22.9pp · 2024: 0.8pp
- All cycles
- 2024: D+0.8 2020: D+12.8 2016: D+15.3 2012: D+17.0 2008: D+22.9
Not yet ingested
- Civics
- —
Market trends
- HPI YoY
- ▼ -112.30%
- Current HPI
- 461.4045
- Rent YoY
- ▲ 5.97%
- Metro
- Miami-Fort Lauderdale-Pompano Beach, FL
- State GDP YoY
- ▲ 3.28%
- F500 in state
- 36
Industry mix (Fortune 500 HQ in FL)
| Industry | F500 HQs | Revenue |
|---|---|---|
| Industrial Technology | 2 | $29B |
|
||
| Insurance | 2 | $17B |
|
||
| Retail | 1 | $60B |
|
||
| Technology Distribution | 1 | $58B |
|
||
| Homebuilding | 1 | $35B |
|
||
| Technology Manufacturing | 1 | $35B |
|
||
Price history
+336.7% since first listed4 events — show timeline
- 2026-06-16 Listed $224,900 MARMLS
- 2023-07-07 Rental Removed — APPFOLIO
- 2019-09-27 Sold (Public Records) $137,000 Public Records
- 1992-05-18 Sold (Public Records) $51,500 Public Records
Property tax history
+12.2%/yrLatest (2025): $3,764 · -1.6% YoY. Source: county tax records.
Cash-flow waterfall
monthlySold comps — $/sqft
last 12 mo · ≤1 miLoading sold comps…