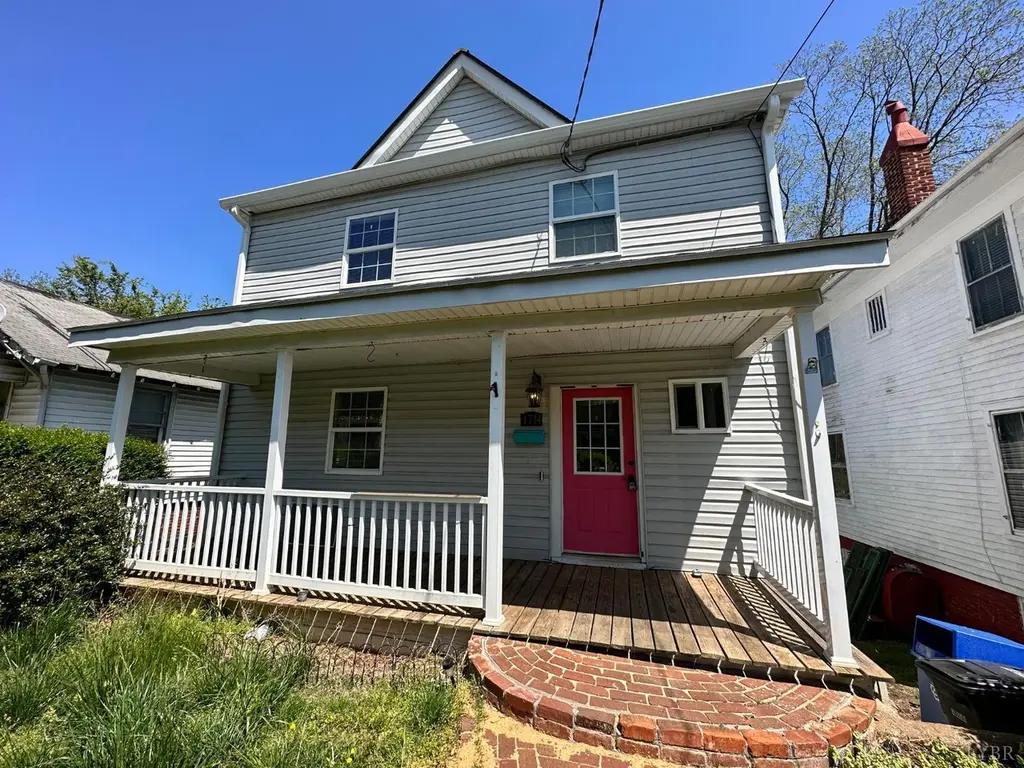
1714 Floyd St · Lynchburg, VA
Flood risk 1/10 · Minimal
- FEMA flood zone
- X (unshaded)
- Chance of flooding over 30 yrs
- 0.0%
- Est. flood insurance / yr
- $473 – $860
Fire risk 2/10 · Minimal
- Est. fire insurance / yr
- $666 – $1,236
Heat risk 5/10 · Moderate
- Hot days now (above 102°F)
- 7 days/yr
- Hot days in 30 yrs
- 18 days/yr
Wind risk 2/10 · Minimal
- Chance of severe wind over 30 yrs
- 2.0%
Air-quality risk 2/10 · Minimal
- Unhealthy air days now
- 0 days/yr
- Unhealthy air days in 30 yrs
- 1 days/yr
Risk factors via First Street. Map © Google.
Why this score? — see what drove the C- grade
The composite is a weighted blend of 9 inputs, each scored 0–100. Each bar is that input's sub-score; the figure is the points it added to the 100-point composite (weight × sub-score).
- Cash flow +17.4/30.0
- ARV discount +10.6/15.0
- DSCR +5.4/10.0
- Livability +4.5/5.0
- Schools +4.0/10.0
- 1% rule +3.8/10.0
- Rent growth +2.8/5.0
- Condition / age +2.5/5.0
- Appreciation +0.0/10.0
$160,000
🖨 Deal sheet 📄 Offer letter ✓ Due diligence
Listing remarks MLS
Attention investors! Add immediate, hassle-free cash flow to your portfolio with this perfectly updated, turn-key single-family rental at 1714 Floyd St. This property is already generating solid income with tenants in place paying $1,300 a month on a steady lease secured through November 2026. You can start collecting rent from day one with absolutely zero deferred maintenance to worry about, as the home has been recently refreshed from top to bottom. Recent capital improvements include plush new carpet, updated appliances, secure new exterior doors, and multiple replaced windows to ensure great energy efficiency. The bathrooms have also been tastefully modernized with brand-new vanities and toilets. Don't miss this rare opportunity to acquire a fully updated, income-producing asset where all the hard work and tenant placement has already been done for you. Add this reliable performer to your investment portfolio today!
Key facts
- Updated appliances
- Replaced windows
- New toilets
Tags
Neighborhood map
What this means for you Summary
Snapshot
- This is a 3-bed/1.0-bath single-family listed at $160k.
Deal economics
- At list price, monthly cash flow is $121 ($1k/yr) — positive.
- The deal already cash-flows at list — no discount required.
- To meet the 1% rule (rent ≥ 1% of price), the offer needs to be $141k (11.7% below list).
- Recommended offer: $141k (11.7% below list) — sets the bar for 1% rule.
- Cap rate 7.2% vs local median 4.0% in Lynchburg — top-decile yield for the area; either an underpriced asset or a hidden risk that comps aren't pricing in. Stress-test before assuming the spread holds.
Location & tenants
- Location reads 91/100 on livability (#1 in VA, #58 nationally) — a professional / high-income tenant draw. Strengths: amenities A+, commute A+, cost of living A+; Watch: crime C-, employment D+.
- Lynchburg City Public School District (urban): math 36% / reading 61% proficiency, ranked #104 of 131 in VA (top 79%) — families likely to look elsewhere, expect single-tenant / working-renter base with shorter leases; 61% free/reduced lunch — lower-income household profile, screen leases tightly.
- Market conditions: Rents rising (+1.1%/yr); 216 active listings in the ZIP; 38 comparable units currently listed for rent nearby; rentals at typical pace (median 21d on market — plan ~3-4 weeks tenant-placement turnaround); lower-income renter base — watch delinquency; 472 units permitted in Lynchburg city in 2024 (240 in 5+ unit buildings).
- This rent runs 40% of the median local income ($42k/yr) — at the standard rent-burdened threshold; future hikes will face affordability resistance.
Forward outlook
- Local home prices are declining (-3.0%/yr); year-one equity from $1k of loan paydown is wiped out by about $5k of value loss. Plan a longer hold.
- Lynchburg County population projected at +37% by 2050 — long-run rental-demand tailwind backs the buy-and-hold thesis.
Negotiation context
- It's been on market 98 days — a 9% lower offer ($146k) is reasonable based on typical stale-listing flexibility.
- 5 sale attempts since 7y ago with the ask held roughly flat each time — persistent listings suggest the price (not the market) is what's stuck; bring a comps-based counter.
- Current owner paid $95k; list at $160k implies a 68% gain — meaningful room to come down on a strong offer.
Risks & watch-outs
- Watch-outs: built in 1907 — expect roof / HVAC / electrical / plumbing capex.
- Climate carrying-cost: extreme-heat days projected 7→18/yr by 2055 (HVAC capex compounding) — expect insurance premiums to compound above CPI over the hold.
Questions for the listing agent
- It's been on market 98 days. Have you received any prior offers? Is the seller open to a 12% concession, seller financing, or rate buy-down credit?
- Built in 1907 — when were the roof, HVAC, electrical panel, plumbing, and water heater last replaced?
- Why hasn't it sold? Are there any deal-killer items the seller is aware of (foundation, flood, title, zoning, code violations)?
- Is there a deadline driving the sale (1031 exchange, divorce, estate, relocation)? That informs how much negotiation room exists.
- Schools are A-rated — typically a magnet for longer-tenancy family renters. What's the average tenant stay here, and is there a school-zone premium baked into asking?
- What's the average days-on-market for RENTAL listings here right now (not sales)? A rising rental-DOM trend means longer vacancies and softer asking-rent achievability than the comps imply.
- What's the recent tenant-quality profile in this submarket — average credit score on applications, eviction rate, late-payment / NSF rate, and stable-employment percentage? A property-management company in the area should have these aggregated.
- How much new for-sale + rental construction is in the pipeline within 1–3 miles? Heavy new supply typically softens prices + rents 12–24 months out; constrained supply supports both.
Investment metrics
- 1% rule
- 0.88% ✗
- Cap rate
- 7.20%
- Cash-on-cash
- 3.24%
- DSCR
- 1.14
- GRM
- 9.4
CMA / ARV
- ARV (median comp)
- $171,921
- List price
- $160,000
- Delta
- -6.93%
- Verdict
- FAIR
- Comps
- 20 within 1.0 mi
Show comp detail 12 sales within ~0.75 mi
| Address | Dist | Beds/Ba | Sqft | Sold | Price | $/sf | Match |
|---|---|---|---|---|---|---|---|
| 1417 Floyd St | 0.20mi | 3/2.0 | 1,120 (-6%) | 1mo | $203,500 | $182 | 76 |
| 1114 Knight St | 0.19mi | 3/2.0 | 1,085 (-8%) | 0mo | $43,600 | $40 | 73 |
| 1113 18th St | 0.14mi | 3/2.0 | 1,283 (+8%) | 4mo | $54,500 | $42 | 72 |
| 1310 9th St St | 0.58mi | 3/1.5 | 1,138 (-4%) | 2mo | $185,000 | $163 | 63 |
| 1930 Vine Street St | 0.42mi | 3/2.0 | 1,110 (-6%) | 5mo | $112,000 | $101 | 61 |
| 2228 High St | 0.63mi | 2/1.0 (-1) | 1,233 (+4%) | 2mo | $21,500 | $17 | 57 |
| 1900 Park Ave | 0.67mi | 3/1.5 | 1,244 (+5%) | 3mo | $172,000 | $138 | 56 |
| 906 8th Street St | 0.70mi | 3/1.5 | 1,132 (-5%) | 4mo | $135,000 | $119 | 54 |
| 2013 Poplar St | 0.46mi | 3/2.5 | 1,040 (-12%) | 4mo | $176,000 | $169 | 49 |
| 1303 Tilden Ave | 0.64mi | 3/2.0 | 1,040 (-12%) | 3mo | $200,000 | $192 | 43 |
| 2346 Aragon St | 0.68mi | 2/1.0 (-1) | 1,048 (-12%) | 3mo | $139,000 | $133 | 41 |
| 811 Polk St | 0.67mi | 4/1.0 (+1) | 1,036 (-13%) | 2mo | $149,000 | $144 | 41 |
Match score weights: distance 35% · size 25% · config 20% · recency 20%. Top-matched comps best support the ARV.
Projected returns pro-forma
-3.0% appreciation · 1.15% rent growth · sell at horizon
- IRR
- -13.1%
- Equity multiple
- 0.53×
- Total profit
- $-20,842
- Equity at exit
- $23,857
- IRR
- -7.1%
- Equity multiple
- 0.58×
- Total profit
- $-18,618
- Equity at exit
- $13,834
Cash invested: $44,800 (down + closing). Projections, not guarantees.
Landlord ↔ Tenant lean methodology
- Overall (STATE)
- 55 Moderately Landlord-Leaning
- State Virginia
- 55 Moderately Landlord-Leaning · D+2
- County
- — inherits STATE
- City
- — inherits STATE
ZIP-level market 24501
- Rents YoY
- 1.1%
- Active inventory
- 216
- Price-to-rent
- 9.4×
Monthly cashflow live
- Estimated rent
- $1,413 high interval (Pro) →
- Mortgage (P&I)
- −$839
- Tax from tax record
- −$90 /mo · $1,075/yr
- Insurance
- −$67
- HOA
- −$0
- Vacancy / Maint / Mgmt
- −$297
- Net cashflow
- $121
Break-even live
UW: 25.0% down · 7.5% · 30yr · 1.5% tax · 5.0% vac · 8.0% maint · 8.0% mgmt
Financing live
Cash to close
- Down payment
- $40,000
- Closing costs
- $4,800
- Reserves months
- —
- Total cash needed
- —
Loan-product check · same deal, 3 products live
Conventional
25% down · 7.5% · 30yr
- Down + closing
- —
- Monthly P&I
- —
- Monthly cashflow
- —
- DSCR
- —
- Eligible?
- —
Personal DTI + credit; lowest rate.
DSCR
20% down · 8.5% · 30yr
- Down + closing
- —
- Monthly P&I
- —
- Monthly cashflow
- —
- DSCR
- —
- Eligible?
- —
No personal income docs; deal must DSCR.
Hard money
10% down · 12.0% · 12mo
- Down + closing
- —
- Monthly P&I
- —
- Monthly cashflow
- —
- DSCR
- —
- Eligible?
- —
Short-term bridge; refi at stabilization.
Rent comps 38 comps
| Address | Beds | Baths | Sqft | Rent | $/sqft | DOM | Units | Dist |
|---|---|---|---|---|---|---|---|---|
| 1308 16th St Lynchburg, VA | 3.0 | 2.0 | 1380 | $1,800 | $1.30 | 13d | 1 | 0.08mi |
| 1521 Taylor St Lynchburg, VA | 3.0 | 1.0 | 1337 | $1,195 | $0.89 | 21d | 1 | 0.14mi |
| 1415 Floyd St Lynchburg, VA | 3.0 | 2.0 | 1300 | $1,800 | $1.38 | 21d | 1 | 0.20mi |
| 1219 Pierce St Unit 1221 Lynchburg, VA | 2.0 | 1.0 | 1168 | $825 | $0.71 | 13d | 1 | 0.35mi |
| 1810 Laurel St Lynchburg, VA | 2.0 | 1.0 | 720 | $995 | $1.38 | 43d | 1 | 0.35mi |
| 1401 Kemper St Lynchburg, VA | 2.0–3.0 | 2.0 | 1118 | $1,167 | $1.04 | 21d | 6 | 0.40mi |
| 1105 Fillmore St Unit B Lynchburg, VA | 3.0 | 1.0 | 1300 | $1,250 | $0.96 | 43d | 1 | 0.43mi |
| 1106 Pierce St Lynchburg, VA | 3.0 | 2.0 | 1018 | $875 | $0.86 | 21d | 1 | 0.43mi |
| 900 Polk St Unit A Lynchburg, VA | 3.0 | 1.0 | 1100 | $895 | $0.81 | 13d | 1 | 0.62mi |
| 2269 Aragon St Lynchburg, VA | 3.0 | 2.0 | 1200 | $1,695 | $1.41 | 43d | 1 | 0.65mi |
| 1008 8th St Lynchburg, VA | 3.0 | 2.0 | 1316 | $1,795 | $1.36 | 21d | 1 | 0.67mi |
| 2336 Aragon St Lynchburg, VA | 2.0 | 1.0 | 1042 | $995 | $0.95 | 13d | 1 | 0.67mi |
| 1500 Main St Lynchburg, VA | 1.0–2.0 | 1.0 | 1182 | $1,600 | $1.35 | 13d | 6 | 0.74mi |
| 2518 Carter St Lynchburg, VA | 3.0 | 2.0 | 1091 | $1,500 | $1.37 | 43d | 1 | 0.80mi |
| 1625 Shaffer St Lynchburg, VA | 2.0 | 1.0 | 895 | $850 | $0.95 | 43d | 1 | 0.81mi |
| 601 Jackson St Lynchburg, VA | 3.0 | 2.0 | 1138 | $1,595 | $1.40 | 43d | 1 | 0.82mi |
| 2107 Park Ave Unit 4 Lynchburg, VA | 2.0 | 1.0 | 800 | $785 | $0.98 | 13d | 1 | 0.84mi |
| 2205 Easley Ave Lynchburg, VA | 2.0 | 2.0 | 870 | $1,400 | $1.61 | 43d | 1 | 0.86mi |
| 512 Polk St Lynchburg, VA | 3.0 | 1.0 | 1340 | $1,295 | $0.97 | 21d | 1 | 0.86mi |
| 403 Grove St Lynchburg, VA | 3.0 | 2.0 | 1400 | $1,600 | $1.14 | 43d | 1 | 0.88mi |
| 2021 Rose Ln Lynchburg, VA | 2.0 | 1.0 | 836 | $1,095 | $1.31 | 21d | 1 | 0.91mi |
| 801 Church St Unit 8 Lynchburg, VA | 2.0 | 2.0 | 875 | $1,850 | $2.11 | 13d | 1 | 0.91mi |
| 317 Grove St Unit A Lynchburg, VA | 2.0 | 1.0 | 900 | $895 | $0.99 | 43d | 1 | 0.91mi |
| 2734 Fort Ave Lynchburg, VA | 1.0–2.0 | 1.0–2.0 | 875 | $1,450 | $1.66 | 43d | 1 | 0.92mi |
| 318 Wadsworth St Lynchburg, VA | 3.0 | 1.0 | 943 | $995 | $1.06 | 21d | 1 | 0.93mi |
| 905 Centerdale St Lynchburg, VA | 2.0 | 1.0 | 780 | $895 | $1.15 | 13d | 1 | 0.97mi |
| 317 Polk St Lynchburg, VA | 3.0 | 2.0 | 925 | $1,650 | $1.78 | 43d | 1 | 0.97mi |
| 630 Park Ln Lynchburg, VA | 4.0 | 1.5 | 1434 | $1,895 | $1.32 | 13d | 1 | 0.99mi |
| 612 Commerce St Lynchburg, VA | 1.0–2.0 | 1.0–2.0 | 716 | $1,250 | $1.74 | 13d | 2 | 1.09mi |
| 216 Kenyon St Lynchburg, VA | 2.0 | 1.0 | 1114 | $995 | $0.89 | 43d | 1 | 1.10mi |
| 209 Munford St Lynchburg, VA | 3.0 | 2.5 | 1420 | $1,497 | $1.05 | 44d | 1 | 1.10mi |
| 1705 1st St Unit A Lynchburg, VA | 2.0 | 1.0 | 1100 | $1,395 | $1.27 | 21d | 1 | 1.15mi |
| 2210 Haden St Lynchburg, VA | 2.0 | 1.0 | 784 | $1,050 | $1.34 | 43d | 1 | 1.28mi |
| 803 Mansfield Ave Lynchburg, VA | 2.0 | 1.0 | 900 | $1,300 | $1.44 | 21d | 1 | 1.32mi |
| 2205 Mayflower Dr Lynchburg, VA | 3.0 | 1.0 | 1500 | $1,450 | $0.97 | 21d | 1 | 1.40mi |
| 106 Yeardley Ave Unit B Lynchburg, VA | 3.0 | 1.0 | 1060 | $895 | $0.84 | 21d | 1 | 1.41mi |
| 2920 Richmond St Lynchburg, VA | 4.0 | 1.0 | 1472 | $1,695 | $1.15 | 21d | 1 | 1.45mi |
| 507 Victoria Ave Unit 507 Lynchburg, VA | 4.0 | 2.0 | 1480 | $1,700 | $1.15 | 21d | 1 | 1.48mi |
Listing history 29 events
-
2026-06-19days on market $160,000 Active 98 DOM
-
2026-06-18days on market $160,000 Active 97 DOM
-
2026-06-17days on market $160,000 Active 96 DOM
-
2026-06-16days on market $160,000 Active 95 DOM
-
2026-06-15days on market $160,000 Active 94 DOM
-
2026-06-14days on market $160,000 Active 92 DOM
-
2026-06-13days on market $160,000 Active 91 DOM
-
2026-06-10days on market $160,000 Active 89 DOM
-
2026-06-09days on market $160,000 Active 88 DOM
-
2026-06-08days on market $160,000 Active 87 DOM
-
2026-06-07days on market $160,000 Active 86 DOM
-
2026-06-03days on market $160,000 Active 82 DOM
-
2026-06-02days on market $160,000 Active 81 DOM
-
2026-06-01days on market $160,000 Active 80 DOM
-
2026-05-31days on market $160,000 Active 79 DOM
-
2026-05-30days on market $160,000 Active 78 DOM
-
2026-03-12$160,000 Active 933-char remark
Show marketing remark (933 chars)
Attention investors! Add immediate, hassle-free cash flow to your portfolio with this perfectly updated, turn-key single-family rental at 1714 Floyd St. This property is already generating solid income with tenants in place paying $1,300 a month on a steady lease secured through November 2026. You can start collecting rent from day one with absolutely zero deferred maintenance to worry about, as the home has been recently refreshed from top to bottom. Recent capital improvements include plush new carpet, updated appliances, secure new exterior doors, and multiple replaced windows to ensure great energy efficiency. The bathrooms have also been tastefully modernized with brand-new vanities and toilets. Don't miss this rare opportunity to acquire a fully updated, income-producing asset where all the hard work and tenant placement has already been done for you. Add this reliable performer to your investment portfolio today!
-
2025-11-16historical $1,295
-
2025-09-16$1,295
-
2023-03-10soldstatus $95,000
-
2023-03-09soldstatus $95,000 Closed 260-char remark
Show marketing remark (260 chars)
Close to downtown at an affordable price! The primary suite is on the second story with two bedrooms and a full bath on the main floor. Plenty of storage space in the unfinished basement. The house's major systems have all been updated and it is move-in ready!
-
2023-02-08status Pending 260-char remark
Show marketing remark (260 chars)
Close to downtown at an affordable price! The primary suite is on the second story with two bedrooms and a full bath on the main floor. Plenty of storage space in the unfinished basement. The house's major systems have all been updated and it is move-in ready!
-
2023-01-24price $115,000 260-char remark
Show marketing remark (260 chars)
Close to downtown at an affordable price! The primary suite is on the second story with two bedrooms and a full bath on the main floor. Plenty of storage space in the unfinished basement. The house's major systems have all been updated and it is move-in ready!
-
2022-12-06price $119,900 260-char remark
Show marketing remark (260 chars)
Close to downtown at an affordable price! The primary suite is on the second story with two bedrooms and a full bath on the main floor. Plenty of storage space in the unfinished basement. The house's major systems have all been updated and it is move-in ready!
-
2022-10-31$121,500 Active 260-char remark
Show marketing remark (260 chars)
Close to downtown at an affordable price! The primary suite is on the second story with two bedrooms and a full bath on the main floor. Plenty of storage space in the unfinished basement. The house's major systems have all been updated and it is move-in ready!
-
2020-08-21soldstatus $86,900
-
2020-08-18soldstatus $86,900
-
2019-12-11$84,900
-
2019-04-26$99,900
ⓘ Source: listings_history table (triggers on properties + properties_extension) + one-shot
backfill from property_details.listing_events for pre-trigger history.
Tax reassessment forecast VA · Resets to sale price
- Current annual tax
- $1,075 · $90/mo
- Projected year-2 tax
- $1,312 · $109/mo
- Expected delta
- +$237/yr (+$20/mo · 22.0%)
ⓘ Screening estimate from a state-policy table — verify with the county assessor before closing.
Climate risk First Street
- Flood 1/10 Low FEMA zone X (unshaded) · 0% chance over 30 yrs
- Wildfire 2/10 Low
- Heat 5/10 Major 7 d/yr ≥102°F today · 18 d/yr by 30 yrs out
- Wind 2/10 Low 2% chance of damaging wind over 30 yrs
- Air quality 2/10 Low 0 unhealthy d/yr today · 1 by 30 yrs out
Nearby sold comps map
Loading sold comps map…
Walkable amenities ~0.75 mi
Loading nearby amenities…
Taxation est. · year 1
- Rental income
- $16,959
- − Mortgage interest
- −$8,962
- − Property taxes
- −$1,075
- − Insurance
- −$800
- − Repairs & maintenance
- −$1,357
- − Management
- −$1,357
- − Depreciation
- −$4,655
- Taxable loss
- −$1,247
- Est. tax savings @ 24.0%
- +$299
- After-tax cash flow
- $1,753/yr
For passive investors: Depreciation is non-cash, so a rental often shows a tax loss while cash-flowing — sheltering income. Rental losses are passive: they offset passive income freely, and up to $25,000/yr can offset ordinary (W-2) income if you actively participate and your MAGI is under $100k (phasing out to $0 by $150k); unused losses carry forward. On sale, claimed depreciation is recaptured at up to 25%, and gains may owe capital-gains tax (a 1031 exchange can defer both). Figures are a year-1 estimate at your 24.0% rate — not tax advice; consult a CPA.
Schools (NCES district)
- District
- Lynchburg City Public School District
- NCES district ID
- 5102340
- Math proficiency
- 36% ▼ -38.00%
- Reading proficiency
- 61% ▼ -8.00%
- Median HH income
- $39,097
- Composite
- 40.4/100
- National rank
- #3730
- State rank
- #104 of 131 in VA
Livability — Lynchburg
- Score
- 91/100
- State rank
- #1
- US rank
- #58
Category grades
Schools grade is shown separately in the Schools card above.
Census & demographics
- Census place
- Lynchburg, VA
- County
- Lynchburg City · 97,036 people
- City population
- 97,036
- Metro
- Lynchburg, VA
- Population (ZIP)
- 25,006
- Household income
- $42,222
- Rent vs Own
- Severe rent burden
- 1717.0
Population outlook (Lynchburg County) Hauer SSP2
- Today (2025)
- 87,977 people
- By 2030
- 93,626 · +6.4%
- By 2040
- 106,145 · +20.7%
- By 2050
- 120,783 · +37.3%
- By 2075
- 162,249 · +84.4%
- By 2100
- 191,358 · +117.5%
Race, ethnicity, and origin ACS 2023
- Neighborhood character
- Diverse neighborhood (Simpson 0.55)
- Race & ethnicity
- White 58% Black 34% Two or more races 4% Hispanic / Latino 3%
- Common ancestry
- Slovak 1% Italian 1% Serbian 1%
- Foreign-born
- 3% · Canada
- Languages at home
- 96% English-only · Spanish 2%
Political lean MEDSL · Lynchburg
- 2024 margin
- Lean R (+7.9) · D 45.4% · R 53.3% · Other 1.3%
- 2008→2024 swing
- -3.9pp toward R · 2008: -4.0pp · 2024: -7.9pp
- All cycles
- 2024: R+7.9 2020: D+2.6 2016: R+9.0 2012: R+10.6 2008: R+4.0
Not yet ingested
- Civics
- —
Market trends
- HPI YoY
- ▼ -131.06%
- Current HPI
- 223.6839
- Rent YoY
- ▲ 1.15%
- Metro
- Lynchburg, VA
- State GDP YoY
- ▲ 2.40%
- F500 in state
- 50
Industry mix (Fortune 500 HQ in VA)
| Industry | F500 HQs | Revenue |
|---|---|---|
| Aerospace / Defense | 4 | $236B |
|
||
| Technology / Defense | 3 | $32B |
|
||
| Financial Services | 2 | $176B |
|
||
| Utilities | 2 | $27B |
|
||
| Insurance | 2 | $25B |
|
||
| Technology | 2 | $15B |
|
||
Price history
+60.2% since first listed13 events — show timeline
- 2026-03-12 Listed $160,000 LMLS
- 2025-11-16 Rental Removed $1,295 SHOWMOJO
- 2025-09-16 Listed for Rent $1,295 SHOWMOJO
- 2023-03-10 Sold (Public Records) $95,000 Public Records
- 2023-03-09 Sold (MLS) $95,000 LMLS
- 2023-02-08 Pending — LMLS
- 2023-01-24 Price Changed $115,000 LMLS
- 2022-12-06 Price Changed $119,900 LMLS
- 2022-10-31 Listed $121,500 LMLS
- 2020-08-21 Sold (MLS) $86,900 LMLS
- 2020-08-18 Sold (Public Records) $86,900 Public Records
- 2019-12-11 Listed $84,900 LMLS
- 2019-04-26 Listed $99,900 LMLS
Property tax history
+24.7%/yrLatest (2025): $1,075 · +16.2% YoY. Source: county tax records.
Cash-flow waterfall
monthlySold comps — $/sqft
last 12 mo · ≤1 miLoading sold comps…