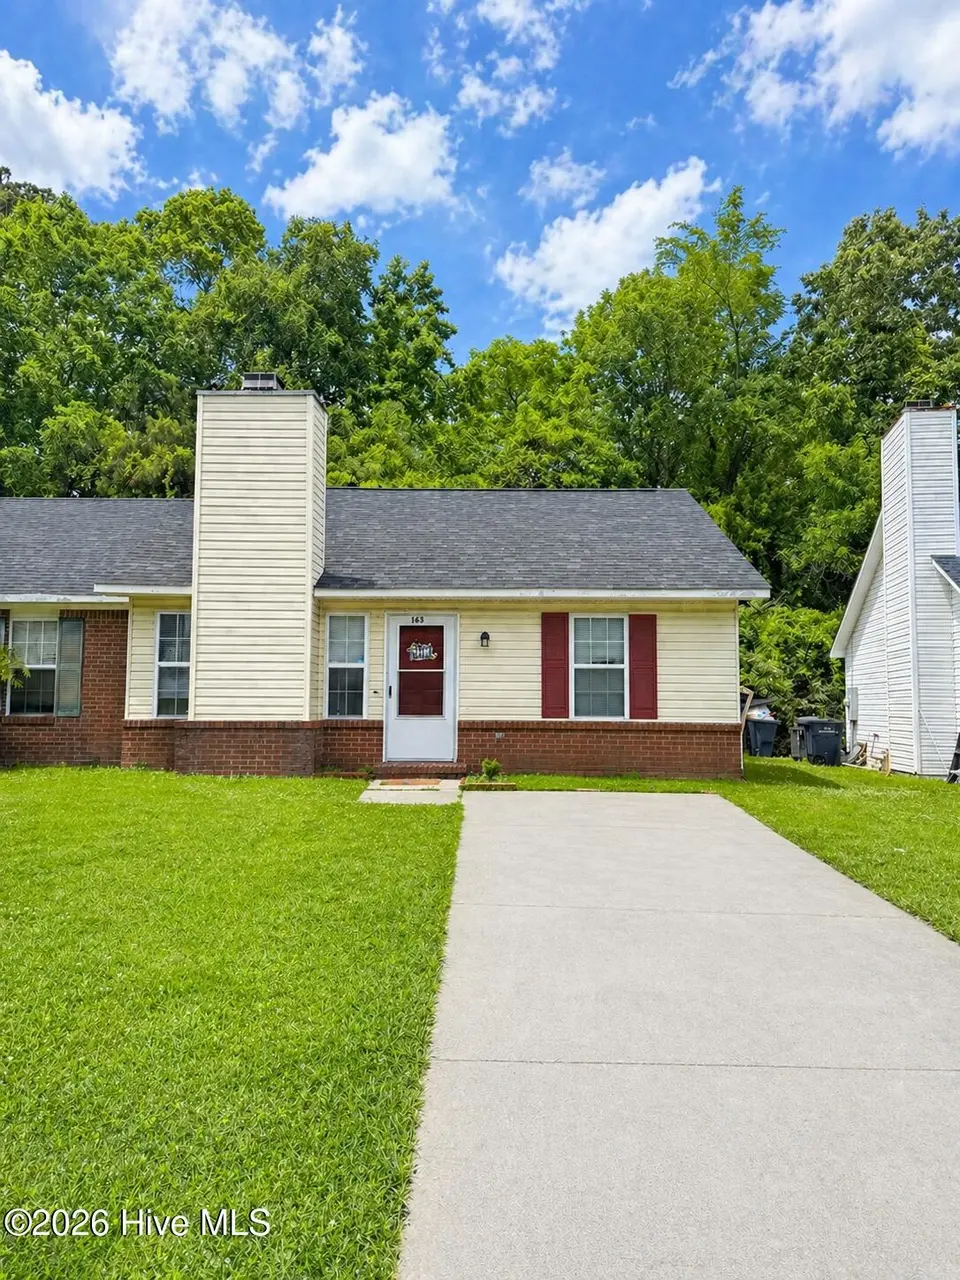
163 Brenda Dr · Jacksonville, NC
Flood risk 1/10 · Minimal
- FEMA flood zone
- X (unshaded)
- Chance of flooding over 30 yrs
- 0.0%
- Est. flood insurance / yr
- $507 – $1,088
Fire risk 3/10 · Minor
- Est. fire insurance / yr
- $906 – $1,684
Heat risk 8/10 · Major
- Hot days now (above 107°F)
- 7 days/yr
- Hot days in 30 yrs
- 18 days/yr
Wind risk 8/10 · Major
- Chance of severe wind over 30 yrs
- 98.0%
Air-quality risk 3/10 · Minor
- Unhealthy air days now
- 2 days/yr
- Unhealthy air days in 30 yrs
- 3 days/yr
Risk factors via First Street. Map © Google.
Why this score? — see what drove the D- grade
The composite is a weighted blend of 9 inputs, each scored 0–100. Each bar is that input's sub-score; the figure is the points it added to the 100-point composite (weight × sub-score).
- Cash flow +13.7/30.0
- DSCR +4.2/10.0
- Schools +3.9/10.0
- Livability +3.6/5.0
- Rent growth +3.5/5.0
- 1% rule +2.9/10.0
- Condition / age +2.5/5.0
- ARV discount +1.8/15.0
- Appreciation +0.0/10.0
$165,000
🖨 Deal sheet (PDF) 📄 Offer letter ✓ Due diligence
Listing remarks
Charming 2-bedroom, 2-bath townhome conveniently located in the heart of Jacksonville! Enjoy easy access to shopping, dining, schools, and nearby military bases. This well-maintained home features a functional layout perfect for comfortable living. Major updates include a new roof (2025) and HVAC system (2023), offering peace of mind for years to come. Whether you're a first-time buyer, investor, or looking to downsize, this property is a fantastic opportunity in a prime location!
Key facts
- Functional layout
- Built 1995
- Listed 53 days
Tags
Property features AI
Finance
- Other: Zoning: RMF-LD; Paved roads with city street and state road frontage; Lot is approximately 0.15 acres (irregular)
- HOA & community: No association amenities
Exterior
- Parking: On-site parking
- Security: Smoke detector(s)
- Utilities: Public water; Sewer connected; Water connected
- Home design: Duplex; Townhouse (residential); One level; Entry on level 1
- Construction: Brick veneer, vinyl siding, and frame construction; Slab foundation; Built with shingle roof
- Exterior features: Patio; Back yard fencing; Some areas without fencing; Shingle roof; Has view
Interior
- Kitchen: Electric oven; Refrigerator; Dishwasher
- Bedrooms: Total rooms: 4
- Flooring: Carpet; Vinyl
- Bathrooms: 2 full bathrooms
- Heating & cooling: Heat pump; Electric heating; Has cooling
- Interior features: High ceilings; Eat-in kitchen; Window coverings; Vented exhaust fan
- Laundry & utility: Washer hookup; Laundry room
Neighborhood map
What this means for you Summary
Snapshot
- This is a 2-bed/2.0-bath townhouse listed at $165k.
Deal economics
- At list price, monthly cash flow is $13 ($156/yr) — positive.
- The deal already cash-flows at list — no discount required.
- To meet the 1% rule (rent ≥ 1% of price), the offer needs to be $131k (20.6% below list).
- Recommended offer: $131k (20.6% below list) — sets the bar for 1% rule.
- Cap rate 6.4% vs local median 4.4% in Jacksonville — top-decile yield for the area; either an underpriced asset or a hidden risk that comps aren't pricing in. Stress-test before assuming the spread holds.
Location & tenants
- Location reads 71/100 on livability (#111 in NC) — a middle-class / working-renter tenant base. Strengths: cost of living A+, housing A+, health & safety A+; Watch: employment D, crime F, amenities F.
- Onslow County Schools (other): math 42% / reading 49% proficiency, ranked #84 of 178 in NC (top 47%) — families likely to look elsewhere, expect single-tenant / working-renter base with shorter leases.
- Zoned schools: Parkwood Elementary (math 62% / reading 62%, grade B, #179 of 1,410 statewide, top 14%, 503 students, 52% FRL); Northwoods Park Middle (math 34% / reading 46%, grade F, #222 of 475 statewide, top 49%, 688 students, 52% FRL); Jacksonville High (math 52% / reading 66%, grade C+, #233 of 535 statewide, top 44%, 1,423 students, 44% FRL).
- Market conditions: Rents rising (+3.9%/yr); 612 active listings in the ZIP; 17 comparable units currently listed for rent nearby; rentals at typical pace (median 23d on market — plan ~3-4 weeks tenant-placement turnaround); 1,246 units permitted in Onslow County in 2024 (0 in 5+ unit buildings).
Forward outlook
- Local home prices are declining (-3.0%/yr); year-one equity from $1k of loan paydown is wiped out by about $5k of value loss. Plan a longer hold.
Negotiation context
- It's been on market 53 days — a 3% lower offer ($160k) is reasonable based on typical stale-listing flexibility.
- Current owner paid $84k; list at $165k implies a 96% gain — meaningful room to come down on a strong offer.
Risks & watch-outs
- Climate carrying-cost: severe wind risk, 98% chance of damaging wind over 30y; extreme-heat days projected 7→18/yr by 2055 (HVAC capex compounding) — expect insurance premiums to compound above CPI over the hold.
Questions for the listing agent
- It's been on market 53 days. Have you received any prior offers? Is the seller open to a 21% concession, seller financing, or rate buy-down credit?
- Is there a deadline driving the sale (1031 exchange, divorce, estate, relocation)? That informs how much negotiation room exists.
- Crime grade is F in this area — have there been break-ins, vandalism, or insurance claims at this property in the last 3 years? What carrier currently insures it and at what premium?
- The area grade is low — what's the realistic commute time and amenity access for the typical tenant pool here? Any planned neighborhood developments (good or bad) we should know about?
- What's the average days-on-market for RENTAL listings here right now (not sales)? A rising rental-DOM trend means longer vacancies and softer asking-rent achievability than the comps imply.
- What's the recent tenant-quality profile in this submarket — average credit score on applications, eviction rate, late-payment / NSF rate, and stable-employment percentage? A property-management company in the area should have these aggregated.
- How much new for-sale + rental construction is in the pipeline within 1–3 miles? Heavy new supply typically softens prices + rents 12–24 months out; constrained supply supports both.
Investment metrics
- 1% rule
- 0.79% ✗
- Cap rate
- 6.39%
- Cash-on-cash
- 0.34%
- DSCR
- 1.02
- GRM
- 10.5
CMA / ARV
- ARV (on-the-fly)
- $146,412
- Comps found
- 12
Show comp detail 12 sales within ~0.75 mi
| Address | Dist | Beds/Ba | Sqft | Sold | Price | $/sf | Match |
|---|---|---|---|---|---|---|---|
| 116 Creekview Dr | 0.42mi | 2/2.0 | 916 (+4%) | 4mo | $165,000 | $180 | 71 |
| 115 Creekview Dr | 0.39mi | 2/2.0 | 937 (+6%) | 8mo | $164,900 | $176 | 65 |
| 100 Brenda Dr | 0.18mi | 2/1.0 | 983 (+12%) | 11mo | $149,900 | $152 | 59 |
| 100 Pisgah Ct | 0.44mi | 2/2.5 | 980 (+11%) | 2mo | $159,000 | $162 | 58 |
| 27 E Doris Ave #111 | 0.59mi | 2/1.5 | 992 (+12%) | 2mo | $164,900 | $166 | 48 |
| 113 Highland Ct | 0.62mi | 2/2.0 | 944 (+7%) | 17mo | $145,000 | $154 | 45 |
| 27 E Doris Ave #207 | 0.58mi | 2/1.5 | 992 (+12%) | 7mo | $168,000 | $169 | 44 |
| 338 Bracken Pl | 0.63mi | 2/1.5 | 992 (+12%) | 4mo | $155,000 | $156 | 44 |
| 120 Croatan Ct | 0.48mi | 2/2.5 | 1,008 (+14%) | 14mo | $165,000 | $164 | 40 |
| 27 E Doris Ave #205 | 0.58mi | 2/1.5 | 992 (+12%) | 13mo | $168,000 | $169 | 40 |
| 27 E Doris Ave #201 | 0.58mi | 2/1.5 | 993 (+13%) | 15mo | $167,000 | $168 | 37 |
| 319 Bracken Pl | 0.66mi | 2/2.5 | 992 (+12%) | 21mo | $150,000 | $151 | 29 |
Match score weights: distance 35% · size 25% · config 20% · recency 20%. Top-matched comps best support the ARV.
Projected returns pro-forma
-3.0% appreciation · 3.86% rent growth · sell at horizon
- IRR
- -14.9%
- Equity multiple
- 0.46×
- Total profit
- $-24,817
- Equity at exit
- $24,602
- IRR
- -5.1%
- Equity multiple
- 0.65×
- Total profit
- $-15,983
- Equity at exit
- $14,266
Cash invested: $46,200 (down + closing). Projections, not guarantees.
Landlord ↔ Tenant lean methodology
- Overall (STATE)
- 85 Strongly Landlord-Friendly
- State North Carolina
- 85 Strongly Landlord-Friendly · R+3
- County
- — inherits STATE
- City
- — inherits STATE
ZIP-level market 28546
- Home prices YoY
- -19.3%
- Rents YoY
- 3.9%
- Active inventory
- 612
- Price-to-rent
- 10.5×
Monthly cashflow live
- Estimated rent
- $1,310 high interval (Pro) →
- Mortgage (P&I)
- −$865
- Tax from tax record
- −$88 /mo · $1,053/yr
- Insurance
- −$69
- HOA
- −$0
- Vacancy / Maint / Mgmt
- −$275
- Net cashflow
- $13
Break-even live
Sensitivity live
| Price | -10% $106 | -5% $60 | +0% $13 | +5% $-34 | +10% $-80 |
|---|---|---|---|---|---|
| Rent | -10% $-90 | -5% $-39 | +0% $13 | +5% $65 | +10% $117 |
| Rate | -1.0pp $96 | -0.5pp $55 | base $13 | +0.5pp $-30 | +1.0pp $-73 |
UW: 25.0% down · 7.5% · 30yr · 1.5% tax · 5.0% vac · 8.0% maint · 8.0% mgmt
Financing live
Cash to close
- Down payment
- $41,250
- Closing costs
- $4,950
- Reserves months
- —
- Total cash needed
- —
Loan-product check · same deal, 3 products live
Conventional
25% down · 7.5% · 30yr
- Down + closing
- —
- Monthly P&I
- —
- Monthly cashflow
- —
- DSCR
- —
- Eligible?
- —
Personal DTI + credit; lowest rate.
DSCR
20% down · 8.5% · 30yr
- Down + closing
- —
- Monthly P&I
- —
- Monthly cashflow
- —
- DSCR
- —
- Eligible?
- —
No personal income docs; deal must DSCR.
Hard money
10% down · 12.0% · 12mo
- Down + closing
- —
- Monthly P&I
- —
- Monthly cashflow
- —
- DSCR
- —
- Eligible?
- —
Short-term bridge; refi at stabilization.
Rent comps 17 comps
| Address | Beds | Baths | Sqft | Rent | $/sqft | DOM | Units | Dist |
|---|---|---|---|---|---|---|---|---|
| 106 Brenda Dr Jacksonville, NC | 2.0 | 1.0 | 983 | $1,300 | $1.32 | 23d | 1 | 0.14mi |
| 1 S Onsville Pl Jacksonville, NC | 2.0 | 1.5 | 992 | $1,395 | $1.41 | 23d | 1 | 0.21mi |
| 200 Carmen Ave Jacksonville, NC | 1.0–2.0 | 1.0–1.5 | 871 | $1,320 | $1.52 | 15d | 6 | 0.40mi |
| 319 Bracken Pl Jacksonville, NC | 2.0 | 3.0 | 992 | $1,150 | $1.16 | 23d | 1 | 0.63mi |
| 2318 Indian Dr Unit B-7 Jacksonville, NC | 2.0 | 1.0 | 1120 | $995 | $0.89 | 23d | 1 | 0.66mi |
| 2322 Indian Dr Unit A-3 Jacksonville, NC | 2.0 | 1.0 | 1120 | $1,150 | $1.03 | 15d | 1 | 0.67mi |
| 231A Lakewood Dr Jacksonville, NC | 2.0 | 1.0 | 880 | $1,095 | $1.24 | 23d | 1 | 0.94mi |
| 100 Windsor Cir Jacksonville, NC | 3.0 | 1.0–2.5 | 1033 | $1,469 | $1.42 | 15d | 11 | 1.14mi |
| 5049 Western Blvd Jacksonville, NC | 1.0–3.0 | 1.0–2.0 | 1118 | $1,419 | $1.27 | 15d | 1 | 1.17mi |
| 1025 Kensington Dr Jacksonville, NC | 1.0–3.0 | 1.0–2.0 | 1150 | $1,430 | $1.24 | 23d | 1 | 1.22mi |
| 1025 Kensington Dr Jacksonville, NC | 1.0–3.0 | 1.0–2.0 | 1150 | $1,435 | $1.25 | 15d | 8 | 1.22mi |
| 1004 Banister Loop Jacksonville, NC | 2.0 | 2.5 | 1024 | $1,250 | $1.22 | 23d | 1 | 1.23mi |
| 2005 Banister Loop Jacksonville, NC | 2.0 | 2.5 | 1098 | $1,150 | $1.05 | 23d | 1 | 1.25mi |
| 5001 Grandeur Ave Jacksonville, NC | 2.0 | 2.5 | 1024 | $1,350 | $1.32 | 23d | 1 | 1.25mi |
| 508 Henderson Dr Jacksonville, NC | 3.0 | 1.0 | 1050 | $1,400 | $1.33 | 23d | 1 | 1.26mi |
| 100 Delaney Dr Jacksonville, NC | 1.0–3.0 | 1.0–2.0 | 1150 | $1,440 | $1.25 | 15d | 11 | 1.36mi |
| 2015 Gum Branch Rd Jacksonville, NC | 1.0–3.0 | 1.0–2.0 | 1194 | $1,535 | $1.29 | 15d | 17 | 1.44mi |
Listing history 21 events
-
2026-06-21days on market $165,000 Active 53 DOM
-
2026-06-19days on market $165,000 Active 51 DOM
-
2026-06-18days on market $165,000 Active 50 DOM
-
2026-06-17days on market $165,000 Active 49 DOM
-
2026-06-16days on market $165,000 Active 48 DOM
-
2026-06-15days on market $165,000 Active 47 DOM
-
2026-06-14days on market $165,000 Active 45 DOM
-
2026-06-13days on market $165,000 Active 44 DOM
-
2026-06-10days on market $165,000 Active 42 DOM
-
2026-06-09days on market $165,000 Active 41 DOM
-
2026-06-09days on market $165,000 Active 40 DOM
-
2026-06-07days on market $165,000 Active 39 DOM
-
2026-06-03days on market $165,000 Active 35 DOM
-
2026-06-02days on market $165,000 Active 34 DOM
-
2026-06-01days on market $165,000 Active 33 DOM
-
2026-05-31days on market $165,000 Active 32 DOM
-
2026-05-30days on market $165,000 Active 31 DOM
-
2026-04-29$165,000 Active
-
2023-07-04historical
-
2010-12-21soldstatus $84,000
-
2004-03-19soldstatus $51,500
ⓘ Source: listings_history table (triggers on properties + properties_extension) + one-shot
backfill from property_details.listing_events for pre-trigger history.
Tax reassessment forecast NC · Resets to sale price
- Current annual tax
- $1,053 · $88/mo
- Projected year-2 tax
- $1,353 · $113/mo
- Expected delta
- +$300/yr (+$25/mo · 28.5%)
ⓘ Screening estimate from a state-policy table — verify with the county assessor before closing.
Climate risk First Street
- Flood 1/10 Low FEMA zone X (unshaded) · 0% chance over 30 yrs
- Wildfire 3/10 Moderate
- Heat 8/10 Severe 7 d/yr ≥107°F today · 18 d/yr by 30 yrs out
- Wind 8/10 Severe 98% chance of damaging wind over 30 yrs
- Air quality 3/10 Moderate 2 unhealthy d/yr today · 3 by 30 yrs out
Nearby sold comps map
Loading sold comps map…
Walkable amenities ~0.75 mi
Loading nearby amenities…
Taxation est. · year 1
- Rental income
- $15,718
- − Mortgage interest
- −$9,243
- − Property taxes
- −$1,053
- − Insurance
- −$825
- − Repairs & maintenance
- −$1,257
- − Management
- −$1,257
- − Depreciation
- −$4,800
- Taxable loss
- −$2,717
- Est. tax savings @ 24.0%
- +$652
- After-tax cash flow
- $808/yr
For passive investors: Depreciation is non-cash, so a rental often shows a tax loss while cash-flowing — sheltering income. Rental losses are passive: they offset passive income freely, and up to $25,000/yr can offset ordinary (W-2) income if you actively participate and your MAGI is under $100k (phasing out to $0 by $150k); unused losses carry forward. On sale, claimed depreciation is recaptured at up to 25%, and gains may owe capital-gains tax (a 1031 exchange can defer both). Figures are a year-1 estimate at your 24.0% rate — not tax advice; consult a CPA.
Schools (NCES district)
- District
- Onslow County Schools
- NCES district ID
- 3703450
- Math proficiency
- 42% ▲ 6.00%
- Reading proficiency
- 49% ▲ 5.00%
- Median HH income
- $46,076
- Composite
- 38.66/100
- National rank
- #4148
- State rank
- #84 of 178 in NC
Livability — Jacksonville
- Score
- 71/100
- State rank
- #111
- US rank
- #6991
Category grades
Schools grade is shown separately in the Schools card above.
Census & demographics
- Census place
- Jacksonville, NC
- County
- Onslow County · 164,453 people
- City population
- 96,397
- Metro
- Jacksonville, NC
- Population (ZIP)
- 47,256
- Household income
- $63,561
- Rent vs Own
- Severe rent burden
- 1830.0
Population outlook (Onslow County) Hauer SSP2
- Today (2025)
- 189,789 people
- By 2030
- 194,463 · +2.5%
- By 2040
- 193,629 · +2.0%
- By 2050
- 193,248 · +1.8%
- By 2075
- 196,995 · +3.8%
- By 2100
- 201,513 · +6.2%
Race, ethnicity, and origin ACS 2023
- Neighborhood character
- Diverse neighborhood (Simpson 0.62)
- Race & ethnicity
- White 57% Black 18% Hispanic / Latino 16% Two or more races 13% Asian 2%
- Hispanic origin (detail)
- Mexican 5% Puerto Rican 5% Dominican 1%
- Common ancestry
- Romanian 1% Serbian 1% Slovak 1%
- Foreign-born
- 5% · Canada, South Korea
- Languages at home
- 89% English-only · Spanish 8% German/W. Germanic 1% Tagalog/Filipino 1%
Political lean MEDSL · Onslow
- 2024 margin
- Solid R (+35.9) · D 31.5% · R 67.5% · Other 1.0%
- 2008→2024 swing
- -14.5pp toward R · 2008: -21.5pp · 2024: -35.9pp
- All cycles
- 2024: R+35.9 2020: R+30.2 2016: R+34.6 2012: R+27.0 2008: R+21.5
Not yet ingested
- Civics
- —
Market trends
- HPI YoY
- ▼ -50.75%
- Current HPI
- 211.9993
- Rent YoY
- ▲ 3.86%
- Metro
- Jacksonville, NC
- State GDP YoY
- ▲ 3.28%
- F500 in state
- 26
Industry mix (Fortune 500 HQ in NC)
| Industry | F500 HQs | Revenue |
|---|---|---|
| Financial Services | 2 | $213B |
|
||
| Retail | 2 | $95B |
|
||
| Industrial Conglomerate | 1 | $38B |
|
||
| Metals / Steel | 1 | $35B |
|
||
| Utilities | 1 | $30B |
|
||
| Industrial Machinery | 1 | $19B |
|
||
Price history
+220.4% since first listed4 events — show timeline
- 2026-04-29 Listed $165,000 Hive MLS
- 2023-07-04 Rental Removed — APPFOLIO
- 2010-12-21 Sold (Public Records) $84,000 Public Records
- 2004-03-19 Sold (Public Records) $51,500 Public Records
Property tax history
+0.2%/yrLatest (2025): $1,053 · +0.0% YoY. Source: county tax records.
Cash-flow waterfall
monthlySold comps — $/sqft
last 12 mo · ≤1 miLoading sold comps…