3801 NE 22nd Ter #12 · Lighthouse Point, FL
Flood risk 6/10 · Moderate
- FEMA flood zone
- AH
- Chance of flooding over 30 yrs
- 0.65%
- Est. flood insurance / yr
- $1,142 – $2,507
Fire risk 1/10 · Minimal
- Est. fire insurance / yr
- $947 – $1,759
Heat risk 10/10 · Severe
- Hot days now (above 106°F)
- 7 days/yr
- Hot days in 30 yrs
- 25 days/yr
Wind risk 10/10 · Severe
- Chance of severe wind over 30 yrs
- 99.0%
Air-quality risk 2/10 · Minimal
- Unhealthy air days now
- 1 days/yr
- Unhealthy air days in 30 yrs
- 3 days/yr
Risk factors via First Street. Map © Google.
Why this score? — see what drove the D+ grade
The composite is a weighted blend of 9 inputs, each scored 0–100. Each bar is that input's sub-score; the figure is the points it added to the 100-point composite (weight × sub-score).
- Cash flow +16.4/30.0
- ARV discount +7.5/15.0
- 1% rule +7.4/10.0
- DSCR +5.1/10.0
- Schools +4.1/10.0
- Livability +3.6/5.0
- Rent growth +2.9/5.0
- Condition / age +2.5/5.0
- Appreciation +0.0/10.0
$145,000
🖨 Deal sheet 📄 Offer letter ✓ Due diligence
Listing remarks MLS
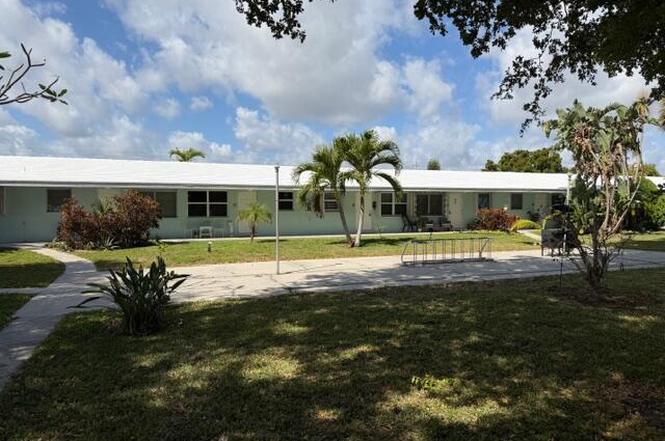
tenant in place who has indicated her interest in renewing her lease . This co op is ideally located in Lighthouse Pt. , close to Publix, Library, and Government services. The building is only one story, and has no age restrictions. The grounds are very expansive with many mature trees and well maintained.
Key facts
- Impact windows
- $266 HOA
- Built 1961
Tags
Property features AI
Finance
- HOA & community: Association with monthly fee (approximately $266.67); HOA covers insurance, grounds maintenance, sewer, trash, water, and common areas; Community of 18 units; Pets allowed (with number and size limits)
Exterior
- Parking: Assigned parking; Guest parking
- Utilities: Public water; Water service available; Sewer included in association services
- Home design: Condominium; Single-story (1 story); Facing east; Resale property
- Construction: CBS construction
- Exterior features: Not waterfront
Interior
- Kitchen: Refrigerator
- Bedrooms: 1 bedroom on the main level
- Bathrooms: 1 full bathroom on the main level
- Heating & cooling: Central heating; Central air; Ceiling fan(s)
- Interior features: Built-in features; Blinds
- Laundry & utility: Community laundry available; Electric water heater
Neighborhood map
What this means for you Summary
Snapshot
- This is a 1-bed/1.0-bath condo listed at $145k.
Deal economics
- At list price, monthly cash flow is $-70 ($-838/yr) — negative.
- To cash-flow at today's rent, offer at most $133k (8.5% below list).
- Meets the 1% rule at list price ($2k rent vs $145k).
- Recommended offer: $132k (9.0% below list) — sets the bar for market timing.
- Cap rate 7.0% vs local median 2.4% in Lighthouse Point — top-decile yield for the area; either an underpriced asset or a hidden risk that comps aren't pricing in. Stress-test before assuming the spread holds.
Location & tenants
- Location reads 71/100 on livability (#384 in FL) — a middle-class / working-renter tenant base. Strengths: crime A+, employment A+, health & safety A+; Watch: amenities F, commute F, cost of living F.
- Broward (suburban): math 42% / reading 53% proficiency, ranked #46 of 73 in FL (top 63%) — families likely to look elsewhere, expect single-tenant / working-renter base with shorter leases.
- Zoned schools: Norcrest Elementary School (math 39% / reading 43%, grade F, #1,454 of 2,144 statewide, top 69%, 672 students, 71% FRL); Deerfield Beach Middle School (math 30% / reading 39%, grade F, #421 of 571 statewide, top 74%, 1,140 students, 72% FRL); Deerfield Beach High School (math 12% / reading 37%, grade F, #505 of 667 statewide, top 79%, 2,251 students, 69% FRL) — zoned schools average 71% FRL vs 51% district-wide (19 pts higher); higher-poverty schools than district average — tighter screening recommended.
- Zoned-school proficiency averages 33% at this address vs 48% district-wide (-14 pts) — the specific schools serving this property underperform the Broward average; the district grade overstates school quality for this exact location.
- Market conditions: Rents rising (+1.8%/yr); 591 active listings in the ZIP; 21 comparable units currently listed for rent nearby; rentals at typical pace (median 24d on market — plan ~3-4 weeks tenant-placement turnaround); 2,111 units permitted in Broward County in 2024 (1,265 in 5+ unit buildings).
- This rent runs 30% of the median local income ($71k/yr) — at the standard rent-burdened threshold; future hikes will face affordability resistance.
Forward outlook
- Local home prices are declining (-3.0%/yr); year-one equity from $1k of loan paydown is wiped out by about $4k of value loss. Plan a longer hold.
- Broward County population projected at +34% by 2050 — long-run rental-demand tailwind backs the buy-and-hold thesis.
Negotiation context
- It's been on market 119 days — a 9% lower offer ($132k) is reasonable based on typical stale-listing flexibility.
- 6 sale attempts since 3y ago; this cycle's ask is 8688% above the opening price — seller raised mid-cycle; expect resistance to lowballs.
Risks & watch-outs
- Watch-outs: flood insurance adds $152/mo.
- Climate carrying-cost: in FEMA flood zone AH (mandatory federal flood insurance); severe wind risk, 99% chance of damaging wind over 30y; extreme-heat days projected 7→25/yr by 2055 (HVAC capex compounding) — expect insurance premiums to compound above CPI over the hold.
Questions for the listing agent
- What do current leases actually rent for vs. the listed asking? Can we see a recent rent roll and the last 12 months of T-12 income?
- It's been on market 119 days. Have you received any prior offers? Is the seller open to a 9% concession, seller financing, or rate buy-down credit?
- Built in 1961 — when were the roof, HVAC, electrical panel, plumbing, and water heater last replaced?
- What's the actual annual flood-insurance premium (NFIP or private), and is the property in a SFHA with mandatory coverage?
- What does the HOA fee cover, when was the last increase, and are there any pending special assessments or reserve-fund shortfalls?
- Any open or pending special assessments — roof, HVAC, plumbing, elevator, façade? What's the per-unit balance and payoff schedule, and is the seller paying it off at close or rolling it to the buyer?
- Why hasn't it sold? Are there any deal-killer items the seller is aware of (foundation, flood, title, zoning, code violations)?
- Is there a deadline driving the sale (1031 exchange, divorce, estate, relocation)? That informs how much negotiation room exists.
- The area grade is low — what's the realistic commute time and amenity access for the typical tenant pool here? Any planned neighborhood developments (good or bad) we should know about?
- What's the average days-on-market for RENTAL listings here right now (not sales)? A rising rental-DOM trend means longer vacancies and softer asking-rent achievability than the comps imply.
- What's the recent tenant-quality profile in this submarket — average credit score on applications, eviction rate, late-payment / NSF rate, and stable-employment percentage? A property-management company in the area should have these aggregated.
- How much new apartment / multifamily construction is in the pipeline within 1–3 miles? Heavy new supply (>2% of stock underway) typically softens rents 12–24 months out; light construction supports rent growth.
Investment metrics
- 1% rule
- 1.24% ✓
- Cap rate
- 6.97%
- Cash-on-cash
- 2.43%
- DSCR
- 1.11
- GRM
- 6.7
CMA / ARV
No comps found within radius.
Projected returns pro-forma
-3.0% appreciation · 1.75% rent growth · sell at horizon
- IRR
- -21.6%
- Equity multiple
- 0.26×
- Total profit
- $-29,846
- Equity at exit
- $21,620
- IRR
- -19.7%
- Equity multiple
- 0.03×
- Total profit
- $-39,311
- Equity at exit
- $12,537
Cash invested: $40,600 (down + closing). Projections, not guarantees.
Landlord ↔ Tenant lean methodology
- Overall (STATE)
- 87 Strongly Landlord-Friendly
- State Florida
- 87 Strongly Landlord-Friendly · R+3
- County
- — inherits STATE
- City
- — inherits STATE
ZIP-level market 33064
- Home prices YoY
- -18.7%
- Rents YoY
- 1.8%
- Active inventory
- 591
- Price-to-rent
- 6.7×
Monthly cashflow live
- Estimated rent
- $1,793 high interval (Pro) →
- Mortgage (P&I)
- −$760
- Tax from tax record
- −$248 /mo · $2,971/yr
- Insurance
- −$60
- Flood insurance flood zone
- −$152 /mo · $1,824/yr
- HOA
- −$266
- Vacancy / Maint / Mgmt
- −$377
- Net cashflow
- $-70
Break-even live
UW: 25.0% down · 7.5% · 30yr · 1.5% tax · 5.0% vac · 8.0% maint · 8.0% mgmt
Financing live
Cash to close
- Down payment
- $36,250
- Closing costs
- $4,350
- Reserves months
- —
- Total cash needed
- —
Loan-product check · same deal, 3 products live
Conventional
25% down · 7.5% · 30yr
- Down + closing
- —
- Monthly P&I
- —
- Monthly cashflow
- —
- DSCR
- —
- Eligible?
- —
Personal DTI + credit; lowest rate.
DSCR
20% down · 8.5% · 30yr
- Down + closing
- —
- Monthly P&I
- —
- Monthly cashflow
- —
- DSCR
- —
- Eligible?
- —
No personal income docs; deal must DSCR.
Hard money
10% down · 12.0% · 12mo
- Down + closing
- —
- Monthly P&I
- —
- Monthly cashflow
- —
- DSCR
- —
- Eligible?
- —
Short-term bridge; refi at stabilization.
Rent comps 21 comps
| Address | Beds | Baths | Sqft | Rent | $/sqft | DOM | Units | Dist |
|---|---|---|---|---|---|---|---|---|
| 3700 NE 22nd Ave Unit 3720-11 Lighthouse Point, FL | 1.0 | 1.0 | 650 | $1,825 | $2.81 | 24d | 1 | 0.10mi |
| 2120 NE 41st St Unit C Lighthouse Point, FL | 1.0 | 1.0 | 650 | $1,675 | $2.58 | 24d | 1 | 0.25mi |
| 2115 NE 42nd Ct Unit 206N Lighthouse Point, FL | 1.0 | 1.0 | 560 | $1,600 | $2.86 | 24d | 1 | 0.47mi |
| 1671 NE 33rd St Unit 3 Pompano Beach, FL | 2.0 | 2.0 | 750 | $2,200 | $2.93 | 24d | 1 | 0.58mi |
| 1671 NE 33rd St Apt 1 Pompano Beach, FL | 1.0 | 1.0 | 750 | $1,650 | $2.20 | 24d | 1 | 0.58mi |
| 1480 E Sample Rd Pompano Beach, FL | 1.0 | 1.0 | 640 | $1,550 | $2.42 | 15d | 2 | 0.69mi |
| 1480 E Sample Rd #207 Pompano Beach, FL | 1.0 | 1.0 | 640 | $1,600 | $2.50 | 24d | 1 | 0.69mi |
| 1751 NE 31st St Pompano Beach, FL | 1.0 | 1.0 | 642 | $1,595 | $2.48 | 15d | 1 | 0.71mi |
| 4611 N Federal Hwy Pompano Beach, FL | 1.0–3.0 | 1.0–2.0 | 969 | $2,110 | $2.18 | 1d | 9 | 0.75mi |
| 1330 NE 41st Dr #2 Pompano Beach, FL | 1.0 | 1.0 | 400 | $1,750 | $4.38 | 10d | 1 | 0.77mi |
| 1901 NE 29th St #2 Lighthouse Point, FL | 1.0 | 1.0 | 700 | $1,600 | $2.29 | 24d | 1 | 0.77mi |
| 2900 NE 17th Ave Pompano Beach, FL | 1.0 | 1.0 | 650 | $1,745 | $2.68 | 11d | 1 | 0.80mi |
| 1960 NE 48th St Unit 9 Pompano Beach, FL | 1.0 | 1.0 | 700 | $1,500 | $2.14 | 22d | 1 | 0.85mi |
| 1850 NE 48th St Pompano Beach, FL | 1.0–3.0 | 1.0–1.5 | 827 | $1,650 | $1.99 | 24d | 1 | 0.86mi |
| 1150 E Sample Rd #202 Pompano Beach, FL | 1.0 | 1.0 | 640 | $1,650 | $2.58 | 24d | 1 | 0.94mi |
| 2234 NE 27th St Lighthouse Point, FL | 1.0 | 1.0 | 500 | $2,250 | $4.50 | 24d | 1 | 0.96mi |
| 1512 NE 28th St Pompano Beach, FL | 2.0 | 1.0 | 624 | $2,500 | $4.01 | 24d | 1 | 1.03mi |
| 3300 NE 10th Ter Pompano Beach, FL | 1.0 | 1.0 | 674 | $1,525 | $2.26 | 15d | 1 | 1.04mi |
| 2633 NE 13th Ave Unit 1 Pompano Beach, FL | 2.0 | 1.0 | 650 | $2,300 | $3.54 | 20d | 1 | 1.24mi |
| 2508 Bay Dr #112 Pompano Beach, FL | 1.0 | 1.0 | 636 | $2,200 | $3.46 | 24d | 1 | 1.36mi |
| 1417 SE 3rd Ter Deerfield Beach, FL | 1.0 | 1.0 | 570 | $1,300 | $2.28 | 10d | 1 | 1.45mi |
HOA detail condo
- Monthly dues
- $266 · $3,192/yr
- Likely covers
- landscaping
- Assessments
- None detected in remarks — confirm with the listing agent.
Listing history 24 events
-
2026-06-18days on market $145,000 Active 119 DOM
-
2026-06-17days on market $145,000 Active 118 DOM
-
2026-06-16days on market $145,000 Active 117 DOM
-
2026-06-15days on market $145,000 Active 116 DOM
-
2026-06-13days on market $145,000 Active 114 DOM
-
2026-06-09days on market $145,000 Active 110 DOM
-
2026-06-07days on market $145,000 Active 108 DOM
-
2026-06-04days on market $145,000 Active 105 DOM
-
2026-06-03days on market $145,000 Active 104 DOM
-
2026-06-02days on market $145,000 Active 103 DOM
-
2026-06-01days on market $145,000 Active 102 DOM
-
2026-05-31days on market $145,000 Active 101 DOM
-
2026-05-11price $145,000
-
2026-03-24$1,650
-
2026-03-24historical $1,650
-
2026-03-05$1,650
-
2026-02-19$170,000 Active
-
2026-02-17historical
-
2025-04-21price $199,900
-
2025-04-16status Active
-
2025-02-18$179,000 Active
-
2024-03-18soldstatus $170,000 Closed 309-char remark
Show marketing remark (309 chars)
tenant in place who has indicated her interest in renewing her lease . This co op is ideally located in Lighthouse Pt. , close to Publix, Library, and Government services. The building is only one story, and has no age restrictions. The grounds are very expansive with many mature trees and well maintained.
-
2024-02-16status Pending 309-char remark
Show marketing remark (309 chars)
tenant in place who has indicated her interest in renewing her lease . This co op is ideally located in Lighthouse Pt. , close to Publix, Library, and Government services. The building is only one story, and has no age restrictions. The grounds are very expansive with many mature trees and well maintained.
-
2023-12-13$170,000 Active 309-char remark
Show marketing remark (309 chars)
tenant in place who has indicated her interest in renewing her lease . This co op is ideally located in Lighthouse Pt. , close to Publix, Library, and Government services. The building is only one story, and has no age restrictions. The grounds are very expansive with many mature trees and well maintained.
ⓘ Source: listings_history table (triggers on properties + properties_extension) + one-shot
backfill from property_details.listing_events for pre-trigger history.
Tax reassessment forecast FL · Resets to sale price
- Current annual tax
- $2,971 · $248/mo
- Projected year-2 tax
- $2,971 · $248/mo
- Expected delta
- $0/yr ($0/mo · 0.0%)
ⓘ Screening estimate from a state-policy table — verify with the county assessor before closing.
Climate risk First Street
- Flood 6/10 Major FEMA zone AH · 65% chance over 30 yrs
- Wildfire 1/10 Low
- Heat 10/10 Extreme 7 d/yr ≥106°F today · 25 d/yr by 30 yrs out
- Wind 10/10 Extreme 99% chance of damaging wind over 30 yrs
- Air quality 2/10 Low 1 unhealthy d/yr today · 3 by 30 yrs out
Nearby sold comps map
Loading sold comps map…
Walkable amenities ~0.75 mi
Loading nearby amenities…
Taxation est. · year 1
- Rental income
- $21,519
- − Mortgage interest
- −$8,122
- − Property taxes
- −$2,971
- − Insurance
- −$2,550
- − Repairs & maintenance
- −$1,721
- − Management
- −$1,721
- − HOA
- −$3,192
- − Depreciation
- −$4,218
- Taxable loss
- −$2,978
- Est. tax savings @ 24.0%
- +$715
- After-tax cash flow
- $-123/yr
For passive investors: Depreciation is non-cash, so a rental often shows a tax loss while cash-flowing — sheltering income. Rental losses are passive: they offset passive income freely, and up to $25,000/yr can offset ordinary (W-2) income if you actively participate and your MAGI is under $100k (phasing out to $0 by $150k); unused losses carry forward. On sale, claimed depreciation is recaptured at up to 25%, and gains may owe capital-gains tax (a 1031 exchange can defer both). Figures are a year-1 estimate at your 24.0% rate — not tax advice; consult a CPA.
Schools (NCES district)
- District
- Broward
- NCES district ID
- 1200180
- Math proficiency
- 42% ▼ -18.00%
- Reading proficiency
- 53% ▼ -5.00%
- Median HH income
- $52,139
- Composite
- 40.88/100
- National rank
- #3621
- State rank
- #46 of 73 in FL
Livability — Lighthouse Point
- Score
- 71/100
- State rank
- #384
- US rank
- #6803
Category grades
Schools grade is shown separately in the Schools card above.
Census & demographics
- Census place
- Lighthouse Point, FL
- County
- Broward County · 1,963,430 people
- Metro
- Miami-Fort Lauderdale-Pompano Beach, FL
- Population (ZIP)
- 64,563
- Household income
- $71,301
- Rent vs Own
- Severe rent burden
- 2907.0
Population outlook (Broward County) Hauer SSP2
- Today (2025)
- 2,207,033 people
- By 2030
- 2,360,704 · +7.0%
- By 2040
- 2,661,208 · +20.6%
- By 2050
- 2,946,698 · +33.5%
- By 2075
- 3,602,273 · +63.2%
- By 2100
- 3,970,984 · +79.9%
Race, ethnicity, and origin ACS 2023
- Neighborhood character
- Highly diverse neighborhood (Simpson 0.75)
- Race & ethnicity
- White 34% Hispanic / Latino 27% Black 25% Two or more races 24% Asian 2%
- Hispanic origin (detail)
- Mexican 4% Puerto Rican 4% Cuban 4% Dominican 2%
- Common ancestry
- Hispanic 13% Estonian 10% Romanian 1%
- Foreign-born
- 43% · Canada, Jamaica, Dominican Republic
- Languages at home
- 45% English-only · Spanish 23% French/Haitian/Cajun 16% Other Indo-European 13%
Political lean MEDSL · Broward
- 2024 margin
- D (+17.0) · D 58.0% · R 41.0%
- 2008→2024 swing
- -17.8pp toward R · 2008: 34.7pp · 2024: 17.0pp
- All cycles
- 2024: D+17.0 2020: D+29.8 2016: D+35.0 2012: D+34.9 2008: D+34.7
Not yet ingested
- Civics
- —
Market trends
- HPI YoY
- ▼ -109.09%
- Current HPI
- 474.7007
- Rent YoY
- ▲ 1.75%
- Metro
- Miami-Fort Lauderdale-Pompano Beach, FL
- State GDP YoY
- ▲ 3.28%
- F500 in state
- 36
Industry mix (Fortune 500 HQ in FL)
| Industry | F500 HQs | Revenue |
|---|---|---|
| Industrial Technology | 2 | $29B |
|
||
| Insurance | 2 | $17B |
|
||
| Retail | 1 | $60B |
|
||
| Technology Distribution | 1 | $58B |
|
||
| Homebuilding | 1 | $35B |
|
||
| Technology Manufacturing | 1 | $35B |
|
||
Price history
-14.7% since first listed12 events — show timeline
- 2026-05-11 Price Changed $145,000 Beaches MLS
- 2026-03-24 Listed for Rent $1,650 RMLSFL
- 2026-03-24 Rental Removed $1,650 RMLSFL
- 2026-03-05 Listed for Rent $1,650 RMLSFL
- 2026-02-19 Listed $170,000 Beaches MLS
- 2026-02-17 Listing Removed — MARMLS
- 2025-04-21 Price Changed $199,900 MARMLS
- 2025-04-16 Relisted — MARMLS
- 2025-02-18 Listed $179,000 MARMLS
- 2024-03-18 Sold (MLS) $170,000 MARMLS
- 2024-02-16 Pending — MARMLS
- 2023-12-13 Listed $170,000 MARMLS
Property tax history
+27.3%/yrLatest (2025): $2,971 · +35.3% YoY. Source: county tax records.
Cash-flow waterfall
monthlySold comps — $/sqft
last 12 mo · ≤1 miLoading sold comps…