 Duplex
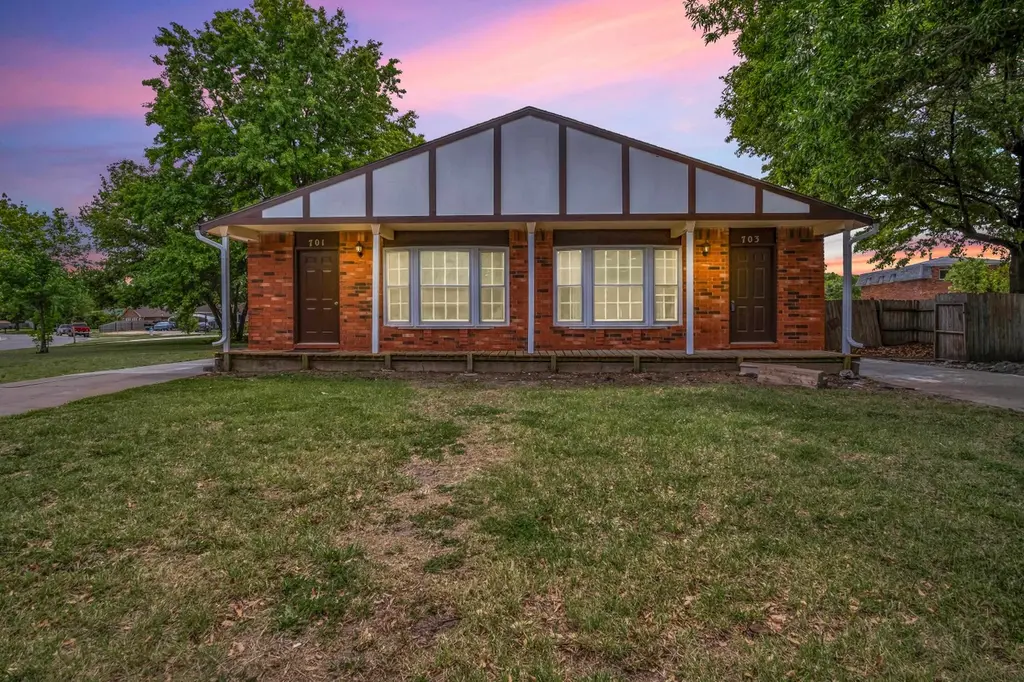
701-703 W 17th St · Newton, KS
Flood risk 1/10 · Minimal
- FEMA flood zone
- X (unshaded)
- Chance of flooding over 30 yrs
- 0.0%
- Est. flood insurance / yr
- $473 – $860
Fire risk 2/10 · Minimal
- Est. fire insurance / yr
- $1,154 – $2,142
Heat risk 5/10 · Moderate
- Hot days now (above 107°F)
- 7 days/yr
- Hot days in 30 yrs
- 18 days/yr
Wind risk 2/10 · Minimal
- Chance of severe wind over 30 yrs
- 0.0%
Air-quality risk 2/10 · Minimal
- Unhealthy air days now
- 2 days/yr
- Unhealthy air days in 30 yrs
- 2 days/yr
Risk factors via First Street. Map © Google.
Why this score? — see what drove the D grade
The composite is a weighted blend of 9 inputs, each scored 0–100. Each bar is that input's sub-score; the figure is the points it added to the 100-point composite (weight × sub-score).
- Cash flow +13.8/30.0
- ARV discount +7.5/15.0
- Rent growth +5.0/5.0
- DSCR +4.2/10.0
- 1% rule +4.0/10.0
- Livability +3.2/5.0
- Condition / age +2.5/5.0
- Schools +2.1/10.0
- Appreciation +0.0/10.0
$220,000
🖨 Deal sheet 📄 Offer letter ✓ Due diligence
Multi-family units
County records classify this as Multi-Family (2-4 Unit). Listing-text estimate: 2 units. confirmed
Key facts
- 0.38 acre lot
- 2 parking spots
- Built 1979
Property features AI
Finance
- Financial info: Owner pays grounds care
Exterior
- Parking: Two parking spaces total; Paved parking; One parking space per unit
- Utilities: Public water; Natural gas available
- Home design: Duplex
- Exterior features: Composition roof
Interior
- Kitchen: Dishwasher, Range, Refrigerator
- Flooring: Carpet; Wood
- Heating & cooling: Natural gas heating; Electric cooling
- Interior features: Finished basement; Carpet and wood flooring; Dishwasher, Range, Refrigerator
Neighborhood map
What this means for you Summary
Snapshot
- This is a 2 × 3-bed/2-bath units multifamily listed at $220k.
Deal economics
- At list price, monthly cash flow is $19 ($229/yr) — positive. Per door: $10/mo.
- The deal already cash-flows at list — no discount required.
- To meet the 1% rule (rent ≥ 1% of price), the offer needs to be $198k (10.0% below list).
- Recommended offer: $198k (10.0% below list) — sets the bar for 1% rule.
Location & tenants
- Location reads 65/100 on livability (#282 in KS) — a middle-class / working-renter tenant base. Strengths: cost of living A+, housing A+, health & safety B+; Watch: crime F, amenities F, commute F.
- Newton (town): math 17% / reading 30% proficiency, ranked #141 of 169 in KS (top 83%) — low school quality limits family demand, transient renter base, plan for 1-2y turnover.
- Zoned schools: Northridge Elementary (math 32% / reading 42%, grade F, #358 of 684 statewide, top 56%, 287 students, 53% FRL); Chisholm Middle School (math 14% / reading 25%, grade F, #152 of 219 statewide, top 72%, 489 students, 58% FRL); Newton Sr High (math 11% / reading 26%, grade F, #232 of 327 statewide, top 71%, 956 students, 51% FRL).
- Market conditions: Rents rising fast (+18.1%/yr); 131 active listings in the ZIP; 148 units permitted in Harvey County in 2024 (13 in 5+ unit buildings).
- This rent runs 34% of the median local income ($70k/yr) — at the standard rent-burdened threshold; future hikes will face affordability resistance.
Forward outlook
- Local home prices are declining (-3.0%/yr); year-one equity from $2k of loan paydown is wiped out by about $7k of value loss. Plan a longer hold.
Negotiation context
- It's been on market 44 days — a 3% lower offer ($213k) is reasonable based on typical stale-listing flexibility.
- 4 sale attempts since 20y ago; this cycle's ask has dropped $40k (15%) from the opening price — seller is motivated, your offer sets the floor, not the list.
- Current owner paid $107k; list at $220k implies a 106% gain — meaningful room to come down on a strong offer.
Risks & watch-outs
- Climate carrying-cost: extreme-heat days projected 7→18/yr by 2055 (HVAC capex compounding) — expect insurance premiums to compound above CPI over the hold.
Questions for the listing agent
- It's been on market 44 days. Have you received any prior offers? Is the seller open to a 10% concession, seller financing, or rate buy-down credit?
- Can we see the unit-by-unit rent roll, current vacancy, and any below-market leases? What's the average tenancy length?
- What capital expenditures (roof, boiler, parking lot, exteriors) have been made in the last 5 years, and what's planned in the next 2?
- Built in 1979 — when were the roof, HVAC, electrical panel, plumbing, and water heater last replaced?
- Is there a deadline driving the sale (1031 exchange, divorce, estate, relocation)? That informs how much negotiation room exists.
- Schools are F-rated, which usually means shorter tenancies and higher turnover. Who's the typical renter profile here, and what's been the actual vacancy rate?
- Crime grade is F in this area — have there been break-ins, vandalism, or insurance claims at this property in the last 3 years? What carrier currently insures it and at what premium?
- The area grade is low — what's the realistic commute time and amenity access for the typical tenant pool here? Any planned neighborhood developments (good or bad) we should know about?
- What's the average days-on-market for RENTAL listings here right now (not sales)? A rising rental-DOM trend means longer vacancies and softer asking-rent achievability than the comps imply.
- What's the recent tenant-quality profile in this submarket — average credit score on applications, eviction rate, late-payment / NSF rate, and stable-employment percentage? A property-management company in the area should have these aggregated.
- How much new apartment / multifamily construction is in the pipeline within 1–3 miles? Heavy new supply (>2% of stock underway) typically softens rents 12–24 months out; light construction supports rent growth.
Investment metrics
- 1% rule
- 0.90% ✗
- Cap rate
- 6.40%
- Cash-on-cash
- 0.37%
- DSCR
- 1.02
- GRM
- 9.3
CMA / ARV
No comps found within radius.
Projected returns pro-forma
-3.0% appreciation · 8.0% rent growth · sell at horizon
- IRR
- -10.2%
- Equity multiple
- 0.61×
- Total profit
- $-23,927
- Equity at exit
- $32,803
- IRR
- 5.1%
- Equity multiple
- 1.46×
- Total profit
- $28,536
- Equity at exit
- $19,022
Cash invested: $61,600 (down + closing). Projections, not guarantees.
Landlord ↔ Tenant lean methodology
- Overall (STATE)
- 83 Strongly Landlord-Friendly
- State Kansas
- 83 Strongly Landlord-Friendly · R+10
- County
- — inherits STATE
- City
- — inherits STATE
ZIP-level market 67114
- Rents YoY
- 18.1%
- Active inventory
- 131
- Price-to-rent
- 18.5×
Monthly cashflow live
- Estimated rent
- $1,980 medium interval (Pro) →
- Mortgage (P&I)
- −$1,154
- Tax from tax record
- −$300 /mo · $3,597/yr
- Insurance
- −$92
- HOA
- −$0
- Vacancy / Maint / Mgmt
- −$416
- Net cashflow
- $19
Break-even live
2-unit breakdown (identical units grouped — click to expand)
| Units | Beds | Baths | Est. rent |
|---|---|---|---|
| 2× units | 3 | 2 | $1,980 |
| #1 | 3 | 2 | $990 |
| #2 | 3 | 2 | $990 |
| Total (2 units) | $1,980 | ||
UW: 25.0% down · 7.5% · 30yr · 1.5% tax · 5.0% vac · 8.0% maint · 8.0% mgmt
Financing live
Cash to close
- Down payment
- $55,000
- Closing costs
- $6,600
- Reserves months
- —
- Total cash needed
- —
Loan-product check · same deal, 3 products live
Conventional
25% down · 7.5% · 30yr
- Down + closing
- —
- Monthly P&I
- —
- Monthly cashflow
- —
- DSCR
- —
- Eligible?
- —
Personal DTI + credit; lowest rate.
DSCR
20% down · 8.5% · 30yr
- Down + closing
- —
- Monthly P&I
- —
- Monthly cashflow
- —
- DSCR
- —
- Eligible?
- —
No personal income docs; deal must DSCR.
Hard money
10% down · 12.0% · 12mo
- Down + closing
- —
- Monthly P&I
- —
- Monthly cashflow
- —
- DSCR
- —
- Eligible?
- —
Short-term bridge; refi at stabilization.
Listing history 22 events
-
2026-06-18days on market $220,000 Active 44 DOM
-
2026-06-17days on market $220,000 Active 43 DOM
-
2026-06-16days on market $220,000 Active 42 DOM
-
2026-06-15days on market $220,000 Active 41 DOM
-
2026-06-14days on market $220,000 Active 39 DOM
-
2026-06-13days on market $220,000 Active 38 DOM
-
2026-06-10days on market $220,000 Active 36 DOM
-
2026-06-09days on market $220,000 Active 35 DOM
-
2026-06-08days on market $220,000 Active 34 DOM
-
2026-06-07days on market $220,000 Active 33 DOM
-
2026-06-03days on market $220,000 Active 29 DOM
-
2026-06-02days on market $220,000 Active 28 DOM
-
2026-06-01days on market $220,000 Active 27 DOM
-
2026-05-31days on market $220,000 Active 26 DOM
-
2026-05-30pricedays on market $220,000 Active 25 DOM
-
2026-05-05$260,000 Active
-
2026-01-11historical
-
2025-07-10$229,000 Active
-
2025-07-10historical
-
2025-06-06$229,000 Active
-
2007-01-01soldstatus $107,000
-
2006-12-12$109,900
ⓘ Source: listings_history table (triggers on properties + properties_extension) + one-shot
backfill from property_details.listing_events for pre-trigger history.
Tax reassessment forecast KS · Resets to sale price
- Current annual tax
- $3,597 · $300/mo
- Projected year-2 tax
- $3,597 · $300/mo
- Expected delta
- $0/yr ($0/mo · 0.0%)
ⓘ Screening estimate from a state-policy table — verify with the county assessor before closing.
Climate risk First Street
- Flood 1/10 Low FEMA zone X (unshaded) · 0% chance over 30 yrs
- Wildfire 2/10 Low
- Heat 5/10 Major 7 d/yr ≥107°F today · 18 d/yr by 30 yrs out
- Wind 2/10 Low 0% chance of damaging wind over 30 yrs
- Air quality 2/10 Low 2 unhealthy d/yr today · 2 by 30 yrs out
Nearby sold comps map
Loading sold comps map…
Walkable amenities ~0.75 mi
Loading nearby amenities…
Taxation est. · year 1
- Rental income
- $23,760
- − Mortgage interest
- −$12,323
- − Property taxes
- −$3,597
- − Insurance
- −$1,100
- − Repairs & maintenance
- −$1,901
- − Management
- −$1,901
- − Depreciation
- −$6,400
- Taxable loss
- −$3,462
- Est. tax savings @ 24.0%
- +$831
- After-tax cash flow
- $1,060/yr
For passive investors: Depreciation is non-cash, so a rental often shows a tax loss while cash-flowing — sheltering income. Rental losses are passive: they offset passive income freely, and up to $25,000/yr can offset ordinary (W-2) income if you actively participate and your MAGI is under $100k (phasing out to $0 by $150k); unused losses carry forward. On sale, claimed depreciation is recaptured at up to 25%, and gains may owe capital-gains tax (a 1031 exchange can defer both). Figures are a year-1 estimate at your 24.0% rate — not tax advice; consult a CPA.
Schools (NCES district)
- District
- Newton
- NCES district ID
- 2009960
- Math proficiency
- 17% ▼ -5.00%
- Reading proficiency
- 30% ▲ 1.00%
- Median HH income
- $47,297
- Composite
- 20.51/100
- National rank
- #8569
- State rank
- #141 of 169 in KS
Livability — Newton
- Score
- 65/100
- State rank
- #282
- US rank
- #12628
Category grades
Schools grade is shown separately in the Schools card above.
Census & demographics
- Census place
- Newton, KS
- County
- Harvey County · 20,919 people
- City population
- 20,919
- Metro
- Wichita, KS
- Population (ZIP)
- 20,919
- Household income
- $70,018
- Rent vs Own
- Severe rent burden
- 612.0
Population outlook (Harvey County) Hauer SSP2
- Today (2025)
- 35,226 people
- By 2030
- 35,287 · +0.2%
- By 2040
- 35,124 · -0.3%
- By 2050
- 34,665 · -1.6%
- By 2075
- 33,716 · -4.3%
- By 2100
- 30,163 · -14.4%
Race, ethnicity, and origin ACS 2023
- Neighborhood character
- Predominantly White (76%)
- Race & ethnicity
- White 76% Hispanic / Latino 18% Two or more races 11% Native American 2% Black 1%
- Hispanic origin (detail)
- Mexican 15%
- Common ancestry
- Romanian 2% Slovak 2% Lithuanian 2%
- Foreign-born
- 3% · Canada
- Languages at home
- 92% English-only · Spanish 7% German/W. Germanic 1%
Political lean MEDSL · Harvey
- 2024 margin
- Strong R (+21.1) · D 38.6% · R 59.6% · Other 1.8%
- 2008→2024 swing
- -3.8pp toward R · 2008: -17.2pp · 2024: -21.1pp
- All cycles
- 2024: R+21.1 2020: R+19.7 2016: R+24.1 2012: R+23.1 2008: R+17.2
Not yet ingested
- Civics
- —
Market trends
- HPI YoY
- ▼ -140.55%
- Current HPI
- 187.6572
- Rent YoY
- ▲ 18.05%
- Metro
- Wichita, KS
- State GDP YoY
- —
- F500 in state
- 0
Price history
+136.6% since first listed7 events — show timeline
- 2026-05-05 Listed $260,000 SCKMLS as Distributed by MLS Grid
- 2026-01-11 Listing Removed — SCKMLS as Distributed by MLS Grid
- 2025-07-10 Listing Removed — SCKMLS as Distributed by MLS Grid
- 2025-07-10 Listed $229,000 SCKMLS as Distributed by MLS Grid
- 2025-06-06 Listed $229,000 SCKMLS as Distributed by MLS Grid
- 2007-01-01 Sold (Public Records) $107,000 Public Records
- 2006-12-12 Listed $109,900 SCKMLS as Distributed by MLS Grid
Property tax history
+4.7%/yrLatest (2025): $3,597 · +2.1% YoY. Source: county tax records.
Cash-flow waterfall
monthlySold comps — $/sqft
last 12 mo · ≤1 miLoading sold comps…