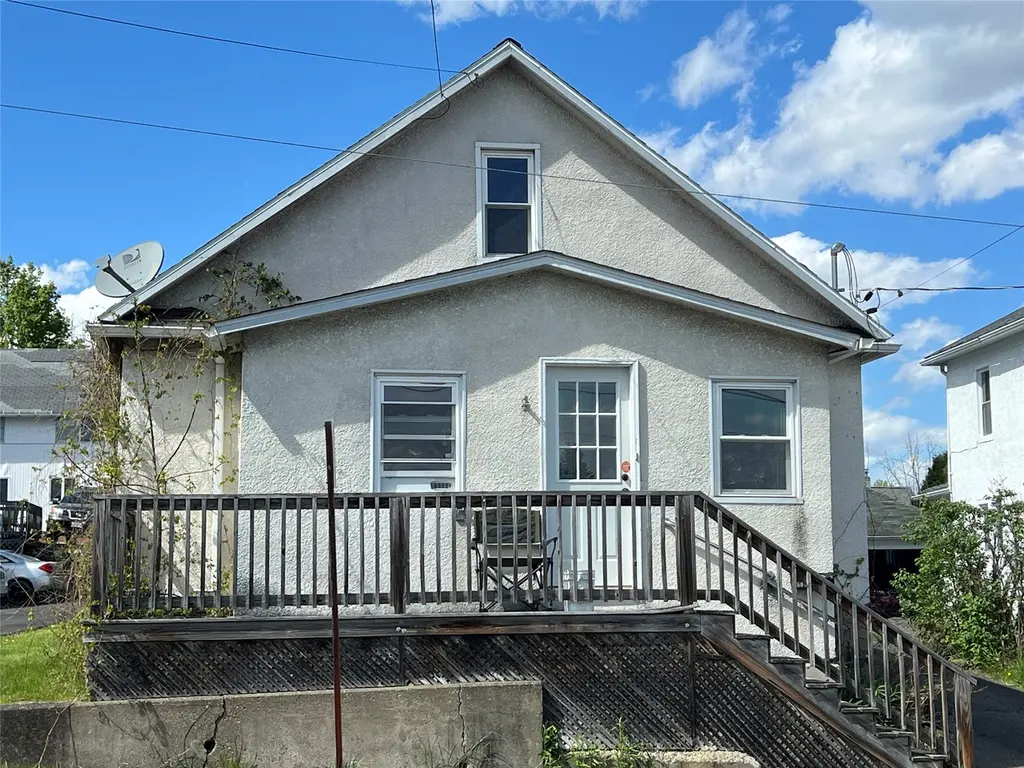
805 Pine Street St · Endicott, NY
Flood risk 1/10 · Minimal
- FEMA flood zone
- X
- Chance of flooding over 30 yrs
- 0.0%
- Est. flood insurance / yr
- $473 – $860
Fire risk 3/10 · Minor
- Est. fire insurance / yr
- $691 – $1,283
Heat risk 3/10 · Minor
- Hot days now (above 94°F)
- 7 days/yr
- Hot days in 30 yrs
- 16 days/yr
Wind risk 2/10 · Minimal
- Chance of severe wind over 30 yrs
- 2.0%
Air-quality risk 2/10 · Minimal
- Unhealthy air days now
- 0 days/yr
- Unhealthy air days in 30 yrs
- 1 days/yr
Risk factors via First Street. Map © Google.
Why this score? — see what drove the B grade
The composite is a weighted blend of 9 inputs, each scored 0–100. Each bar is that input's sub-score; the figure is the points it added to the 100-point composite (weight × sub-score).
- Cash flow +27.4/30.0
- ARV discount +15.0/15.0
- DSCR +9.6/10.0
- 1% rule +7.4/10.0
- Rent growth +4.3/5.0
- Schools +4.3/10.0
- Livability +3.5/5.0
- Condition / age +2.5/5.0
- Appreciation +0.0/10.0
$115,000
🖨 Deal sheet 📄 Offer letter ✓ Due diligence
Listing remarks MLS
Cozy 2 bedroom 1 bath home. There is a bonus room in one of the bedrooms that can be turned into a 2nd bath to have an on suite. Large yard with plenty of space for gardening.
Key facts
- New furnace
- Spacious backyard
- Breaker box updated
Tags
Property features AI
Exterior
- Parking: Detached garage (1 car)
- Utilities: Public water; Public sewer
- Home design: Residential single-family home
- Construction: Stucco exterior; Built-up area above grade approximately 1,050; Partial basement / crawl space
- Exterior features: Enclosed porch; Porch; Shed(s); Level lot; Lot dimensions approximately 158 x 41
Interior
- Kitchen: Range; Free-standing range; Refrigerator; Gas water heater
- Bedrooms: Total of 7 rooms (includes bedrooms and living spaces)
- Flooring: Hardwood; Laminate
- Bathrooms: 1 full bathroom
- Heating & cooling: Natural gas forced-air heating; Ceiling fan(s) for cooling
- Interior features: Storm windows; Crawl space/partial basement
- Laundry & utility: Washer; Dryer; Electric dryer hookup; Gas dryer hookup
Neighborhood map
What this means for you Summary
Snapshot
- This is a 3-bed/1.5-bath single-family listed at $115k.
Deal economics
- At list price, monthly cash flow is $336 ($4k/yr) — positive.
- The deal already cash-flows at list — no discount required.
- Meets the 1% rule at list price ($1k rent vs $115k).
- Recommended offer: $112k (3.0% below list) — sets the bar for market timing.
- Cap rate 9.8% vs local median 5.5% in Endicott — top-decile yield for the area; either an underpriced asset or a hidden risk that comps aren't pricing in. Stress-test before assuming the spread holds.
Location & tenants
- Location reads 70/100 on livability (#438 in NY) — a middle-class / working-renter tenant base. Strengths: cost of living A+, health & safety A+, housing A; Watch: amenities D, crime F, commute F.
- Union-Endicott Central School District (suburban): math 43% / reading 57% proficiency, ranked #387 of 590 in NY (top 66%) — acceptable for families but not a draw, mixed tenant base, ~2y average lease.
- Zoned schools: Charles F Johnson Jr Elementary School (math 17% / reading 27%, grade F, #1,923 of 2,108 statewide, top 92%, 387 students, 66% FRL) — zoned schools average 66% FRL vs 42% district-wide (25 pts higher); higher-poverty schools than district average — tighter screening recommended.
- Zoned-school proficiency averages 22% at this address vs 50% district-wide (-28 pts) — the specific schools serving this property underperform the Union-Endicott Central School District average; the district grade overstates school quality for this exact location.
- Market conditions: Rents rising fast (+7.1%/yr); 213 active listings in the ZIP; 21 comparable units currently listed for rent nearby; rentals lingering (median 44d on market — plan ~5-8 weeks vacancy on turnover, expect pricing pressure); 52% of comp listings sitting > 30 days — soft ceiling on asking rent; 340 units permitted in Broome County in 2024 (269 in 5+ unit buildings).
Forward outlook
- Local home prices are declining (-3.0%/yr); year-one equity from $795 of loan paydown is wiped out by about $3k of value loss. Plan a longer hold.
- Broome County population projected at -13% by 2050 — secular population decline; favor cash flow + early exit over multi-decade hold.
- At projected returns (-3.0% appreciation + 7.1% rent growth), your $32k cash investment doubles in ~7 years — after that, you're playing with house money.
Negotiation context
- It's been on market 37 days — a 3% lower offer ($112k) is reasonable based on typical stale-listing flexibility.
- 2 sale attempts since 4y ago; this cycle's ask has dropped $10k (8%) from the opening price — seller is motivated, your offer sets the floor, not the list.
- Current owner paid $77k; 49% above their basis — modest negotiation headroom, anchor on the comps not their cost.
Risks & watch-outs
- Watch-outs: built in 1930 — expect roof / HVAC / electrical / plumbing capex.
Questions for the listing agent
- It's been on market 37 days. Have you received any prior offers? Is the seller open to a 3% concession, seller financing, or rate buy-down credit?
- Built in 1930 — when were the roof, HVAC, electrical panel, plumbing, and water heater last replaced?
- Is there a deadline driving the sale (1031 exchange, divorce, estate, relocation)? That informs how much negotiation room exists.
- Schools are D-rated, which usually means shorter tenancies and higher turnover. Who's the typical renter profile here, and what's been the actual vacancy rate?
- Crime grade is F in this area — have there been break-ins, vandalism, or insurance claims at this property in the last 3 years? What carrier currently insures it and at what premium?
- What's the average days-on-market for RENTAL listings here right now (not sales)? A rising rental-DOM trend means longer vacancies and softer asking-rent achievability than the comps imply.
- What's the recent tenant-quality profile in this submarket — average credit score on applications, eviction rate, late-payment / NSF rate, and stable-employment percentage? A property-management company in the area should have these aggregated.
- How much new for-sale + rental construction is in the pipeline within 1–3 miles? Heavy new supply typically softens prices + rents 12–24 months out; constrained supply supports both.
Investment metrics
- 1% rule
- 1.24% ✓
- Cap rate
- 9.80%
- Cash-on-cash
- 12.52%
- DSCR
- 1.56
- GRM
- 6.7
CMA / ARV
- ARV (median comp)
- $162,292
- List price
- $115,000
- Delta
- -29.14%
- Verdict
- UNDERPRICED
- Comps
- 20 within 1.0 mi
Show comp detail 12 sales within ~0.75 mi
| Address | Dist | Beds/Ba | Sqft | Sold | Price | $/sf | Match |
|---|---|---|---|---|---|---|---|
| 310 N Mckinley Ave | 0.47mi | 3/1.0 | 1,056 (0%) | 1mo | $175,000 | $166 | 75 |
| 200 Bermond Ave | 0.27mi | 3/1.0 | 1,104 (+4%) | 11mo | $160,000 | $145 | 69 |
| 326 Squires Ave | 0.37mi | 2/1.0 (-1) | 1,078 (+2%) | 5mo | $140,000 | $130 | 68 |
| 223 Jamaica Blvd | 0.22mi | 3/1.0 | 1,176 (+11%) | 3mo | $215,000 | $183 | 67 |
| 125 Bermond Ave | 0.29mi | 3/1.5 | 1,144 (+8%) | 12mo | $135,000 | $118 | 63 |
| 309 Squires Ave | 0.36mi | 3/1.5 | 1,144 (+8%) | 9mo | $105,000 | $92 | 62 |
| 1202 Syracuse St St | 0.56mi | 4/1.0 (+1) | 1,024 (-3%) | 1mo | $163,000 | $159 | 61 |
| 331 N Arthur Ave | 0.62mi | 3/2.0 | 1,030 (-2%) | 8mo | $200,000 | $194 | 59 |
| 96 Cornell Rd | 0.41mi | 3/1.5 | 1,136 (+8%) | 15mo | $198,000 | $174 | 56 |
| 1305 Pine St | 0.32mi | 2/1.0 (-1) | 1,127 (+7%) | 15mo | $110,000 | $98 | 54 |
| 121 N Mckinley Ave | 0.54mi | 2/1.5 (-1) | 988 (-6%) | 6mo | $135,000 | $137 | 54 |
| 938 Squires Ave | 0.75mi | 3/1.5 | 1,142 (+8%) | 10mo | $120,000 | $105 | 44 |
Match score weights: distance 35% · size 25% · config 20% · recency 20%. Top-matched comps best support the ARV.
Projected returns pro-forma
-3.0% appreciation · 7.09% rent growth · sell at horizon
- IRR
- 6.8%
- Equity multiple
- 1.28×
- Total profit
- $8,897
- Equity at exit
- $17,147
- IRR
- 19.4%
- Equity multiple
- 2.95×
- Total profit
- $62,663
- Equity at exit
- $9,943
Cash invested: $32,200 (down + closing). Projections, not guarantees.
Landlord ↔ Tenant lean methodology
- Overall (STATE)
- 15 Strongly Tenant-Friendly
- State New York
- 15 Strongly Tenant-Friendly · D+10
- County
- — inherits STATE
- City
- — inherits STATE
ZIP-level market 13760
- Home prices YoY
- -32.7%
- Rents YoY
- 7.1%
- Active inventory
- 213
- Price-to-rent
- 6.7×
Monthly cashflow live
- Estimated rent
- $1,426 high interval (Pro) →
- Mortgage (P&I)
- −$603
- Tax from tax record
- −$139 /mo · $1,673/yr
- Insurance
- −$48
- HOA
- −$0
- Vacancy / Maint / Mgmt
- −$299
- Net cashflow
- $336
Break-even live
UW: 25.0% down · 7.5% · 30yr · 1.5% tax · 5.0% vac · 8.0% maint · 8.0% mgmt
Financing live
Cash to close
- Down payment
- $28,750
- Closing costs
- $3,450
- Reserves months
- —
- Total cash needed
- —
Loan-product check · same deal, 3 products live
Conventional
25% down · 7.5% · 30yr
- Down + closing
- —
- Monthly P&I
- —
- Monthly cashflow
- —
- DSCR
- —
- Eligible?
- —
Personal DTI + credit; lowest rate.
DSCR
20% down · 8.5% · 30yr
- Down + closing
- —
- Monthly P&I
- —
- Monthly cashflow
- —
- DSCR
- —
- Eligible?
- —
No personal income docs; deal must DSCR.
Hard money
10% down · 12.0% · 12mo
- Down + closing
- —
- Monthly P&I
- —
- Monthly cashflow
- —
- DSCR
- —
- Eligible?
- —
Short-term bridge; refi at stabilization.
Rent comps 21 comps
| Address | Beds | Baths | Sqft | Rent | $/sqft | DOM | Units | Dist |
|---|---|---|---|---|---|---|---|---|
| 1211 Pine St #1 Endicott, NY | 3.0 | 1.0 | 952 | $1,400 | $1.47 | 43d | 1 | 0.28mi |
| 507 Hill Ave Unit 1 Endicott, NY | 2.0 | 1.0 | 1072 | $1,450 | $1.35 | 43d | 1 | 0.29mi |
| 317 Rogers Ave Unit 2 Endicott, NY | 3.0 | 1.0 | 1000 | $1,300 | $1.30 | 21d | 1 | 0.40mi |
| 317 Rogers Ave Endicott, NY | 2.0 | 1.0 | 900 | $1,300 | $1.44 | 21d | 1 | 0.40mi |
| 124 Squires Ave Unit 2 Endicott, NY | 2.0 | 1.0 | 750 | $1,100 | $1.47 | 43d | 1 | 0.47mi |
| 204 Rogers Ave Endicott, NY | 2.0 | 1.5 | 1456 | $2,000 | $1.37 | 21d | 1 | 0.49mi |
| 112 N Roosevelt Ave Endicott, NY | 3.0 | 2.0 | 1299 | $1,850 | $1.42 | 43d | 1 | 0.62mi |
| 916 Irving Ave Unit 1 Endicott, NY | 2.0 | 1.0 | 1200 | $1,500 | $1.25 | 21d | 1 | 0.64mi |
| 107 N Jackson Ave Apt 2 Endicott, NY | 2.0 | 1.0 | 950 | $1,350 | $1.42 | 43d | 1 | 0.76mi |
| 800 North St Unit 1 Endicott, NY | 3.0 | 1.0 | 800 | $1,300 | $1.62 | 43d | 1 | 0.82mi |
| 53 Washington Ave Unit 2 Endicott, NY | 2.0 | 1.0 | 1180 | $1,300 | $1.10 | 21d | 1 | 0.89mi |
| 106 Madison Ave Unit 1 Endicott, NY | 3.0 | 1.0 | 1050 | $1,500 | $1.43 | 43d | 1 | 0.94mi |
| 804 Broad St Unit 2 Endicott, NY | 3.0 | 1.0 | 975 | $1,500 | $1.54 | 43d | 1 | 1.02mi |
| 5 Colorado Ave Unit 2 Endicott, NY | 2.0 | 1.0 | 750 | $1,200 | $1.60 | 43d | 1 | 1.09mi |
| 5 Colorado Ave Unit 1 Endicott, NY | 2.0 | 1.0 | 750 | $1,300 | $1.73 | 43d | 1 | 1.09mi |
| 305 Adams Ave Endicott, NY | 3.0 | 1.0 | 800 | $1,450 | $1.81 | 21d | 1 | 1.15mi |
| 1901 Tracy St Fl Ea Endicott, NY | 2.0 | 1.0 | 986 | $1,200 | $1.22 | 21d | 1 | 1.21mi |
| 2007 Tracy St Unit 1st Floor Endicott, NY | 2.0 | 1.0 | 819 | $1,250 | $1.53 | 43d | 1 | 1.23mi |
| 2602 North St Unit 3W Endicott, NY | 2.0 | 1.0 | 900 | $1,100 | $1.22 | 21d | 1 | 1.26mi |
| 1807 Riverview Dr #1 Endicott, NY | 3.0 | 1.5 | 1266 | $1,800 | $1.42 | 21d | 1 | 1.34mi |
| 207 S Loder Ave Unit D-15 Endicott, NY | 2.0 | 1.0 | 700 | $925 | $1.32 | 21d | 1 | 1.34mi |
Listing history 24 events
-
2026-06-19days on market $115,000 Active 37 DOM
-
2026-06-18days on market $115,000 Active 36 DOM
-
2026-06-17days on market $115,000 Active 35 DOM
-
2026-06-16days on market $115,000 Active 34 DOM
-
2026-06-15days on market $115,000 Active 33 DOM
-
2026-06-14days on market $115,000 Active 31 DOM
-
2026-06-13days on market $115,000 Active 30 DOM
-
2026-06-10days on market $115,000 Active 28 DOM
-
2026-06-09pricedays on market $115,000 Active 27 DOM
-
2026-06-08days on market $118,000 Active 26 DOM
-
2026-06-07days on market $118,000 Active 25 DOM
-
2026-06-05days on market $118,000 Active 22 DOM
-
2026-06-03days on market $118,000 Active 21 DOM
-
2026-06-02days on market $118,000 Active 20 DOM
-
2026-06-01days on market $118,000 Active 19 DOM
-
2026-05-31days on market $118,000 Active 18 DOM
-
2026-05-30days on market $118,000 Active 17 DOM
-
2026-05-13$125,000 Active 468-char remark
-
2023-02-15soldstatus $77,300
-
2023-01-12soldstatus $77,300 Closed 175-char remark
Show marketing remark (175 chars)
Cozy 2 bedroom 1 bath home. There is a bonus room in one of the bedrooms that can be turned into a 2nd bath to have an on suite. Large yard with plenty of space for gardening.
-
2022-11-29status Pending 175-char remark
Show marketing remark (175 chars)
Cozy 2 bedroom 1 bath home. There is a bonus room in one of the bedrooms that can be turned into a 2nd bath to have an on suite. Large yard with plenty of space for gardening.
-
2022-10-24$82,000 Active 175-char remark
Show marketing remark (175 chars)
Cozy 2 bedroom 1 bath home. There is a bonus room in one of the bedrooms that can be turned into a 2nd bath to have an on suite. Large yard with plenty of space for gardening.
-
2011-01-10soldstatus $35,000
-
1998-06-08soldstatus $28,500
ⓘ Source: listings_history table (triggers on properties + properties_extension) + one-shot
backfill from property_details.listing_events for pre-trigger history.
Tax reassessment forecast NY · Partial reset (capped growth)
- Current annual tax
- $1,673 · $139/mo
- Projected year-2 tax
- $1,808 · $151/mo
- Expected delta
- +$135/yr (+$11/mo · 8.1%)
ⓘ Screening estimate from a state-policy table — verify with the county assessor before closing.
Climate risk First Street
- Flood 1/10 Low FEMA zone X · 0% chance over 30 yrs
- Wildfire 3/10 Moderate
- Heat 3/10 Moderate 7 d/yr ≥94°F today · 16 d/yr by 30 yrs out
- Wind 2/10 Low 2% chance of damaging wind over 30 yrs
- Air quality 2/10 Low 0 unhealthy d/yr today · 1 by 30 yrs out
Nearby sold comps map
Loading sold comps map…
Walkable amenities ~0.75 mi
Loading nearby amenities…
Taxation est. · year 1
- Rental income
- $17,111
- − Mortgage interest
- −$6,442
- − Property taxes
- −$1,673
- − Insurance
- −$575
- − Repairs & maintenance
- −$1,369
- − Management
- −$1,369
- − Depreciation
- −$3,345
- Taxable income
- $2,338
- Est. tax owed @ 24.0%
- −$561
- After-tax cash flow
- $3,472/yr
For passive investors: Depreciation is non-cash, so a rental often shows a tax loss while cash-flowing — sheltering income. Rental losses are passive: they offset passive income freely, and up to $25,000/yr can offset ordinary (W-2) income if you actively participate and your MAGI is under $100k (phasing out to $0 by $150k); unused losses carry forward. On sale, claimed depreciation is recaptured at up to 25%, and gains may owe capital-gains tax (a 1031 exchange can defer both). Figures are a year-1 estimate at your 24.0% rate — not tax advice; consult a CPA.
Schools (NCES district)
- District
- Union-Endicott Central School District
- NCES district ID
- 3610710
- Math proficiency
- 43% ▼ -9.00%
- Reading proficiency
- 57% ▲ 11.00%
- Median HH income
- $49,265
- Composite
- 42.66/100
- National rank
- #3176
- State rank
- #387 of 590 in NY
Livability — Endicott
- Score
- 70/100
- State rank
- #438
- US rank
- #7657
Category grades
Schools grade is shown separately in the Schools card above.
Census & demographics
- Census place
- Endicott, NY
- County
- Broome County · 126,805 people
- City population
- 42,896
- Metro
- Binghamton, NY
- Population (ZIP)
- 42,896
- Household income
- $66,095
- Rent vs Own
- Severe rent burden
- 1480.0
Population outlook (Broome County) Hauer SSP2
- Today (2025)
- 187,989 people
- By 2030
- 183,066 · -2.6%
- By 2040
- 172,228 · -8.4%
- By 2050
- 163,161 · -13.2%
- By 2075
- 153,641 · -18.3%
- By 2100
- 140,851 · -25.1%
Race, ethnicity, and origin ACS 2023
- Neighborhood character
- Predominantly White (84%)
- Race & ethnicity
- White 84% Two or more races 7% Hispanic / Latino 6% Black 4% Asian 2%
- Hispanic origin (detail)
- Puerto Rican 2%
- Common ancestry
- Romanian 6% Lithuanian 2% Slovak 2%
- Foreign-born
- 5% · Canada, China
- Languages at home
- 94% English-only · Spanish 2% Other Indo-European 1% Russian/Polish/Slavic 1%
Political lean MEDSL · Broome
- 2024 margin
- Toss-up / Even · D 50.2% · R 49.8%
- 2008→2024 swing
- -7.6pp toward R · 2008: 8.0pp · 2024: 0.4pp
- All cycles
- 2024: D+0.4 2020: D+3.5 2016: R+3.7 2012: D+4.6 2008: D+8.0
Not yet ingested
- Civics
- —
Market trends
- HPI YoY
- ▼ -131.29%
- Current HPI
- 270.2661
- Rent YoY
- ▲ 7.09%
- Metro
- Binghamton, NY
- State GDP YoY
- ▲ 2.60%
- F500 in state
- 92
Industry mix (Fortune 500 HQ in NY)
| Industry | F500 HQs | Revenue |
|---|---|---|
| Financial Services | 10 | $950B |
|
||
| Consumer Goods | 9 | $162B |
|
||
| Insurance | 4 | $225B |
|
||
| Telecommunications | 2 | $144B |
|
||
| Pharmaceuticals | 2 | $112B |
|
||
| Media / Entertainment | 2 | $69B |
|
||
Price history
+303.5% since first listed9 events — show timeline
- 2026-06-09 Price Changed $115,000 GBAOR
- 2026-05-25 Price Changed $118,000 GBAOR
- 2026-05-13 Listed $125,000 GBAOR
- 2023-02-15 Sold (Public Records) $77,300 Public Records
- 2023-01-12 Sold (MLS) $77,300 GBAOR
- 2022-11-29 Pending — GBAOR
- 2022-10-24 Listed $82,000 GBAOR
- 2011-01-10 Sold (Public Records) $35,000 Public Records
- 1998-06-08 Sold (Public Records) $28,500 Public Records
Property tax history
+8.6%/yrLatest (2025): $1,673 · +3.4% YoY. Source: county tax records.
Cash-flow waterfall
monthlySold comps — $/sqft
last 12 mo · ≤1 miLoading sold comps…