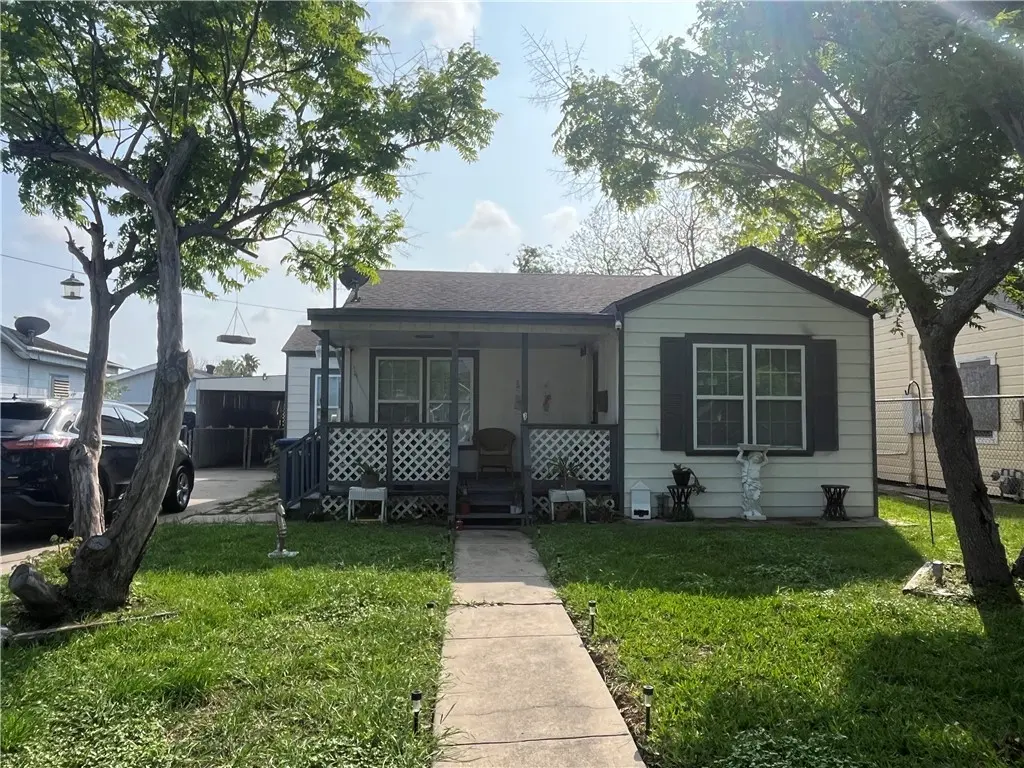
1453 14th St · Corpus Christi, TX
Flood risk 1/10 · Minimal
- FEMA flood zone
- X (unshaded)
- Chance of flooding over 30 yrs
- 0.0%
- Est. flood insurance / yr
- $507 – $1,088
Fire risk 1/10 · Minimal
- Est. fire insurance / yr
- $1,222 – $2,270
Heat risk 10/10 · Severe
- Hot days now (above 107°F)
- 7 days/yr
- Hot days in 30 yrs
- 26 days/yr
Wind risk 9/10 · Severe
- Chance of severe wind over 30 yrs
- 99.0%
Air-quality risk 1/10 · Minimal
- Unhealthy air days now
- 0 days/yr
- Unhealthy air days in 30 yrs
- 0 days/yr
Risk factors via First Street. Map © Google.
Why this score? — see what drove the D grade
The composite is a weighted blend of 9 inputs, each scored 0–100. Each bar is that input's sub-score; the figure is the points it added to the 100-point composite (weight × sub-score).
- Cash flow +16.2/30.0
- 1% rule +5.5/10.0
- DSCR +5.0/10.0
- Livability +3.9/5.0
- Rent growth +3.0/5.0
- Schools +2.8/10.0
- ARV discount +2.7/15.0
- Condition / age +2.5/5.0
- Appreciation +0.0/10.0
$147,000
🖨 Deal sheet 📄 Offer letter ✓ Due diligence
Listing remarks MLS
Three bedroom two bath house with split floor plan, two living areas, covered parking, and a two car garage. Front door opens up to spacious living area open to the kitchen. Galley kitchen with updated cabinets leads you to a casual dining area with buffet. Dining overlooks the seconf living room or den and bonus room with access to covered patio and parking. Primary suite tucked away int he back of the house with stand up shower. Two bedrooms and a bathroom off the front living area faces the driveway. Both bedrooms are a nize size and allow for plenty of furniture and natural light. Hall bath boasts a walk in shower and pedestal sink. New HVAC replaced 2022. Quick commute to grocery, restaurants, schools, parks, and so much more. Call a Realtor today to schedule a showing.
Key facts
- 6,251 sq ft lot
- 2 garage spots
- Built 1941
Neighborhood map
What this means for you Summary
Snapshot
- This is a 3-bed/2.0-bath single-family listed at $147k.
Deal economics
- At list price, monthly cash flow is $79 ($945/yr) — positive.
- The deal already cash-flows at list — no discount required.
- Meets the 1% rule at list price ($2k rent vs $147k).
- Recommended offer: $129k (12.0% below list) — sets the bar for market timing.
- Cap rate 6.9% vs local median 3.6% in Corpus Christi — top-decile yield for the area; either an underpriced asset or a hidden risk that comps aren't pricing in. Stress-test before assuming the spread holds.
Location & tenants
- Location reads 78/100 on livability (#66 in TX, #2,404 nationally) — a middle-class / working-renter tenant base. Strengths: commute A+, cost of living A+, housing A+; Watch: crime F.
- Corpus Christi ISD (urban): math 31% / reading 35% proficiency, ranked #562 of 826 in TX (top 68%) — families likely to look elsewhere, expect single-tenant / working-renter base with shorter leases; 63% free/reduced lunch — lower-income household profile, screen leases tightly.
- Market conditions: Rents rising (+1.9%/yr); 141 active listings in the ZIP; 31 comparable units currently listed for rent nearby; rentals at typical pace (median 21d on market — plan ~3-4 weeks tenant-placement turnaround); 42% of comp listings sitting > 30 days — soft ceiling on asking rent; 1,397 units permitted in Nueces County in 2024 (47 in 5+ unit buildings).
- This rent runs 30% of the median local income ($61k/yr) — at the standard rent-burdened threshold; future hikes will face affordability resistance.
Forward outlook
- Local home prices are declining (-3.0%/yr); year-one equity from $1k of loan paydown is wiped out by about $4k of value loss. Plan a longer hold.
- Nueces County population projected at +36% by 2050 — long-run rental-demand tailwind backs the buy-and-hold thesis.
Negotiation context
- It's been on market 150 days — a 12% lower offer ($129k) is reasonable based on typical stale-listing flexibility.
- 9 sale attempts since 7y ago; this cycle's ask is 9700% above the opening price — seller raised mid-cycle; expect resistance to lowballs.
Risks & watch-outs
- Watch-outs: property tax is 2.5% of price; built in 1941 — expect roof / HVAC / electrical / plumbing capex.
- Climate carrying-cost: severe wind risk, 99% chance of damaging wind over 30y; extreme-heat days projected 7→26/yr by 2055 (HVAC capex compounding) — expect insurance premiums to compound above CPI over the hold.
Questions for the listing agent
- It's been on market 150 days. Have you received any prior offers? Is the seller open to a 12% concession, seller financing, or rate buy-down credit?
- Built in 1941 — when were the roof, HVAC, electrical panel, plumbing, and water heater last replaced?
- Property tax is high relative to price — has the assessment been appealed recently, and will the sale trigger a re-assessment?
- Why hasn't it sold? Are there any deal-killer items the seller is aware of (foundation, flood, title, zoning, code violations)?
- Is there a deadline driving the sale (1031 exchange, divorce, estate, relocation)? That informs how much negotiation room exists.
- Crime grade is F in this area — have there been break-ins, vandalism, or insurance claims at this property in the last 3 years? What carrier currently insures it and at what premium?
- The area grade is low — what's the realistic commute time and amenity access for the typical tenant pool here? Any planned neighborhood developments (good or bad) we should know about?
- What's the average days-on-market for RENTAL listings here right now (not sales)? A rising rental-DOM trend means longer vacancies and softer asking-rent achievability than the comps imply.
- What's the recent tenant-quality profile in this submarket — average credit score on applications, eviction rate, late-payment / NSF rate, and stable-employment percentage? A property-management company in the area should have these aggregated.
- How much new for-sale + rental construction is in the pipeline within 1–3 miles? Heavy new supply typically softens prices + rents 12–24 months out; constrained supply supports both.
Investment metrics
- 1% rule
- 1.05% ✓
- Cap rate
- 6.94%
- Cash-on-cash
- 2.30%
- DSCR
- 1.10
- GRM
- 7.9
CMA / ARV
- ARV (median comp)
- $132,812
- List price
- $147,000
- Delta
- 10.68%
- Verdict
- OVERPRICED
- Comps
- 20 within 1.0 mi
Show comp detail 12 sales within ~0.75 mi
| Address | Dist | Beds/Ba | Sqft | Sold | Price | $/sf | Match |
|---|---|---|---|---|---|---|---|
| 2502 Lynch St | 0.34mi | 3/2.0 | 1,425 (-0%) | 3mo | $235,000 | $165 | 81 |
| 1725 15th St | 0.43mi | 3/2.5 | 1,447 (+1%) | 2mo | $190,000 | $131 | 75 |
| 311 Clifford St | 0.67mi | 3/1.0 | 1,400 (-2%) | 2mo | $118,000 | $84 | 59 |
| 1652 16th St | 0.33mi | 4/2.0 (+1) | 1,260 (-12%) | 2mo | $170,000 | $135 | 58 |
| 1320 Hancock Ave | 0.48mi | 3/2.0 | 1,280 (-11%) | 4mo | $218,000 | $170 | 56 |
| 915 Craig St | 0.49mi | 3/2.0 | 1,263 (-12%) | 2mo | $229,000 | $181 | 56 |
| 2617 David St | 0.62mi | 3/2.0 | 1,529 (+7%) | 6mo | $100,000 | $65 | 54 |
| 810 Craig St | 0.58mi | 2/2.0 (-1) | 1,368 (-4%) | 7mo | $129,995 | $95 | 54 |
| 641 Naples St | 0.68mi | 2/2.0 (-1) | 1,376 (-4%) | 4mo | $205,000 | $149 | 54 |
| 1210 Morris St | 0.66mi | 3/1.0 | 1,330 (-7%) | 3mo | $47,500 | $36 | 51 |
| 532 S 19th St | 0.74mi | 3/2.0 | 1,288 (-10%) | 4mo | $199,000 | $155 | 46 |
| 622 Atlantic St | 0.70mi | 2/1.0 (-1) | 1,260 (-12%) | 2mo | $110,000 | $87 | 37 |
Match score weights: distance 35% · size 25% · config 20% · recency 20%. Top-matched comps best support the ARV.
Projected returns pro-forma
-3.0% appreciation · 1.87% rent growth · sell at horizon
- IRR
- -14.0%
- Equity multiple
- 0.50×
- Total profit
- $-20,440
- Equity at exit
- $21,918
- IRR
- -7.2%
- Equity multiple
- 0.57×
- Total profit
- $-17,893
- Equity at exit
- $12,710
Cash invested: $41,160 (down + closing). Projections, not guarantees.
Landlord ↔ Tenant lean methodology
- Overall (STATE)
- 87 Strongly Landlord-Friendly
- State Texas
- 87 Strongly Landlord-Friendly · R+5
- County
- — inherits STATE
- City
- — inherits STATE
ZIP-level market 78404
- Rents YoY
- 1.9%
- Active inventory
- 141
- Price-to-rent
- 7.9×
Monthly cashflow live
- Estimated rent
- $1,542 high interval (Pro) →
- Mortgage (P&I)
- −$771
- Tax from tax record
- −$307 /mo · $3,690/yr
- Insurance
- −$61
- HOA
- −$0
- Vacancy / Maint / Mgmt
- −$324
- Net cashflow
- $79
Break-even live
UW: 25.0% down · 7.5% · 30yr · 1.5% tax · 5.0% vac · 8.0% maint · 8.0% mgmt
Financing live
Cash to close
- Down payment
- $36,750
- Closing costs
- $4,410
- Reserves months
- —
- Total cash needed
- —
Loan-product check · same deal, 3 products live
Conventional
25% down · 7.5% · 30yr
- Down + closing
- —
- Monthly P&I
- —
- Monthly cashflow
- —
- DSCR
- —
- Eligible?
- —
Personal DTI + credit; lowest rate.
DSCR
20% down · 8.5% · 30yr
- Down + closing
- —
- Monthly P&I
- —
- Monthly cashflow
- —
- DSCR
- —
- Eligible?
- —
No personal income docs; deal must DSCR.
Hard money
10% down · 12.0% · 12mo
- Down + closing
- —
- Monthly P&I
- —
- Monthly cashflow
- —
- DSCR
- —
- Eligible?
- —
Short-term bridge; refi at stabilization.
Rent comps 31 comps
| Address | Beds | Baths | Sqft | Rent | $/sqft | DOM | Units | Dist |
|---|---|---|---|---|---|---|---|---|
| 1634 14th St Corpus Christi, TX | 2.0 | 1.5 | 980 | $1,090 | $1.11 | 43d | 1 | 0.30mi |
| 1525 S 19th St Unit B Corpus Christi, TX | 3.0 | 2.0 | 1062 | $2,100 | $1.98 | 13d | 1 | 0.30mi |
| 1628 18th St Corpus Christi, TX | 2.0 | 1.0 | 1112 | $1,000 | $0.90 | 43d | 1 | 0.32mi |
| 1107 14th St Corpus Christi, TX | 4.0 | 1.5 | 1520 | $1,300 | $0.86 | 43d | 1 | 0.33mi |
| 2622 Cloyde St Corpus Christi, TX | 2.0 | 1.0 | 1693 | $1,150 | $0.68 | 43d | 1 | 0.47mi |
| 1318 6th St Corpus Christi, TX | 2.0 | 1.0 | 900 | $900 | $1.00 | 13d | 1 | 0.50mi |
| 426 Palmero St Corpus Christi, TX | 3.0 | 2.0 | 1720 | $1,350 | $0.78 | 43d | 1 | 0.50mi |
| 1802 16th St Unit B Corpus Christi, TX | 3.0 | 1.0 | 1575 | $1,000 | $0.63 | 43d | 1 | 0.53mi |
| 801 S Alameda St Unit A Corpus Christi, TX | 2.0 | 1.0 | 1760 | $900 | $0.51 | 43d | 1 | 0.59mi |
| 616 16th St Unit A Corpus Christi, TX | 3.0 | 1.0 | 1040 | $1,050 | $1.01 | 43d | 1 | 0.62mi |
| 826 Hancock Ave Unit 2 Corpus Christi, TX | 2.0 | 1.0 | 1000 | $950 | $0.95 | 21d | 1 | 0.63mi |
| 2402 Segrest St Corpus Christi, TX | 2.0 | 1.0 | 1120 | $825 | $0.74 | 21d | 1 | 0.65mi |
| 2522 Cleo St Corpus Christi, TX | 3.0 | 1.0 | 992 | $1,350 | $1.36 | 13d | 1 | 0.66mi |
| 813 Furman Ave Apt 1 Corpus Christi, TX | 3.0 | 2.0 | 1430 | $1,475 | $1.03 | 13d | 1 | 0.69mi |
| 1117 Ocean Dr Unit B Corpus Christi, TX | 2.0 | 1.0 | 1543 | $3,000 | $1.94 | 43d | 1 | 0.79mi |
| 522 Hancock Ave Unit 1-319 Corpus Christi, TX | 2.0 | 2.0 | 1133 | $1,625 | $1.43 | 21d | 1 | 0.80mi |
| 1722 Trenton Dr Corpus Christi, TX | 4.0 | 2.0 | 1432 | $2,100 | $1.47 | 13d | 1 | 0.80mi |
| 522 Hancock Ave Corpus Christi, TX | 1.0–2.0 | 1.0–2.0 | 915 | $2,000 | $2.18 | 13d | 10 | 0.81mi |
| 802 S Carancahua St Corpus Christi, TX | 2.0 | 1.0–2.0 | 869 | $1,770 | $2.04 | 13d | 68 | 0.87mi |
| 823 S Water St Corpus Christi, TX | 2.0 | 2.0 | 1243 | $2,000 | $1.61 | 13d | 1 | 0.87mi |
| 455 Louisiana Ave Corpus Christi, TX | 2.0 | 1.0 | 1528 | $3,000 | $1.96 | 21d | 1 | 0.91mi |
| 1201 York Ave Corpus Christi, TX | 3.0 | 1.0 | 888 | $1,550 | $1.75 | 21d | 1 | 1.02mi |
| 443 Indiana Ave Corpus Christi, TX | 2.0 | 1.0 | 968 | $1,650 | $1.70 | 43d | 1 | 1.03mi |
| 110 Josephine St Corpus Christi, TX | 3.0 | 2.0 | 1050 | $2,000 | $1.90 | 43d | 1 | 1.06mi |
| 332 Rosebud Ave Corpus Christi, TX | 2.0 | 1.0 | 942 | $1,150 | $1.22 | 21d | 1 | 1.16mi |
| 309 Rosebud Ave Unit D Corpus Christi, TX | 2.0 | 1.0 | 882 | $1,100 | $1.25 | 21d | 1 | 1.20mi |
| 2837 Santa Fe St Unit 2 Corpus Christi, TX | 2.0 | 1.0 | 1030 | $1,300 | $1.26 | 13d | 1 | 1.23mi |
| 200 Clemmer St Unit A Corpus Christi, TX | 3.0 | 1.0 | 950 | $1,199 | $1.26 | 43d | 1 | 1.23mi |
| 2245 Comanche St Unit A Corpus Christi, TX | 3.0 | 1.0 | 1016 | $1,350 | $1.33 | 21d | 1 | 1.24mi |
| 225 Watson St Corpus Christi, TX | 3.0 | 1.0 | 1472 | $1,295 | $0.88 | 43d | 1 | 1.34mi |
| 1405 Annapolis Dr Corpus Christi, TX | 3.0 | 1.5 | 1502 | $2,000 | $1.33 | 13d | 1 | 1.50mi |
Listing history 41 events
-
2026-06-14days on market $147,000 Active 150 DOM
-
2026-06-10days on market $147,000 Active 147 DOM
-
2026-06-09days on market $147,000 Active 146 DOM
-
2026-06-08days on market $147,000 Active 145 DOM
-
2026-06-07days on market $147,000 Active 144 DOM
-
2026-06-05days on market $147,000 Active 141 DOM
-
2026-06-03days on market $147,000 Active 140 DOM
-
2026-06-02days on market $147,000 Active 139 DOM
-
2026-06-01days on market $147,000 Active 138 DOM
-
2026-05-31days on market $147,000 Active 137 DOM
-
2026-05-30days on market $147,000 Active 136 DOM
-
2026-02-27historical $1,530
-
2026-02-13price $1,530
-
2026-02-05$1,500
-
2026-01-30price $147,000 786-char remark
Show marketing remark (786 chars)
Three bedroom two bath house with split floor plan, two living areas, covered parking, and a two car garage. Front door opens up to spacious living area open to the kitchen. Galley kitchen with updated cabinets leads you to a casual dining area with buffet. Dining overlooks the seconf living room or den and bonus room with access to covered patio and parking. Primary suite tucked away int he back of the house with stand up shower. Two bedrooms and a bathroom off the front living area faces the driveway. Both bedrooms are a nize size and allow for plenty of furniture and natural light. Hall bath boasts a walk in shower and pedestal sink. New HVAC replaced 2022. Quick commute to grocery, restaurants, schools, parks, and so much more. Call a Realtor today to schedule a showing.
-
2026-01-14$157,000 Active 786-char remark
Show marketing remark (786 chars)
Three bedroom two bath house with split floor plan, two living areas, covered parking, and a two car garage. Front door opens up to spacious living area open to the kitchen. Galley kitchen with updated cabinets leads you to a casual dining area with buffet. Dining overlooks the seconf living room or den and bonus room with access to covered patio and parking. Primary suite tucked away int he back of the house with stand up shower. Two bedrooms and a bathroom off the front living area faces the driveway. Both bedrooms are a nize size and allow for plenty of furniture and natural light. Hall bath boasts a walk in shower and pedestal sink. New HVAC replaced 2022. Quick commute to grocery, restaurants, schools, parks, and so much more. Call a Realtor today to schedule a showing.
-
2025-08-13price $157,000
-
2025-04-23$167,000 Active
-
2022-12-15price $240,000
-
2022-12-07status Active
-
2022-05-11historical
-
2022-05-11price $250,000
-
2022-03-31$150,000 Active
-
2021-10-08soldstatus
-
2020-03-18historical
-
2020-03-09$110,000 Active
-
2020-03-06historical
-
2020-03-05soldstatus
-
2020-03-04soldstatus Closed
-
2020-02-17status Pending
-
2020-02-10historical Active Under Contract
-
2020-01-20status Active
-
2020-01-19status Pending
-
2020-01-13historical Option Period
-
2019-12-04price $79,900
-
2019-11-07price $89,900
-
2019-10-18price $100,000
-
2019-10-01price $110,000
-
2019-09-17status Active
-
2019-09-16historical Option Period
-
2019-08-28$125,000 Active
ⓘ Source: listings_history table (triggers on properties + properties_extension) + one-shot
backfill from property_details.listing_events for pre-trigger history.
Tax reassessment forecast TX · Resets to sale price
- Current annual tax
- $3,690 · $307/mo
- Projected year-2 tax
- $3,690 · $307/mo
- Expected delta
- $0/yr ($0/mo · 0.0%)
ⓘ Screening estimate from a state-policy table — verify with the county assessor before closing.
Climate risk First Street
- Flood 1/10 Low FEMA zone X (unshaded) · 0% chance over 30 yrs
- Wildfire 1/10 Low
- Heat 10/10 Extreme 7 d/yr ≥107°F today · 26 d/yr by 30 yrs out
- Wind 9/10 Extreme 99% chance of damaging wind over 30 yrs
- Air quality 1/10 Low 0 unhealthy d/yr today · 0 by 30 yrs out
Nearby sold comps map
Loading sold comps map…
Walkable amenities ~0.75 mi
Loading nearby amenities…
Taxation est. · year 1
- Rental income
- $18,507
- − Mortgage interest
- −$8,234
- − Property taxes
- −$3,690
- − Insurance
- −$735
- − Repairs & maintenance
- −$1,481
- − Management
- −$1,481
- − Depreciation
- −$4,276
- Taxable loss
- −$1,390
- Est. tax savings @ 24.0%
- +$334
- After-tax cash flow
- $1,278/yr
For passive investors: Depreciation is non-cash, so a rental often shows a tax loss while cash-flowing — sheltering income. Rental losses are passive: they offset passive income freely, and up to $25,000/yr can offset ordinary (W-2) income if you actively participate and your MAGI is under $100k (phasing out to $0 by $150k); unused losses carry forward. On sale, claimed depreciation is recaptured at up to 25%, and gains may owe capital-gains tax (a 1031 exchange can defer both). Figures are a year-1 estimate at your 24.0% rate — not tax advice; consult a CPA.
Schools (NCES district)
- District
- Corpus Christi ISD
- NCES district ID
- 4815270
- Math proficiency
- 31% ▼ -18.00%
- Reading proficiency
- 35% ▼ -7.00%
- Median HH income
- $45,672
- Composite
- 28.27/100
- National rank
- #6793
- State rank
- #562 of 826 in TX
Livability — Corpus Christi
- Score
- 78/100
- State rank
- #66
- US rank
- #2404
Category grades
Schools grade is shown separately in the Schools card above.
Census & demographics
- Census place
- Corpus Christi, TX
- County
- Nueces County · 296,836 people
- City population
- 296,836
- Metro
- Corpus Christi, TX
- Population (ZIP)
- 12,635
- Household income
- $61,280
- Rent vs Own
- Severe rent burden
- 596.0
Population outlook (Nueces County) Hauer SSP2
- Today (2025)
- 418,037 people
- By 2030
- 447,123 · +7.0%
- By 2040
- 505,911 · +21.0%
- By 2050
- 567,522 · +35.8%
- By 2075
- 729,686 · +74.6%
- By 2100
- 847,087 · +102.6%
Race, ethnicity, and origin ACS 2023
- Neighborhood character
- Majority Hispanic (62%)
- Race & ethnicity
- Hispanic / Latino 62% White 32% Two or more races 29% Black 4%
- Hispanic origin (detail)
- Mexican 56%
- Common ancestry
- Slovak 3% Italian 2% Lithuanian 1%
- Foreign-born
- 9% · Canada
- Languages at home
- 61% English-only · Spanish 39%
Political lean MEDSL · Nueces
- 2024 margin
- R (+11.5) · D 43.8% · R 55.3%
- 2008→2024 swing
- -7.1pp toward R · 2008: -4.4pp · 2024: -11.5pp
- All cycles
- 2024: R+11.5 2020: R+2.9 2016: R+1.5 2012: R+3.2 2008: R+4.4
Not yet ingested
- Civics
- —
Market trends
- HPI YoY
- ▼ -211.10%
- Current HPI
- 177.4759
- Rent YoY
- ▲ 1.87%
- Metro
- Corpus Christi, TX
- State GDP YoY
- ▲ 3.95%
- F500 in state
- 110
Industry mix (Fortune 500 HQ in TX)
| Industry | F500 HQs | Revenue |
|---|---|---|
| Energy | 16 | $1,198B |
|
||
| Technology | 5 | $198B |
|
||
| Engineering / Construction | 4 | $72B |
|
||
| Energy Services | 3 | $60B |
|
||
| Utilities | 3 | $41B |
|
||
| Healthcare | 2 | $330B |
|
||
Price history
-98.8% since first listed30 events — show timeline
- 2026-02-27 Rental Removed $1,530 TURBOTENANT
- 2026-02-13 Price Changed $1,530 TURBOTENANT
- 2026-02-05 Listed for Rent $1,500 TURBOTENANT
- 2026-01-30 Price Changed $147,000 CBMLS
- 2026-01-14 Listed $157,000 CBMLS
- 2025-08-13 Price Changed $157,000 CBMLS
- 2025-04-23 Listed $167,000 CBMLS
- 2022-12-15 Price Changed $240,000 CBMLS
- 2022-12-07 Relisted — CBMLS
- 2022-05-11 Price Changed $250,000 CBMLS
- 2022-05-11 Delisted — CBMLS
- 2022-03-31 Listed $150,000 CBMLS
- 2021-10-08 Sold (Public Records) — Public Records
- 2020-03-18 Delisted — CBMLS
- 2020-03-09 Listed $110,000 CBMLS
- 2020-03-06 Delisted — CBMLS
- 2020-03-05 Sold (Public Records) — Public Records
- 2020-03-04 Sold (MLS) — CBMLS
- 2020-02-17 Pending — CBMLS
- 2020-02-10 Contingent — CBMLS
- 2020-01-20 Relisted — CBMLS
- 2020-01-19 Pending — CBMLS
- 2020-01-13 Contingent — CBMLS
- 2019-12-04 Price Changed $79,900 CBMLS
- 2019-11-07 Price Changed $89,900 CBMLS
- 2019-10-18 Price Changed $100,000 CBMLS
- 2019-10-01 Price Changed $110,000 CBMLS
- 2019-09-17 Relisted — CBMLS
- 2019-09-16 Contingent — CBMLS
- 2019-08-28 Listed $125,000 CBMLS
Property tax history
+6.4%/yrLatest (2025): $3,690 · +22.1% YoY. Source: county tax records.
Cash-flow waterfall
monthlySold comps — $/sqft
last 12 mo · ≤1 miLoading sold comps…