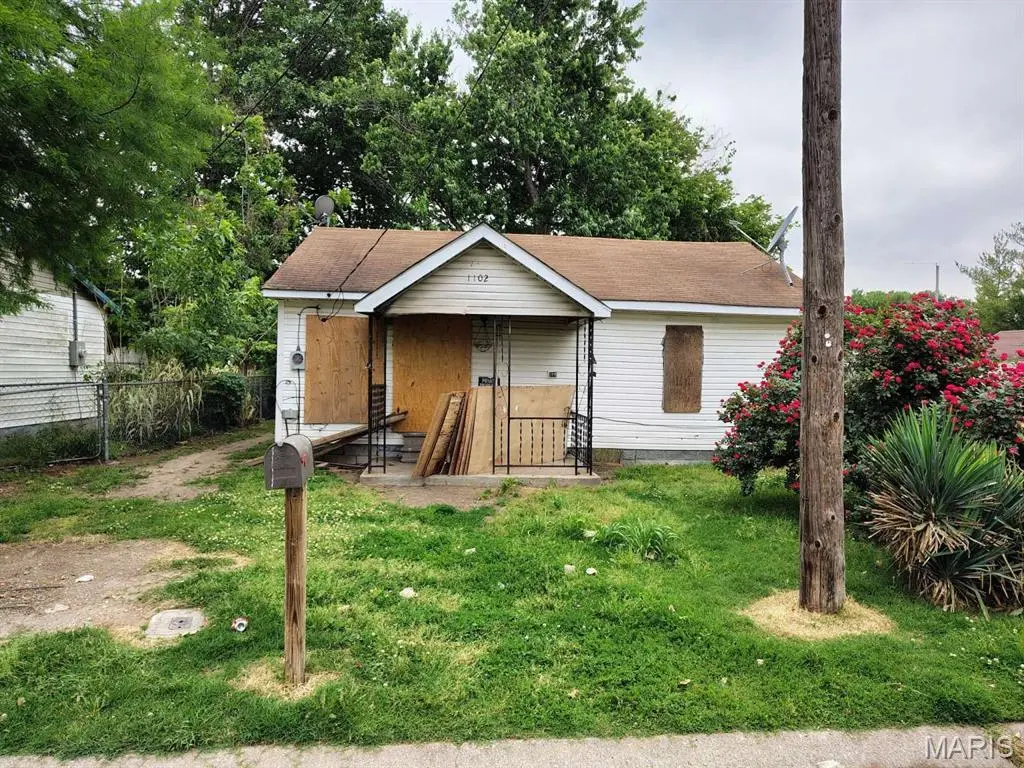
1102 Madison Ave · Caruthersville, MO
Flood risk 6/10 · Moderate
- FEMA flood zone
- AE
- Chance of flooding over 30 yrs
- 0.68%
- Est. flood insurance / yr
- $1,737 – $8,500
Fire risk 1/10 · Minimal
- Est. fire insurance / yr
- $1,054 – $1,958
Heat risk 6/10 · Moderate
- Hot days now (above 108°F)
- 7 days/yr
- Hot days in 30 yrs
- 22 days/yr
Wind risk 4/10 · Minor
- Chance of severe wind over 30 yrs
- 8.0%
Air-quality risk 1/10 · Minimal
- Unhealthy air days now
- 0 days/yr
- Unhealthy air days in 30 yrs
- 0 days/yr
Risk factors via First Street. Map © Google.
Why this score? — see what drove the D+ grade
The composite is a weighted blend of 9 inputs, each scored 0–100. Each bar is that input's sub-score; the figure is the points it added to the 100-point composite (weight × sub-score).
- Cash flow +15.0/30.0
- ARV discount +7.5/15.0
- 1% rule +5.0/10.0
- DSCR +5.0/10.0
- Appreciation +4.3/10.0
- Livability +2.7/5.0
- Rent growth +2.5/5.0
- Condition / age +2.5/5.0
- Schools +1.5/10.0
$10,000
🖨 Deal sheet (PDF) 📄 Offer letter ✓ Due diligence
Listing remarks MLS
Great rental investment property. Three bedrooms, one bathroom, living room, kitchen, dining and utility room. Two outbuildings for storage. Vinyl siding and shingle roof. This is Fannie Mae property.
Key facts
- Utility room
- Kitchen
- Living room
Tags
Property features AI
Exterior
- Utilities: Public water; Public sewer; Single-phase electric service; Electricity and natural gas available and connected; Water and sewer available and connected
- Home design: Single-family residence; One story; Private ownership
- Construction: Frame construction with vinyl siding
- Exterior features: Level lot
Interior
- Bedrooms: Three bedrooms on the main level
- Bathrooms: One full bathroom on the main level
- Heating & cooling: Forced air heating (natural gas); Central air conditioning
- Interior features: Living room fireplace
Neighborhood map
What this means for you Summary
Snapshot
- This is a 3-bed/1.0-bath other listed at $10k.
Deal economics
- At list price, monthly cash flow is $334 ($4k/yr) — positive.
- The deal already cash-flows at list — no discount required.
- Meets the 1% rule at list price ($1k rent vs $10k).
- Recommended offer: $10k (1.5% below list) — sets the bar for market timing.
Location & tenants
- Location reads 54/100 on livability (#780 in MO) — a working-class tenant base; expect higher turnover. Strengths: cost of living A+, housing A+, health & safety A+; Watch: crime F, amenities F, commute F.
- Caruthersville 18 (town): math 14% / reading 24% proficiency, ranked #307 of 324 in MO (top 95%) — low school quality limits family demand, transient renter base, plan for 1-2y turnover; 69% free/reduced lunch — lower-income household profile, screen leases tightly.
- Zoned schools: Caruthersville Elementary (math 21% / reading 23%, grade F, #910 of 1,115 statewide, top 83%, 496 students, 99% FRL); Caruthersville High (math 2% / reading 44%, grade F, #453 of 521 statewide, top 87%, 258 students, 99% FRL) — zoned schools average 99% FRL vs 69% district-wide (30 pts higher); higher-poverty schools than district average — tighter screening recommended.
- Market conditions: 11 active listings in the ZIP; 17 units permitted in Pemiscot County in 2024 (10 in 5+ unit buildings).
Forward outlook
- Local home prices are declining (-1.3%/yr); year-one equity from $69 of loan paydown is wiped out by about $130 of value loss. Plan a longer hold.
- Pemiscot County population projected at -26% by 2050 — secular population decline; favor cash flow + early exit over multi-decade hold.
- At projected returns (-1.3% appreciation + 3.0% rent growth), your $3k cash investment doubles in ~1 year — after that, you're playing with house money.
Negotiation context
- It's been on market 30 days — a 2% lower offer ($10k) is reasonable based on typical stale-listing flexibility.
- 2 sale attempts since 6y ago; this cycle's ask has dropped $6k (38%) from the opening price — seller is motivated, your offer sets the floor, not the list.
Risks & watch-outs
- Watch-outs: property tax is 2.8% of price; flood insurance adds $427/mo; built in 1955 — expect roof / HVAC / electrical / plumbing capex.
- Climate carrying-cost: in FEMA flood zone AE (mandatory federal flood insurance); extreme-heat days projected 7→22/yr by 2055 (HVAC capex compounding) — expect insurance premiums to compound above CPI over the hold.
Questions for the listing agent
- Built in 1955 — when were the roof, HVAC, electrical panel, plumbing, and water heater last replaced?
- Property tax is high relative to price — has the assessment been appealed recently, and will the sale trigger a re-assessment?
- What's the actual annual flood-insurance premium (NFIP or private), and is the property in a SFHA with mandatory coverage?
- Is there a deadline driving the sale (1031 exchange, divorce, estate, relocation)? That informs how much negotiation room exists.
- Schools are F-rated, which usually means shorter tenancies and higher turnover. Who's the typical renter profile here, and what's been the actual vacancy rate?
- Crime grade is F in this area — have there been break-ins, vandalism, or insurance claims at this property in the last 3 years? What carrier currently insures it and at what premium?
- The area grade is low — what's the realistic commute time and amenity access for the typical tenant pool here? Any planned neighborhood developments (good or bad) we should know about?
- What's the average days-on-market for RENTAL listings here right now (not sales)? A rising rental-DOM trend means longer vacancies and softer asking-rent achievability than the comps imply.
- What's the recent tenant-quality profile in this submarket — average credit score on applications, eviction rate, late-payment / NSF rate, and stable-employment percentage? A property-management company in the area should have these aggregated.
- How much new for-sale + rental construction is in the pipeline within 1–3 miles? Heavy new supply typically softens prices + rents 12–24 months out; constrained supply supports both.
Investment metrics
- 1% rule
- 10.63% ✓
- Cap rate
- 97.50%
- Cash-on-cash
- 325.73%
- DSCR
- 15.49
- GRM
- 0.8
CMA / ARV
No comps found within radius.
Projected returns pro-forma
-1.3% appreciation · 3.0% rent growth · sell at horizon
- IRR
- —
- Equity multiple
- 8.37×
- Total profit
- $20,637
- Equity at exit
- $2,270
- IRR
- —
- Equity multiple
- 17.84×
- Total profit
- $47,154
- Equity at exit
- $2,262
Cash invested: $2,800 (down + closing). Projections, not guarantees.
Landlord ↔ Tenant lean methodology
- Overall (STATE)
- 81 Strongly Landlord-Friendly
- State Missouri
- 81 Strongly Landlord-Friendly · R+10
- County
- — inherits STATE
- City
- — inherits STATE
ZIP-level market 63830
- Home prices YoY
- -1.3%
- Active inventory
- 11
- Price-to-rent
- 0.8×
Monthly cashflow live
- Estimated rent
- $1,063 medium interval (Pro) →
- Mortgage (P&I)
- −$52
- Tax from tax record
- −$23 /mo · $276/yr
- Insurance
- −$4
- Flood insurance flood zone
- −$427 /mo · $5,118/yr
- HOA
- −$0
- Vacancy / Maint / Mgmt
- −$223
- Net cashflow
- $334
Break-even live
Sensitivity live
| Price | -10% $339 | -5% $336 | +0% $334 | +5% $331 | +10% $328 |
|---|---|---|---|---|---|
| Rent | -10% $250 | -5% $292 | +0% $334 | +5% $375 | +10% $417 |
| Rate | -1.0pp $339 | -0.5pp $336 | base $334 | +0.5pp $331 | +1.0pp $328 |
UW: 25.0% down · 7.5% · 30yr · 1.5% tax · 5.0% vac · 8.0% maint · 8.0% mgmt
Financing live
Cash to close
- Down payment
- $2,500
- Closing costs
- $300
- Reserves months
- —
- Total cash needed
- —
Loan-product check · same deal, 3 products live
Conventional
25% down · 7.5% · 30yr
- Down + closing
- —
- Monthly P&I
- —
- Monthly cashflow
- —
- DSCR
- —
- Eligible?
- —
Personal DTI + credit; lowest rate.
DSCR
20% down · 8.5% · 30yr
- Down + closing
- —
- Monthly P&I
- —
- Monthly cashflow
- —
- DSCR
- —
- Eligible?
- —
No personal income docs; deal must DSCR.
Hard money
10% down · 12.0% · 12mo
- Down + closing
- —
- Monthly P&I
- —
- Monthly cashflow
- —
- DSCR
- —
- Eligible?
- —
Short-term bridge; refi at stabilization.
Listing history 17 events
-
2026-06-17days on market $10,000 Active 30 DOM
-
2026-06-16days on market $10,000 Active 29 DOM
-
2026-06-15days on market $10,000 Active 28 DOM
-
2026-06-13days on market $10,000 Active 26 DOM
-
2026-06-12days on market $10,000 Active 25 DOM
-
2026-06-09days on market $10,000 Active 22 DOM
-
2026-06-08days on market $10,000 Active 21 DOM
-
2026-06-07days on market $10,000 Active 20 DOM
-
2026-06-07pricedays on market $10,000 Active 19 DOM
-
2026-06-04days on market $12,000 Active 16 DOM
-
2026-06-02days on market $12,000 Active 15 DOM
-
2026-06-01days on market $12,000 Active 14 DOM
-
2026-05-31days on market $12,000 Active 13 DOM
-
2026-05-18$16,000 Active
-
2020-11-06soldstatus 201-char remark
Show marketing remark (201 chars)
Great rental investment property. Three bedrooms, one bathroom, living room, kitchen, dining and utility room. Two outbuildings for storage. Vinyl siding and shingle roof. This is Fannie Mae property.
-
2020-11-05soldstatus 221-char remark
Show marketing remark (221 chars)
PRICE REDUCED !!! Great rental investment property. Three bedrooms, one bathroom, living room, kitchen, dining and utility room. Two outbuildings for storage. Vinyl siding and shingle roof. This is Fannie Mae property.
-
2020-07-09$16,000 221-char remark
Show marketing remark (221 chars)
PRICE REDUCED !!! Great rental investment property. Three bedrooms, one bathroom, living room, kitchen, dining and utility room. Two outbuildings for storage. Vinyl siding and shingle roof. This is Fannie Mae property.
ⓘ Source: listings_history table (triggers on properties + properties_extension) + one-shot
backfill from property_details.listing_events for pre-trigger history.
Tax reassessment forecast MO · Resets to sale price
- Current annual tax
- $276 · $23/mo
- Projected year-2 tax
- $276 · $23/mo
- Expected delta
- $0/yr ($0/mo · 0.0%)
ⓘ Screening estimate from a state-policy table — verify with the county assessor before closing.
Climate risk First Street
- Flood 6/10 Major FEMA zone AE · 68% chance over 30 yrs
- Wildfire 1/10 Low
- Heat 6/10 Major 7 d/yr ≥108°F today · 22 d/yr by 30 yrs out
- Wind 4/10 Moderate 8% chance of damaging wind over 30 yrs
- Air quality 1/10 Low 0 unhealthy d/yr today · 0 by 30 yrs out
Nearby sold comps map
Loading sold comps map…
Walkable amenities ~0.75 mi
Loading nearby amenities…
Taxation est. · year 1
- Rental income
- $12,755
- − Mortgage interest
- −$560
- − Property taxes
- −$276
- − Insurance
- −$5,168
- − Repairs & maintenance
- −$1,020
- − Management
- −$1,020
- − Depreciation
- −$291
- Taxable income
- $4,418
- Est. tax owed @ 24.0%
- −$1,060
- After-tax cash flow
- $2,942/yr
For passive investors: Depreciation is non-cash, so a rental often shows a tax loss while cash-flowing — sheltering income. Rental losses are passive: they offset passive income freely, and up to $25,000/yr can offset ordinary (W-2) income if you actively participate and your MAGI is under $100k (phasing out to $0 by $150k); unused losses carry forward. On sale, claimed depreciation is recaptured at up to 25%, and gains may owe capital-gains tax (a 1031 exchange can defer both). Figures are a year-1 estimate at your 24.0% rate — not tax advice; consult a CPA.
Schools (NCES district)
- District
- Caruthersville 18
- NCES district ID
- 2907470
- Math proficiency
- 14% ▼ -5.00%
- Reading proficiency
- 24% ▼ -6.00%
- Median HH income
- $29,187
- Composite
- 15.06/100
- National rank
- #9349
- State rank
- #307 of 324 in MO
Livability — Caruthersville
- Score
- 54/100
- State rank
- #780
- US rank
- #23872
Category grades
Schools grade is shown separately in the Schools card above.
Census & demographics
- Census place
- Caruthersville, MO
- Population (ZIP)
- 6,315
Population outlook (Pemiscot County) Hauer SSP2
- Today (2025)
- 15,803 people
- By 2030
- 14,934 · -5.5%
- By 2040
- 13,246 · -16.2%
- By 2050
- 11,669 · -26.2%
- By 2075
- 8,426 · -46.7%
- By 2100
- 6,057 · -61.7%
Race, ethnicity, and origin ACS 2023
- Neighborhood character
- Majority White (62%)
- Race & ethnicity
- White 62% Black 30% Hispanic / Latino 5% Two or more races 4%
- Common ancestry
- Lithuanian 2% Slovak 2% Romanian 1%
- Foreign-born
- 3% · Canada
- Languages at home
- 95% English-only · Spanish 4% German/W. Germanic 1%
Political lean MEDSL · Pemiscot
- 2024 margin
- Solid R (+49.1) · D 25.3% · R 74.3%
- 2008→2024 swing
- -35.9pp toward R · 2008: -13.1pp · 2024: -49.1pp
- All cycles
- 2024: R+49.1 2020: R+44.6 2016: R+33.5 2012: R+14.6 2008: R+13.1
Not yet ingested
- Civics
- —
Market trends
- HPI YoY
- ▼ -1.30%
- Current HPI
- 99.2828
- Rent YoY
- —
- Metro
- —
- State GDP YoY
- ▲ 1.84%
- F500 in state
- 20
Industry mix (Fortune 500 HQ in MO)
| Industry | F500 HQs | Revenue |
|---|---|---|
| Healthcare | 1 | $163B |
|
||
| Insurance | 1 | $21B |
|
||
| Industrial Technology | 1 | $17B |
|
||
| Retail | 1 | $16B |
|
||
| Industrial Distribution | 1 | $10B |
|
||
| Utilities | 1 | $9B |
|
||
Price history
+0.0% since first listed4 events — show timeline
- 2026-05-18 Listed $16,000 MARIS as Distributed by MLS Grid
- 2020-11-06 Sold (MLS) — MARIS as Distributed by MLS Grid
- 2020-11-05 Sold (MLS) — CARMLS
- 2020-07-09 Listed $16,000 CARMLS
Property tax history
+0.9%/yrLatest (2025): $276 · -1.7% YoY. Source: county tax records.
Cash-flow waterfall
monthlySold comps — $/sqft
last 12 mo · ≤1 miLoading sold comps…