 🌊 Lakefront
6139 Lakefront · San Antonio, TX
Flood risk 1/10 · Minimal
- FEMA flood zone
- X (unshaded)
- Chance of flooding over 30 yrs
- 0.0%
- Est. flood insurance / yr
- $507 – $1,088
Fire risk 4/10 · Minor
- Est. fire insurance / yr
- $1,222 – $2,270
Heat risk 8/10 · Major
- Hot days now (above 110°F)
- 7 days/yr
- Hot days in 30 yrs
- 22 days/yr
Wind risk 8/10 · Major
- Chance of severe wind over 30 yrs
- 80.0%
Air-quality risk 2/10 · Minimal
- Unhealthy air days now
- 0 days/yr
- Unhealthy air days in 30 yrs
- 2 days/yr
Risk factors via First Street. Map © Google.
Why this score? — see what drove the D- grade
The composite is a weighted blend of 9 inputs, each scored 0–100. Each bar is that input's sub-score; the figure is the points it added to the 100-point composite (weight × sub-score).
- ARV discount +14.1/15.0
- Cash flow +7.9/30.0
- Livability +4.0/5.0
- 1% rule +3.9/10.0
- Rent growth +3.6/5.0
- Condition / age +2.5/5.0
- DSCR +2.0/10.0
- Schools +1.9/10.0
- Appreciation +0.0/10.0
$189,500
🖨 Deal sheet (PDF) 📄 Offer letter ✓ Due diligence
Listing remarks MLS
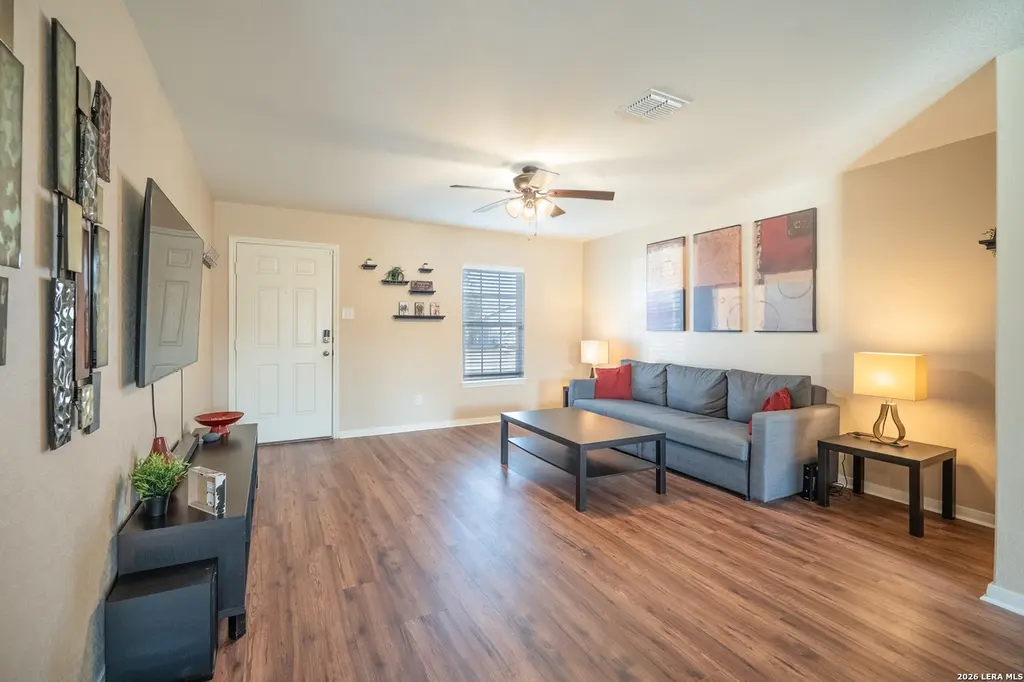
Welcome to 6139 Lakefront, a beautifully maintained 2-story home offering 3 bedrooms and 2.5 bathrooms in a convenient San Antonio location. As you step inside, you'll notice the updated laminate flooring throughout the first floor, creating a modern and easy-to-maintain space for everyday living. The open layout allows for a natural flow between the living, dining, and kitchen areas, making it perfect for both relaxing evenings at home and hosting family or friends. The kitchen is open and includes the refrigerator, which will convey with the sale-adding to the move-in ready appeal of this home. Upstairs, you'll find all three bedrooms together, providing both comfort and privacy away from the main living area. The primary suite features a spacious layout with an ensuite bath, while the secondary bedrooms share a full bathroom and offer flexibility for family, guests, or even a home office. Enjoy the attached one-car attached garage and a backyard that offers room for entertaining, gardening, or simply relaxing outdoors. Some furniture pieces will also be conveying, creating extra value and convenience for the next homeowner. Situated near schools, shopping, restaurants, and major highways, this home offers easy access to everything San Antonio has to offer. Whether you're a first-time homebuyer, looking to upgrade, or searching for an investment, 6139 Lakefront is a wonderful opportunity to make your move. Don't miss your chance on this charming property! Schedule your showing today.
Key facts
- Open layout
- 4,835 sq ft lot
- Garage
Tags
Neighborhood map
What this means for you Summary
Snapshot
- This is a 3-bed/2.5-bath single-family listed at $190k.
Deal economics
- At list price, monthly cash flow is $-198 ($-2k/yr) — negative.
- To cash-flow at today's rent, offer at most $155k (18.5% below list).
- To meet the 1% rule (rent ≥ 1% of price), the offer needs to be $168k (11.1% below list).
- Recommended offer: $155k (18.5% below list) — sets the bar for cash-flow.
- Cap rate 5.0% vs local median 3.8% in San Antonio — top-decile yield for the area; either an underpriced asset or a hidden risk that comps aren't pricing in. Stress-test before assuming the spread holds.
Location & tenants
- Location reads 80/100 on livability (#31 in TX, #1,616 nationally) — a professional / high-income tenant draw. Strengths: amenities A+, commute A+, cost of living A+; Watch: crime F.
- East Central ISD (rural): math 16% / reading 25% proficiency, ranked #758 of 826 in TX (top 92%) — low school quality limits family demand, transient renter base, plan for 1-2y turnover; 61% free/reduced lunch — lower-income household profile, screen leases tightly.
- Zoned schools: Sinclair El (math 13% / reading 20%, grade F, #3,946 of 4,322 statewide, top 92%, 721 students, 71% FRL); Legacy Middle (math 13% / reading 24%, grade F, #1,478 of 1,662 statewide, top 90%, 1,137 students, 58% FRL); East Central H S (math 21% / reading 28%, grade F, #1,264 of 1,632 statewide, top 82%, 3,252 students, 52% FRL) — zoned schools at 60% FRL track the district average.
- Market conditions: Rents rising fast (+4.3%/yr); 444 active listings in the ZIP; 40 comparable units currently listed for rent nearby; rentals at typical pace (median 15d on market — plan ~3-4 weeks tenant-placement turnaround); 8,308 units permitted in Bexar County in 2024 (2,506 in 5+ unit buildings).
- This rent runs 30% of the median local income ($66k/yr) — at the standard rent-burdened threshold; future hikes will face affordability resistance.
Forward outlook
- Local home prices are declining (-3.0%/yr); year-one equity from $1k of loan paydown is wiped out by about $6k of value loss. Plan a longer hold.
- Bexar County population projected at +50% by 2050 — long-run rental-demand tailwind backs the buy-and-hold thesis.
Negotiation context
- It's been on market 103 days — a 9% lower offer ($172k) is reasonable based on typical stale-listing flexibility.
- 4 sale attempts since 7y ago; this cycle's ask has dropped $10k (5%) from the opening price — seller is motivated, your offer sets the floor, not the list.
Risks & watch-outs
- Watch-outs: property tax is 2.6% of price.
- Climate carrying-cost: severe wind risk, 80% chance of damaging wind over 30y; extreme-heat days projected 7→22/yr by 2055 (HVAC capex compounding) — expect insurance premiums to compound above CPI over the hold.
Questions for the listing agent
- What do current leases actually rent for vs. the listed asking? Can we see a recent rent roll and the last 12 months of T-12 income?
- It's been on market 103 days. Have you received any prior offers? Is the seller open to a 18% concession, seller financing, or rate buy-down credit?
- Property tax is high relative to price — has the assessment been appealed recently, and will the sale trigger a re-assessment?
- What does the HOA fee cover, when was the last increase, and are there any pending special assessments or reserve-fund shortfalls?
- Why hasn't it sold? Are there any deal-killer items the seller is aware of (foundation, flood, title, zoning, code violations)?
- Is there a deadline driving the sale (1031 exchange, divorce, estate, relocation)? That informs how much negotiation room exists.
- Crime grade is F in this area — have there been break-ins, vandalism, or insurance claims at this property in the last 3 years? What carrier currently insures it and at what premium?
- The area grade is low — what's the realistic commute time and amenity access for the typical tenant pool here? Any planned neighborhood developments (good or bad) we should know about?
- This sits on a lake — are riparian / water-frontage rights deeded with the parcel? Any dock permits, shoreline easements, or HOA water-use restrictions?
- What's the documented flood / surge / shoreline-erosion history here (FEMA AND non-FEMA — e.g., storm surge, creek backup, septic-field saturation)?
- Any water-quality or seasonal algae-bloom issues that affect tenant satisfaction or short-term-rental demand?
- What's the average days-on-market for RENTAL listings here right now (not sales)? A rising rental-DOM trend means longer vacancies and softer asking-rent achievability than the comps imply.
- What's the recent tenant-quality profile in this submarket — average credit score on applications, eviction rate, late-payment / NSF rate, and stable-employment percentage? A property-management company in the area should have these aggregated.
- How much new for-sale + rental construction is in the pipeline within 1–3 miles? Heavy new supply typically softens prices + rents 12–24 months out; constrained supply supports both.
Investment metrics
- 1% rule
- 0.89% ✗
- Cap rate
- 5.04%
- Cash-on-cash
- -4.48%
- DSCR
- 0.80
- GRM
- 9.4
CMA / ARV
- ARV (median comp)
- $222,062
- List price
- $189,500
- Delta
- -14.66%
- Verdict
- UNDERPRICED
- Comps
- 20 within 1.0 mi
Show comp detail 12 sales within ~0.75 mi
| Address | Dist | Beds/Ba | Sqft | Sold | Price | $/sf | Match |
|---|---|---|---|---|---|---|---|
| 6423 Woodcliff Bnd | 0.26mi | 3/2.5 | 1,415 (0%) | 3mo | $190,000 | $134 | 85 |
| 6127 Southern Vis | 0.45mi | 3/2.5 | 1,415 (0%) | 1mo | $189,900 | $134 | 78 |
| 3831 Southton | 0.54mi | 3/2.5 | 1,415 (0%) | 1mo | $190,000 | $134 | 74 |
| 6223 Still Mdw | 0.23mi | 3/2.0 | 1,330 (-6%) | 5mo | $139,000 | $105 | 73 |
| 6018 Bear Mdw | 0.23mi | 3/2.0 | 1,344 (-5%) | 8mo | $115,000 | $86 | 73 |
| 6139 Still Mdw | 0.15mi | 3/2.0 | 1,556 (+10%) | 6mo | $200,000 | $129 | 70 |
| 6119 Still Mdw | 0.10mi | 3/2.0 | 1,595 (+13%) | 5mo | $254,000 | $159 | 68 |
| 3330 Rosalind | 0.49mi | 3/2.5 | 1,488 (+5%) | 8mo | $155,000 | $104 | 62 |
| 5922 Lakedale | 0.34mi | 3/2.0 | 1,288 (-9%) | 9mo | $170,000 | $132 | 60 |
| 6002 Blind | 0.35mi | 3/2.0 | 1,232 (-13%) | 2mo | $100,000 | $81 | 59 |
| 2814 Lakebriar | 0.45mi | 4/2.0 (+1) | 1,488 (+5%) | 6mo | $114,900 | $77 | 58 |
| 3402 Rosalind Way | 0.51mi | 3/2.0 | 1,595 (+13%) | 6mo | $209,000 | $131 | 48 |
Match score weights: distance 35% · size 25% · config 20% · recency 20%. Top-matched comps best support the ARV.
Projected returns pro-forma
-3.0% appreciation · 4.35% rent growth · sell at horizon
- IRR
- -22.0%
- Equity multiple
- 0.23×
- Total profit
- $-40,845
- Equity at exit
- $28,255
- IRR
- -12.3%
- Equity multiple
- 0.22×
- Total profit
- $-41,385
- Equity at exit
- $16,384
Cash invested: $53,060 (down + closing). Projections, not guarantees.
Landlord ↔ Tenant lean methodology
- Overall (STATE)
- 87 Strongly Landlord-Friendly
- State Texas
- 87 Strongly Landlord-Friendly · R+5
- County
- — inherits STATE
- City
- — inherits STATE
ZIP-level market 78222
- Home prices YoY
- -4.8%
- Rents YoY
- 4.3%
- Active inventory
- 444
- Price-to-rent
- 9.4×
Monthly cashflow live
- Estimated rent
- $1,684 high interval (Pro) →
- Mortgage (P&I)
- −$994
- Tax from tax record
- −$414 /mo · $4,966/yr
- Insurance
- −$79
- HOA
- −$42
- Vacancy / Maint / Mgmt
- −$354
- Net cashflow
- $-198
Break-even live
Sensitivity live
| Price | -10% $-91 | -5% $-144 | +0% $-198 | +5% $-252 | +10% $-305 |
|---|---|---|---|---|---|
| Rent | -10% $-331 | -5% $-265 | +0% $-198 | +5% $-132 | +10% $-65 |
| Rate | -1.0pp $-103 | -0.5pp $-150 | base $-198 | +0.5pp $-247 | +1.0pp $-297 |
UW: 25.0% down · 7.5% · 30yr · 1.5% tax · 5.0% vac · 8.0% maint · 8.0% mgmt
Financing live
Cash to close
- Down payment
- $47,375
- Closing costs
- $5,685
- Reserves months
- —
- Total cash needed
- —
Loan-product check · same deal, 3 products live
Conventional
25% down · 7.5% · 30yr
- Down + closing
- —
- Monthly P&I
- —
- Monthly cashflow
- —
- DSCR
- —
- Eligible?
- —
Personal DTI + credit; lowest rate.
DSCR
20% down · 8.5% · 30yr
- Down + closing
- —
- Monthly P&I
- —
- Monthly cashflow
- —
- DSCR
- —
- Eligible?
- —
No personal income docs; deal must DSCR.
Hard money
10% down · 12.0% · 12mo
- Down + closing
- —
- Monthly P&I
- —
- Monthly cashflow
- —
- DSCR
- —
- Eligible?
- —
Short-term bridge; refi at stabilization.
Rent comps 40 comps
| Address | Beds | Baths | Sqft | Rent | $/sqft | DOM | Units | Dist |
|---|---|---|---|---|---|---|---|---|
| 6119 Lakefront St San Antonio, TX | 3.0 | 2.5 | 1246 | $1,495 | $1.20 | 45d | 1 | 0.02mi |
| 6147 Still Mdw San Antonio, TX | 3.0 | 2.0 | 1556 | $1,459 | $0.94 | 4d | 1 | 0.18mi |
| 2906 Lavender Mdw San Antonio, TX | 3.0 | 2.5 | 1246 | $1,495 | $1.20 | 3d | 1 | 0.20mi |
| 6123 Flower Mdw San Antonio, TX | 4.0 | 2.0 | 1800 | $1,795 | $1.00 | 45d | 1 | 0.23mi |
| 6223 Still Mdw San Antonio, TX | 3.0 | 2.0 | 1330 | $1,650 | $1.24 | 6d | 1 | 0.25mi |
| 2951 Lavender Mdw San Antonio, TX | 3.0 | 2.5 | 1246 | $1,530 | $1.23 | 14d | 1 | 0.29mi |
| 6427 Woodcliff Bnd San Antonio, TX | 3.0 | 2.5 | 1247 | $1,440 | $1.15 | 12d | 1 | 0.30mi |
| 3155 Begonia Bnd San Antonio, TX | 3.0 | 2.0 | 1552 | $1,495 | $0.96 | 14d | 1 | 0.37mi |
| 3219 Begonia Bnd San Antonio, TX | 3.0 | 2.0 | 1552 | $1,500 | $0.97 | 6d | 1 | 0.41mi |
| 2610 Lakebriar St San Antonio, TX | 3.0 | 2.0 | 1724 | $1,675 | $0.97 | 45d | 1 | 0.42mi |
| 6307 Sloane Cv San Antonio, TX | 3.0 | 2.5 | 1416 | $1,460 | $1.03 | 0d | 1 | 0.44mi |
| 6115 Southern Vis San Antonio, TX | 3.0 | 2.0 | 1415 | $1,509 | $1.07 | 5d | 1 | 0.44mi |
| 3131 Rosalind Way San Antonio, TX | 3.0 | 2.5 | 1247 | $1,650 | $1.32 | 25d | 1 | 0.44mi |
| 3239 Begonia Bnd San Antonio, TX | 3.0 | 2.0 | 1552 | $1,435 | $0.92 | 25d | 1 | 0.45mi |
| 6119 Southern Vis San Antonio, TX | 3.0 | 2.5 | 1246 | $1,685 | $1.35 | 25d | 1 | 0.45mi |
| 2911 Lakebriar St San Antonio, TX | 4.0 | 2.0 | 1440 | $1,695 | $1.18 | 23d | 1 | 0.49mi |
| 2911 Lakebriar St San Antonio, TX | 4.0 | 2.0 | 1440 | $1,695 | $1.18 | 4d | 1 | 0.49mi |
| 6323 Sinclair Rd San Antonio, TX | 3.0 | 2.0 | 1556 | $1,510 | $0.97 | 25d | 1 | 0.58mi |
| 5910 Sandy Lake St San Antonio, TX | 3.0 | 2.0 | 1389 | $2,100 | $1.51 | 45d | 1 | 0.76mi |
| 6230 Lake Victoria St San Antonio, TX | 3.0 | 2.0 | 1205 | $1,465 | $1.22 | 4d | 1 | 0.76mi |
| 6023 Lake Victoria St San Antonio, TX | 3.0 | 2.0 | 1368 | $1,575 | $1.15 | 14d | 1 | 0.86mi |
| 3535 Honey Mdw San Antonio, TX | 3.0 | 2.5 | 1438 | $1,400 | $0.97 | 18d | 1 | 0.92mi |
| 5334 Hickory Pl San Antonio, TX | 3.0 | 2.0 | 1401 | $1,650 | $1.18 | 45d | 1 | 0.93mi |
| 3510 Bottomless Lk San Antonio, TX | 2.0 | 2.0 | 1068 | $1,150 | $1.08 | 45d | 1 | 0.94mi |
| 5322 Flying Hooves San Antonio, TX | 3.0 | 2.5 | 1604 | $1,900 | $1.18 | 21d | 1 | 0.97mi |
| 5322 Flying Hooves San Antonio, TX | 3.0 | 2.5 | 1604 | $1,900 | $1.18 | 0d | 1 | 0.97mi |
| 5227 Hickory Pl San Antonio, TX | 3.0 | 2.0 | 1199 | $1,700 | $1.42 | 25d | 1 | 1.01mi |
| 5338 Natho St San Antonio, TX | 3.0 | 2.0 | 1298 | $1,349 | $1.04 | 14d | 1 | 1.05mi |
| 5334 Natho St San Antonio, TX | 3.0 | 2.0 | 1298 | $1,325 | $1.02 | 6d | 1 | 1.06mi |
| 4734 Shale Cv San Antonio, TX | 3.0 | 2.0 | 1247 | $1,725 | $1.38 | 25d | 1 | 1.07mi |
| 2718 Bermuda Dr San Antonio, TX | 3.0 | 2.0 | 1080 | $1,400 | $1.30 | 0d | 1 | 1.11mi |
| 5962 Celestite Bnd San Antonio, TX | 3.0 | 2.0 | 1190 | $1,723 | $1.45 | 0d | 1 | 1.12mi |
| 2719 Bermuda Dr San Antonio, TX | 3.0 | 2.0 | 1298 | $1,350 | $1.04 | 0d | 1 | 1.14mi |
| 2434 Bermuda Dr San Antonio, TX | 3.0 | 2.0 | 1298 | $1,390 | $1.07 | 0d | 1 | 1.14mi |
| 2430 Bermuda Dr San Antonio, TX | 3.0 | 2.0 | 1298 | $1,390 | $1.07 | 14d | 1 | 1.14mi |
| 4910 Sandstone Way San Antonio, TX | 3.0 | 2.5 | 1849 | $1,750 | $0.95 | 23d | 1 | 1.19mi |
| 4910 Sandstone Way San Antonio, TX | 3.0 | 2.5 | 1850 | $1,750 | $0.95 | 5d | 1 | 1.19mi |
| 5011 Jade Xing San Antonio, TX | 3.0 | 2.5 | 1239 | $1,590 | $1.28 | 45d | 1 | 1.31mi |
| 5011 Blue Rnch San Antonio, TX | 3.0 | 2.5 | 1529 | $1,740 | $1.14 | 45d | 1 | 1.31mi |
| 5015 Jade Xing San Antonio, TX | 4.0 | 2.5 | 1798 | $1,820 | $1.01 | 12d | 1 | 1.31mi |
HOA detail
- Monthly dues
- $42 · $504/yr
Listing history 16 events
-
2026-06-07statusdays on market $189,500 Pending 103 DOM
-
2026-06-04days on market $189,500 Active Option 101 DOM
-
2026-06-03days on market $189,500 Active Option 100 DOM
-
2026-06-02days on market $189,500 Active Option 99 DOM
-
2026-06-01days on market $189,500 Active Option 98 DOM
-
2026-05-31days on market $189,500 Active Option 97 DOM
-
2026-04-21price $189,500 1510-char remark
Show marketing remark (1510 chars)
Welcome to 6139 Lakefront, a beautifully maintained 2-story home offering 3 bedrooms and 2.5 bathrooms in a convenient San Antonio location. As you step inside, you'll notice the updated laminate flooring throughout the first floor, creating a modern and easy-to-maintain space for everyday living. The open layout allows for a natural flow between the living, dining, and kitchen areas, making it perfect for both relaxing evenings at home and hosting family or friends. The kitchen is open and includes the refrigerator, which will convey with the sale-adding to the move-in ready appeal of this home. Upstairs, you'll find all three bedrooms together, providing both comfort and privacy away from the main living area. The primary suite features a spacious layout with an ensuite bath, while the secondary bedrooms share a full bathroom and offer flexibility for family, guests, or even a home office. Enjoy the attached one-car attached garage and a backyard that offers room for entertaining, gardening, or simply relaxing outdoors. Some furniture pieces will also be conveying, creating extra value and convenience for the next homeowner. Situated near schools, shopping, restaurants, and major highways, this home offers easy access to everything San Antonio has to offer. Whether you're a first-time homebuyer, looking to upgrade, or searching for an investment, 6139 Lakefront is a wonderful opportunity to make your move. Don't miss your chance on this charming property! Schedule your showing today.
-
2026-02-23$200,000 New 1510-char remark
Show marketing remark (1510 chars)
Welcome to 6139 Lakefront, a beautifully maintained 2-story home offering 3 bedrooms and 2.5 bathrooms in a convenient San Antonio location. As you step inside, you'll notice the updated laminate flooring throughout the first floor, creating a modern and easy-to-maintain space for everyday living. The open layout allows for a natural flow between the living, dining, and kitchen areas, making it perfect for both relaxing evenings at home and hosting family or friends. The kitchen is open and includes the refrigerator, which will convey with the sale-adding to the move-in ready appeal of this home. Upstairs, you'll find all three bedrooms together, providing both comfort and privacy away from the main living area. The primary suite features a spacious layout with an ensuite bath, while the secondary bedrooms share a full bathroom and offer flexibility for family, guests, or even a home office. Enjoy the attached one-car attached garage and a backyard that offers room for entertaining, gardening, or simply relaxing outdoors. Some furniture pieces will also be conveying, creating extra value and convenience for the next homeowner. Situated near schools, shopping, restaurants, and major highways, this home offers easy access to everything San Antonio has to offer. Whether you're a first-time homebuyer, looking to upgrade, or searching for an investment, 6139 Lakefront is a wonderful opportunity to make your move. Don't miss your chance on this charming property! Schedule your showing today.
-
2026-02-22historical
-
2026-01-07price $200,000
-
2025-08-21$210,000 New
-
2019-07-12soldstatus Sold
-
2019-04-06historical
-
2019-04-01$176,900
-
2019-04-01historical
-
2019-03-01$178,900 New
ⓘ Source: listings_history table (triggers on properties + properties_extension) + one-shot
backfill from property_details.listing_events for pre-trigger history.
Tax reassessment forecast TX · Resets to sale price
- Current annual tax
- $4,966 · $414/mo
- Projected year-2 tax
- $4,966 · $414/mo
- Expected delta
- $0/yr ($0/mo · 0.0%)
ⓘ Screening estimate from a state-policy table — verify with the county assessor before closing.
Climate risk First Street
- Flood 1/10 Low FEMA zone X (unshaded) · 0% chance over 30 yrs
- Wildfire 4/10 Moderate
- Heat 8/10 Severe 7 d/yr ≥110°F today · 22 d/yr by 30 yrs out
- Wind 8/10 Severe 80% chance of damaging wind over 30 yrs
- Air quality 2/10 Low 0 unhealthy d/yr today · 2 by 30 yrs out
Nearby sold comps map
Loading sold comps map…
Walkable amenities ~0.75 mi
Loading nearby amenities…
Taxation est. · year 1
- Rental income
- $20,210
- − Mortgage interest
- −$10,615
- − Property taxes
- −$4,966
- − Insurance
- −$948
- − Repairs & maintenance
- −$1,617
- − Management
- −$1,617
- − HOA
- −$504
- − Depreciation
- −$5,513
- Taxable loss
- −$5,569
- Est. tax savings @ 24.0%
- +$1,337
- After-tax cash flow
- $-1,040/yr
For passive investors: Depreciation is non-cash, so a rental often shows a tax loss while cash-flowing — sheltering income. Rental losses are passive: they offset passive income freely, and up to $25,000/yr can offset ordinary (W-2) income if you actively participate and your MAGI is under $100k (phasing out to $0 by $150k); unused losses carry forward. On sale, claimed depreciation is recaptured at up to 25%, and gains may owe capital-gains tax (a 1031 exchange can defer both). Figures are a year-1 estimate at your 24.0% rate — not tax advice; consult a CPA.
Schools (NCES district)
- District
- East Central ISD
- NCES district ID
- 4817850
- Math proficiency
- 16% ▼ -12.00%
- Reading proficiency
- 25% ▼ -6.00%
- Median HH income
- $53,941
- Composite
- 18.67/100
- National rank
- #8887
- State rank
- #758 of 826 in TX
Livability — San Antonio
- Score
- 80/100
- State rank
- #31
- US rank
- #1616
Category grades
Schools grade is shown separately in the Schools card above.
Census & demographics
- Census place
- San Antonio, TX
- County
- Bexar County · 1,990,555 people
- City population
- 1,806,925
- Metro
- San Antonio-New Braunfels, TX
- Population (ZIP)
- 26,476
- Household income
- $66,362
- Rent vs Own
- Severe rent burden
- 686.0
Population outlook (Bexar County) Hauer SSP2
- Today (2025)
- 2,336,851 people
- By 2030
- 2,560,728 · +9.6%
- By 2040
- 3,020,569 · +29.3%
- By 2050
- 3,493,522 · +49.5%
- By 2075
- 4,668,459 · +99.8%
- By 2100
- 5,533,242 · +136.8%
Race, ethnicity, and origin ACS 2023
- Neighborhood character
- Majority Hispanic (64%)
- Race & ethnicity
- Hispanic / Latino 64% Two or more races 26% White 19% Black 14% Asian 1%
- Hispanic origin (detail)
- Mexican 55%
- Common ancestry
- Romanian 1% Italian 1% Slovak 1%
- Foreign-born
- 14% · Canada
- Languages at home
- 61% English-only · Spanish 37% Arabic 1%
Political lean MEDSL · Bexar
- 2024 margin
- Lean D (+9.8) · D 54.3% · R 44.6% · Other 1.1%
- 2008→2024 swing
- +4.2pp toward D · 2008: 5.6pp · 2024: 9.8pp
- All cycles
- 2024: D+9.8 2020: D+18.2 2016: D+13.5 2012: D+4.6 2008: D+5.6
Not yet ingested
- Civics
- —
Market trends
- HPI YoY
- ▼ -14.18%
- Current HPI
- 278.8429
- Rent YoY
- ▲ 4.35%
- Metro
- San Antonio-New Braunfels, TX
- State GDP YoY
- ▲ 3.95%
- F500 in state
- 110
Industry mix (Fortune 500 HQ in TX)
| Industry | F500 HQs | Revenue |
|---|---|---|
| Energy | 16 | $1,198B |
|
||
| Technology | 5 | $198B |
|
||
| Engineering / Construction | 4 | $72B |
|
||
| Energy Services | 3 | $60B |
|
||
| Utilities | 3 | $41B |
|
||
| Healthcare | 2 | $330B |
|
||
Price history
+5.9% since first listed10 events — show timeline
- 2026-04-21 Price Changed $189,500 LERA
- 2026-02-23 Listed $200,000 LERA
- 2026-02-22 Listing Removed — LERA
- 2026-01-07 Price Changed $200,000 LERA
- 2025-08-21 Listed $210,000 LERA
- 2019-07-12 Sold (MLS) — LERA
- 2019-04-06 Listing Removed — LERA
- 2019-04-01 Listing Removed — LERA
- 2019-04-01 Listed $176,900 LERA
- 2019-03-01 Listed $178,900 LERA
Property tax history
+38.6%/yrLatest (2025): $4,966 · +3.7% YoY. Source: county tax records.
Cash-flow waterfall
monthlySold comps — $/sqft
last 12 mo · ≤1 miLoading sold comps…