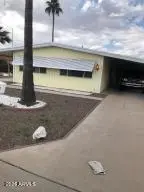
19222 N Pierson Rd · Peoria, AZ
Flood risk 1/10 · Minimal
- FEMA flood zone
- X (shaded)
- Chance of flooding over 30 yrs
- 0.0%
- Est. flood insurance / yr
- $507 – $1,088
Fire risk 3/10 · Minor
- Est. fire insurance / yr
- $610 – $1,132
Heat risk 9/10 · Severe
- Hot days now (above 113°F)
- 7 days/yr
- Hot days in 30 yrs
- 16 days/yr
Wind risk 1/10 · Minimal
- Chance of severe wind over 30 yrs
- —
Air-quality risk 2/10 · Minimal
- Unhealthy air days now
- 1 days/yr
- Unhealthy air days in 30 yrs
- 1 days/yr
Risk factors via First Street. Map © Google.
Why this score? — see what drove the B+ grade
The composite is a weighted blend of 9 inputs, each scored 0–100. Each bar is that input's sub-score; the figure is the points it added to the 100-point composite (weight × sub-score).
- Cash flow +30.0/30.0
- ARV discount +15.0/15.0
- DSCR +10.0/10.0
- 1% rule +8.3/10.0
- Livability +3.8/5.0
- Schools +3.5/10.0
- Rent growth +2.5/5.0
- Condition / age +2.5/5.0
- Appreciation +0.0/10.0
$155,000
🖨 Deal sheet 📄 Offer letter ✓ Due diligence
Listing remarks
This home offers a great location and size of lot. backyard is enclosed with cyclone fencing and has a nice storge shed. Lot is 8744 sq ft. , home was remodeled 7 years ago but was not maintained well. The A. C, was replaced with a new unit 7 years ago and no issues with roof. Convenient to Arrowhead Mall and grocery stores. A great value for the handy man.
Key facts
- Cyclone fencing
- Storage shed
- New a.c unit
Tags
Property features AI
Finance
- Other: Lot has gravel/stone front and back
- HOA & community: Monthly association fee of $24 covering grounds maintenance and street maintenance; Community pool
Exterior
- Parking: 2 covered parking spaces; 2 open parking spaces; 2 carport spaces
- Utilities: City water; Septic tank sewer
- Home design: Manufactured/mobile housing; Fee simple ownership; Fixer condition; City-maintained road access; Concrete and asphalt road surface
- Construction: Aluminum siding; Steel frame construction; Reflective coating roof
- Exterior features: Screened-in patio(s); Private street(s); Chain link fencing; Shed(s)
Interior
- Kitchen: Dishwasher
- Bedrooms: 2 possible bedrooms
- Flooring: Vinyl flooring
- Bathrooms: 2 full bathrooms
- Heating & cooling: Central air; Ceiling fan(s); Has heating
- Interior features: Breakfast bar; Full bathroom in master bedroom
- Laundry & utility: Washer/dryer hook-ups only
Neighborhood map
What this means for you Summary
Snapshot
- This is a 2-bed/2.0-bath manufactured listed at $155k.
Deal economics
- At list price, monthly cash flow is $694 ($8k/yr) — positive.
- The deal already cash-flows at list — no discount required.
- Meets the 1% rule at list price ($2k rent vs $155k).
- Cap rate 11.7% vs local median 3.3% in Peoria — top-decile yield for the area; either an underpriced asset or a hidden risk that comps aren't pricing in. Stress-test before assuming the spread holds.
Location & tenants
- Location reads 76/100 on livability (#14 in AZ, #3,603 nationally) — a middle-class / working-renter tenant base. Strengths: housing A+, commute A, employment A; Watch: cost of living C-, amenities D, health & safety F.
- Peoria Unified School District (4237) (suburban): math 36% / reading 42% proficiency, ranked #64 of 249 in AZ (top 26%) — families likely to look elsewhere, expect single-tenant / working-renter base with shorter leases.
- Zoned schools: Parkridge Elementary (math 52% / reading 52%, grade C-, #243 of 1,109 statewide, top 23%, 886 students, 30% FRL); Peoria High School (math 18% / reading 22%, grade F, #225 of 381 statewide, top 60%, 1,566 students, 54% FRL).
- Market conditions: 53 active listings in the ZIP; 27 comparable units currently listed for rent nearby; rentals at typical pace (median 24d on market — plan ~3-4 weeks tenant-placement turnaround); 36,011 units permitted in Maricopa County in 2024 (12,801 in 5+ unit buildings).
- This rent runs 34% of the median local income ($72k/yr) — at the standard rent-burdened threshold; future hikes will face affordability resistance.
Forward outlook
- Local home prices are declining (-3.0%/yr); year-one equity from $1k of loan paydown is wiped out by about $5k of value loss. Plan a longer hold.
- Maricopa County population projected at +38% by 2050 — long-run rental-demand tailwind backs the buy-and-hold thesis.
- At projected returns (-3.0% appreciation + 3.0% rent growth), your $43k cash investment doubles in ~7 years — after that, you're playing with house money.
Negotiation context
- Only 12 days on market — expect competitive offers; lowballing is unlikely to land.
- 6 sale attempts since 6y ago with the ask held roughly flat each time — persistent listings suggest the price (not the market) is what's stuck; bring a comps-based counter.
Risks & watch-outs
- Climate carrying-cost: extreme-heat days projected 7→16/yr by 2055 (HVAC capex compounding) — expect insurance premiums to compound above CPI over the hold.
Questions for the listing agent
- Built in 1971 — when were the roof, HVAC, electrical panel, plumbing, and water heater last replaced?
- What does the HOA fee cover, when was the last increase, and are there any pending special assessments or reserve-fund shortfalls?
- Is there a deadline driving the sale (1031 exchange, divorce, estate, relocation)? That informs how much negotiation room exists.
- Schools are B-rated — typically a magnet for longer-tenancy family renters. What's the average tenant stay here, and is there a school-zone premium baked into asking?
- What's the average days-on-market for RENTAL listings here right now (not sales)? A rising rental-DOM trend means longer vacancies and softer asking-rent achievability than the comps imply.
- What's the recent tenant-quality profile in this submarket — average credit score on applications, eviction rate, late-payment / NSF rate, and stable-employment percentage? A property-management company in the area should have these aggregated.
- How much new for-sale + rental construction is in the pipeline within 1–3 miles? Heavy new supply typically softens prices + rents 12–24 months out; constrained supply supports both.
Investment metrics
- 1% rule
- 1.33% ✓
- Cap rate
- 11.67%
- Cash-on-cash
- 19.20%
- DSCR
- 1.85
- GRM
- 6.3
CMA / ARV
- ARV (median comp)
- $220,000
- List price
- $155,000
- Delta
- -29.55%
- Verdict
- UNDERPRICED
- Comps
- 5 within 1.0 mi
Show comp detail 5 sales within ~0.75 mi
| Address | Dist | Beds/Ba | Sqft | Sold | Price | $/sf | Match |
|---|---|---|---|---|---|---|---|
| 19010 N Mark Ln | 0.19mi | 3/2.0 (+1) | 1,456 (+1%) | 11mo | $263,000 | $181 | 75 |
| 19039 N Dinero Rd | 0.16mi | 3/2.0 (+1) | 1,297 (-10%) | 1mo | $205,000 | $158 | 70 |
| 19067 N Mark Ln | 0.12mi | 2/2.0 | 1,302 (-10%) | 14mo | $265,000 | $204 | 67 |
| 10808 W Sack Dr | 0.24mi | 3/2.0 (+1) | 1,440 (0%) | 22mo | $220,000 | $153 | 66 |
| 10743 W Sack Dr | 0.26mi | 3/2.0 (+1) | 1,344 (-7%) | 12mo | $264,900 | $197 | 62 |
Match score weights: distance 35% · size 25% · config 20% · recency 20%. Top-matched comps best support the ARV.
Projected returns pro-forma
-3.0% appreciation · 3.0% rent growth · sell at horizon
- IRR
- 11.1%
- Equity multiple
- 1.44×
- Total profit
- $19,053
- Equity at exit
- $23,111
- IRR
- 20.1%
- Equity multiple
- 2.69×
- Total profit
- $73,311
- Equity at exit
- $13,402
Cash invested: $43,400 (down + closing). Projections, not guarantees.
Landlord ↔ Tenant lean methodology
- Overall (STATE)
- 87 Strongly Landlord-Friendly
- State Arizona
- 87 Strongly Landlord-Friendly · R+3
- County
- — inherits STATE
- City
- — inherits STATE
ZIP-level market 85373
- Active inventory
- 53
- Price-to-rent
- 6.3×
Monthly cashflow live
- Estimated rent
- $2,055 high interval (Pro) →
- Mortgage (P&I)
- −$813
- Tax from tax record
- −$27 /mo · $330/yr
- Insurance
- −$65
- HOA
- −$24
- Vacancy / Maint / Mgmt
- −$432
- Net cashflow
- $694
Break-even live
UW: 25.0% down · 7.5% · 30yr · 1.5% tax · 5.0% vac · 8.0% maint · 8.0% mgmt
Financing live
Cash to close
- Down payment
- $38,750
- Closing costs
- $4,650
- Reserves months
- —
- Total cash needed
- —
Loan-product check · same deal, 3 products live
Conventional
25% down · 7.5% · 30yr
- Down + closing
- —
- Monthly P&I
- —
- Monthly cashflow
- —
- DSCR
- —
- Eligible?
- —
Personal DTI + credit; lowest rate.
DSCR
20% down · 8.5% · 30yr
- Down + closing
- —
- Monthly P&I
- —
- Monthly cashflow
- —
- DSCR
- —
- Eligible?
- —
No personal income docs; deal must DSCR.
Hard money
10% down · 12.0% · 12mo
- Down + closing
- —
- Monthly P&I
- —
- Monthly cashflow
- —
- DSCR
- —
- Eligible?
- —
Short-term bridge; refi at stabilization.
Rent comps 27 comps
| Address | Beds | Baths | Sqft | Rent | $/sqft | DOM | Units | Dist |
|---|---|---|---|---|---|---|---|---|
| 11065 W Marco Polo Rd Peoria, AZ | 3.0 | 2.0 | 1677 | $1,795 | $1.07 | 24d | 1 | 0.43mi |
| 19910 N 110th Ln Peoria, AZ | 3.0 | 2.0 | 1409 | $3,000 | $2.13 | 43d | 1 | 0.50mi |
| 10763 W Runion Dr Peoria, AZ | 2.0 | 2.0 | 1776 | $2,000 | $1.13 | 43d | 1 | 0.72mi |
| 20341 N 105th Ave Peoria, AZ | 3.0 | 2.0 | 1299 | $3,000 | $2.31 | 43d | 1 | 0.79mi |
| 10509 W Runion Dr Peoria, AZ | 3.0 | 2.0 | 1295 | $4,000 | $3.09 | 43d | 1 | 0.84mi |
| 10310 W Beardsley Rd Peoria, AZ | 2.0–3.0 | 2.0 | 1098 | $1,925 | $1.75 | 2d | 7 | 0.89mi |
| 11476 W Madisen Ellise Dr Surprise, AZ | 3.0 | 2.0 | 1301 | $2,070 | $1.59 | 43d | 1 | 1.06mi |
| 10359 W Ross Ave Peoria, AZ | 3.0 | 2.0 | 1120 | $2,200 | $1.96 | 43d | 1 | 1.11mi |
| 19636 N Coyote Lakes Pkwy Surprise, AZ | 3.0 | 2.0 | 1615 | $2,195 | $1.36 | 18d | 1 | 1.13mi |
| 11669 W Pine Mountain Ct Surprise, AZ | 3.0 | 2.0 | 1370 | $2,100 | $1.53 | 43d | 1 | 1.13mi |
| 20702 N Lake Pleasant Rd Peoria, AZ | 2.0–3.0 | 2.0 | 1051 | $1,440 | $1.37 | 1d | 3 | 1.16mi |
| 19702 N 98th Ln Peoria, AZ | 2.0 | 2.0 | 1417 | $2,300 | $1.62 | 24d | 1 | 1.16mi |
| 10134 W Mohawk Ln Peoria, AZ | 2.0 | 1.0–2.0 | 827 | $1,299 | $1.57 | 43d | 1 | 1.16mi |
| 10134 W Mohawk Ln Apt 1017 Peoria, AZ | 2.0 | 2.0 | 1149 | $1,400 | $1.22 | 14d | 1 | 1.19mi |
| 10134 W Mohawk Ln Peoria, AZ | 1.0–2.0 | 1.0–2.0 | 992 | $1,400 | $1.41 | 12d | 5 | 1.20mi |
| 19609 N 98th Dr Peoria, AZ | 2.0 | 2.0 | 1653 | $2,895 | $1.75 | 43d | 1 | 1.25mi |
| 9803 W Kimberly Way Peoria, AZ | 2.0 | 2.0 | 1655 | $1,800 | $1.09 | 24d | 1 | 1.26mi |
| 17447 N Avenue of the Arts Surprise, AZ | 2.0 | 2.0 | 1078 | $1,813 | $1.68 | 12d | 1 | 1.34mi |
| 17447 N Avenue of the Arts Surprise, AZ | 3.0 | 2.0 | 1183 | $1,981 | $1.67 | 1d | 1 | 1.34mi |
| 17590 N 114th Ln Surprise, AZ | 3.0 | 2.5 | 1737 | $1,695 | $0.98 | 24d | 1 | 1.36mi |
| 17590 N 114th Ln Surprise, AZ | 3.0 | 3.0 | 1737 | $1,695 | $0.98 | 5d | 1 | 1.36mi |
| 9833 W Yukon Dr Peoria, AZ | 3.0 | 2.0 | 1667 | $2,100 | $1.26 | 3d | 1 | 1.37mi |
| 17447 Avenue of the Arts Unit 2 Surprise, AZ | 2.0 | 2.0 | 1078 | $1,732 | $1.61 | 24d | 1 | 1.41mi |
| 17447 Avenue of the Arts Unit 3 Surprise, AZ | 3.0 | 2.0 | 1183 | $1,822 | $1.54 | 24d | 1 | 1.41mi |
| 9825 W Runion Dr Peoria, AZ | 3.0 | 2.0 | 1667 | $2,400 | $1.44 | 20d | 1 | 1.43mi |
| 9830 W Runion Dr Peoria, AZ | 3.0 | 2.0 | 1283 | $1,985 | $1.55 | 1d | 1 | 1.43mi |
| 18942 N 96th Ln Peoria, AZ | 2.0 | 2.0 | 1520 | $1,945 | $1.28 | 5d | 1 | 1.43mi |
HOA detail
- Monthly dues
- $24 · $288/yr
Listing history 21 events
-
2026-05-15$155,000 Active 361-char remark
-
2026-04-14historical
-
2026-04-06status Active
-
2026-03-24historical
-
2026-03-24$149,999 Active
-
2025-12-23historical
-
2025-11-04price $169,000
-
2025-10-28price $175,000
-
2025-10-20price $195,000
-
2025-10-15price $210,000
-
2025-10-02price $220,000
-
2025-09-25$245,000 Active
-
2020-10-16soldstatus $169,999 Closed
-
2020-10-16soldstatus $169,999
-
2020-09-12$169,000 Active
-
2020-02-19soldstatus $115,000 Closed
-
2020-02-19soldstatus $115,000
-
2020-02-09historical Under Contract Accepting Backups
-
2020-01-30$125,000 Active
-
1992-09-11soldstatus $45,000
-
1987-09-08soldstatus $48,000
ⓘ Source: listings_history table (triggers on properties + properties_extension) + one-shot
backfill from property_details.listing_events for pre-trigger history.
Tax reassessment forecast AZ · Resets to sale price
- Current annual tax
- $330 · $27/mo
- Projected year-2 tax
- $1,023 · $85/mo
- Expected delta
- +$693/yr (+$58/mo · 210.4%)
ⓘ Screening estimate from a state-policy table — verify with the county assessor before closing.
Climate risk First Street
- Flood 1/10 Low FEMA zone X (shaded) · 0% chance over 30 yrs
- Wildfire 3/10 Moderate
- Heat 9/10 Extreme 7 d/yr ≥113°F today · 16 d/yr by 30 yrs out
- Wind 1/10 Low
- Air quality 2/10 Low 1 unhealthy d/yr today · 1 by 30 yrs out
Nearby sold comps map
Loading sold comps map…
Walkable amenities ~0.75 mi
Loading nearby amenities…
Taxation est. · year 1
- Rental income
- $24,657
- − Mortgage interest
- −$8,682
- − Property taxes
- −$330
- − Insurance
- −$775
- − Repairs & maintenance
- −$1,973
- − Management
- −$1,973
- − HOA
- −$288
- − Depreciation
- −$4,509
- Taxable income
- $6,128
- Est. tax owed @ 24.0%
- −$1,471
- After-tax cash flow
- $6,862/yr
For passive investors: Depreciation is non-cash, so a rental often shows a tax loss while cash-flowing — sheltering income. Rental losses are passive: they offset passive income freely, and up to $25,000/yr can offset ordinary (W-2) income if you actively participate and your MAGI is under $100k (phasing out to $0 by $150k); unused losses carry forward. On sale, claimed depreciation is recaptured at up to 25%, and gains may owe capital-gains tax (a 1031 exchange can defer both). Figures are a year-1 estimate at your 24.0% rate — not tax advice; consult a CPA.
Schools (NCES district)
- District
- Peoria Unified School District (4237)
- NCES district ID
- 0406250
- Math proficiency
- 36% ▼ -14.00%
- Reading proficiency
- 42% ▼ -8.00%
- Median HH income
- $60,171
- Composite
- 34.62/100
- National rank
- #5152
- State rank
- #64 of 249 in AZ
Livability — Peoria
- Score
- 76/100
- State rank
- #14
- US rank
- #3603
Category grades
Schools grade is shown separately in the Schools card above.
Census & demographics
- Census place
- Peoria, AZ
- County
- Maricopa County · 4,537,380 people
- City population
- 206,687
- Metro
- Phoenix-Mesa-Chandler, AZ
- Population (ZIP)
- 20,254
- Household income
- $72,063
- Rent vs Own
- Severe rent burden
- 383.0
Population outlook (Maricopa County) Hauer SSP2
- Today (2025)
- 4,979,203 people
- By 2030
- 5,378,229 · +8.0%
- By 2040
- 6,156,598 · +23.6%
- By 2050
- 6,872,376 · +38.0%
- By 2075
- 8,401,270 · +68.7%
- By 2100
- 9,247,439 · +85.7%
Race, ethnicity, and origin ACS 2023
- Neighborhood character
- Predominantly White (84%)
- Race & ethnicity
- White 84% Hispanic / Latino 9% Two or more races 9% Black 2% Asian 1%
- Hispanic origin (detail)
- Mexican 6%
- Common ancestry
- Romanian 4% Portuguese 3% Lithuanian 3%
- Foreign-born
- 6% · Canada, South Korea
- Languages at home
- 91% English-only · Spanish 5% Russian/Polish/Slavic 1% Arabic 1%
Political lean MEDSL · Maricopa
- 2024 margin
- Toss-up / Even · D 47.7% · R 51.2% · Other 1.1%
- 2008→2024 swing
- +7.1pp toward D · 2008: -10.6pp · 2024: -3.5pp
- All cycles
- 2024: R+3.5 2020: D+2.2 2016: R+3.5 2012: R+12.0 2008: R+10.6
Not yet ingested
- Civics
- —
Market trends
- HPI YoY
- ▼ -327.80%
- Current HPI
- 261.3749
- Rent YoY
- —
- Metro
- Phoenix-Mesa-Chandler, AZ
- State GDP YoY
- ▲ 4.54%
- F500 in state
- 20
Industry mix (Fortune 500 HQ in AZ)
| Industry | F500 HQs | Revenue |
|---|---|---|
| Technology | 2 | $13B |
|
||
| Mining / Metals | 1 | $23B |
|
||
| Environmental Services | 1 | $16B |
|
||
| Metals / Steel | 1 | $14B |
|
||
| Technology Distribution | 1 | $9B |
|
||
| Homebuilding | 1 | $8B |
|
||
Price history
+191.7% since first listed23 events — show timeline
- 2026-06-03 Sold (MLS) $140,000 ARMLS
- 2026-05-27 Pending — ARMLS
- 2026-05-15 Listed $155,000 ARMLS
- 2026-04-14 Listing Removed — ARMLS
- 2026-04-06 Relisted — ARMLS
- 2026-03-24 Listing Removed — ARMLS
- 2026-03-24 Listed $149,999 ARMLS
- 2025-12-23 Listing Removed — ARMLS
- 2025-11-04 Price Changed $169,000 ARMLS
- 2025-10-28 Price Changed $175,000 ARMLS
- 2025-10-20 Price Changed $195,000 ARMLS
- 2025-10-15 Price Changed $210,000 ARMLS
- 2025-10-02 Price Changed $220,000 ARMLS
- 2025-09-25 Listed $245,000 ARMLS
- 2020-10-16 Sold (Public Records) $169,999 Public Records
- 2020-10-16 Sold (MLS) $169,999 ARMLS
- 2020-09-12 Listed $169,000 ARMLS
- 2020-02-19 Sold (Public Records) $115,000 Public Records
- 2020-02-19 Sold (MLS) $115,000 ARMLS
- 2020-02-09 Contingent — ARMLS
- 2020-01-30 Listed $125,000 ARMLS
- 1992-09-11 Sold (Public Records) $45,000 Public Records
- 1987-09-08 Sold (Public Records) $48,000 Public Records
Property tax history
-2.3%/yrLatest (2025): $330 · +2.8% YoY. Source: county tax records.
Cash-flow waterfall
monthlySold comps — $/sqft
last 12 mo · ≤1 miLoading sold comps…