 10-Plex
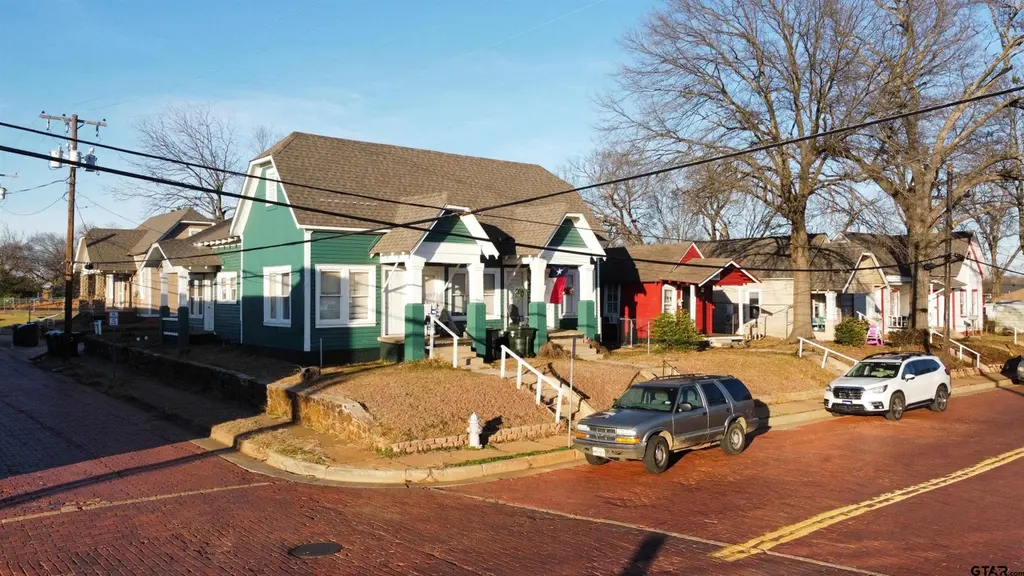
400 E Ferguson St · Tyler, TX
Flood risk 1/10 · Minimal
- FEMA flood zone
- X (unshaded)
- Chance of flooding over 30 yrs
- 0.0%
- Est. flood insurance / yr
- $507 – $1,088
Fire risk 1/10 · Minimal
- Est. fire insurance / yr
- $1,222 – $2,270
Heat risk 7/10 · Major
- Hot days now (above 109°F)
- 7 days/yr
- Hot days in 30 yrs
- 27 days/yr
Wind risk 6/10 · Moderate
- Chance of severe wind over 30 yrs
- 59.0%
Air-quality risk 2/10 · Minimal
- Unhealthy air days now
- 0 days/yr
- Unhealthy air days in 30 yrs
- 1 days/yr
Risk factors via First Street. Map © Google.
Why this score? — see what drove the B- grade
The composite is a weighted blend of 9 inputs, each scored 0–100. Each bar is that input's sub-score; the figure is the points it added to the 100-point composite (weight × sub-score).
- Cash flow +30.0/30.0
- 1% rule +10.0/10.0
- DSCR +10.0/10.0
- ARV discount +7.5/15.0
- Livability +3.8/5.0
- Schools +3.3/10.0
- Rent growth +3.1/5.0
- Condition / age +2.2/5.0
- Appreciation +0.0/10.0
$730,000
🖨 Deal sheet 📄 Offer letter ✓ Due diligence
Multi-family units
County records classify this as Multi-Family (5+ Unit). Listing-text estimate: 10 units. confirmed
5+ unit building — per-unit beds/baths from public records are typically unavailable; the breakdown below (if shown) is an estimate from the listing text.
Listing remarks MLS
Prime redevelopment opportunity with strong cash flow in Downtown Tyler. This 7-building, 10-unit property sits one block from the new Smith County Courthouse and generates $8,600/month in rental income, providing solid returns while you plan a future multifamily or mixed-use project. Surrounded by major public and private investment, this location offers exceptional appreciation potential and rare scale in Tyler’s fastest-improving district.
Key facts
- Rental income
- Multifamily income
- Built 1930
Tags
Neighborhood map
What this means for you Summary
Snapshot
- This is a 10 × 10-bed/?-bath units multifamily listed at $730k. Condition is rated fair.
Deal economics
- At list price, monthly cash flow is $8k ($101k/yr) — positive. Per door: $846/mo.
- The deal already cash-flows at list — no discount required.
- Meets the 1% rule at list price ($17k rent vs $730k).
- Recommended offer: $642k (12.0% below list) — sets the bar for market timing.
- Cap rate 20.2% vs local median 3.6% in Tyler — top-decile yield for the area; either an underpriced asset or a hidden risk that comps aren't pricing in. Stress-test before assuming the spread holds.
Location & tenants
- Location reads 75/100 on livability (#147 in TX, #4,181 nationally) — a middle-class / working-renter tenant base. Strengths: cost of living A+, housing A+, health & safety A+; Watch: employment C-, schools D+, crime D+.
- Tyler ISD (urban): math 39% / reading 38% proficiency, ranked #449 of 826 in TX (top 54%) — families likely to look elsewhere, expect single-tenant / working-renter base with shorter leases; 66% free/reduced lunch — lower-income household profile, screen leases tightly.
- Market conditions: Rents rising (+2.3%/yr); 155 active listings in the ZIP; 595 units permitted in Smith County in 2024 (45 in 5+ unit buildings).
- At $17,091/mo this rent would consume 398% of the median local household income ($52k/yr) (locally 803% of renters already pay >50% of income on rent) — very limited rent-growth headroom before tenants either downsize or default.
Forward outlook
- Local home prices are declining (-3.0%/yr); year-one equity from $5k of loan paydown is wiped out by about $22k of value loss. Plan a longer hold.
- Smith County population projected at +24% by 2050 — long-run rental-demand tailwind backs the buy-and-hold thesis.
- At projected returns (-3.0% appreciation + 2.3% rent growth), your $204k cash investment doubles in ~3 years — after that, you're playing with house money.
Negotiation context
- It's been on market 206 days — a 12% lower offer ($642k) is reasonable based on typical stale-listing flexibility.
- 2 sale attempts; this cycle's ask has dropped $80k (10%) from the opening price — seller is motivated, your offer sets the floor, not the list.
Risks & watch-outs
- Watch-outs: built in 1930 — expect roof / HVAC / electrical / plumbing capex.
- Climate carrying-cost: major wind risk, 59% chance of damaging wind over 30y; extreme-heat days projected 7→27/yr by 2055 (HVAC capex compounding) — expect insurance premiums to compound above CPI over the hold.
Questions for the listing agent
- It's been on market 206 days. Have you received any prior offers? Is the seller open to a 12% concession, seller financing, or rate buy-down credit?
- Can we see the unit-by-unit rent roll, current vacancy, and any below-market leases? What's the average tenancy length?
- What capital expenditures (roof, boiler, parking lot, exteriors) have been made in the last 5 years, and what's planned in the next 2?
- Have any recent inspections been done? Can we get a copy of the seller's disclosures and any deferred-maintenance estimates?
- Built in 1930 — when were the roof, HVAC, electrical panel, plumbing, and water heater last replaced?
- Why hasn't it sold? Are there any deal-killer items the seller is aware of (foundation, flood, title, zoning, code violations)?
- Is there a deadline driving the sale (1031 exchange, divorce, estate, relocation)? That informs how much negotiation room exists.
- Schools are D-rated, which usually means shorter tenancies and higher turnover. Who's the typical renter profile here, and what's been the actual vacancy rate?
- Crime grade is D in this area — have there been break-ins, vandalism, or insurance claims at this property in the last 3 years? What carrier currently insures it and at what premium?
- What's the average days-on-market for RENTAL listings here right now (not sales)? A rising rental-DOM trend means longer vacancies and softer asking-rent achievability than the comps imply.
- What's the recent tenant-quality profile in this submarket — average credit score on applications, eviction rate, late-payment / NSF rate, and stable-employment percentage? A property-management company in the area should have these aggregated.
- How much new apartment / multifamily construction is in the pipeline within 1–3 miles? Heavy new supply (>2% of stock underway) typically softens rents 12–24 months out; light construction supports rent growth.
Investment metrics
- 1% rule
- 2.34% ✓
- Cap rate
- 20.19%
- Cash-on-cash
- 49.65%
- DSCR
- 3.21
- GRM
- 3.6
CMA / ARV
No comps found within radius.
Projected returns pro-forma
-3.0% appreciation · 2.27% rent growth · sell at horizon
- IRR
- 46.5%
- Equity multiple
- 3.00×
- Total profit
- $408,135
- Equity at exit
- $108,845
- IRR
- 51.9%
- Equity multiple
- 5.89×
- Total profit
- $999,625
- Equity at exit
- $63,117
Cash invested: $204,400 (down + closing). Projections, not guarantees.
Landlord ↔ Tenant lean methodology
- Overall (STATE)
- 87 Strongly Landlord-Friendly
- State Texas
- 87 Strongly Landlord-Friendly · R+5
- County
- — inherits STATE
- City
- — inherits STATE
ZIP-level market 75702
- Home prices YoY
- -5.8%
- Rents YoY
- 2.3%
- Active inventory
- 155
- Price-to-rent
- 35.6×
Monthly cashflow live
- Estimated rent
- $17,091 medium interval (Pro) →
- Mortgage (P&I)
- −$3,828
- Tax est. 1.5%
- −$912 /mo · $10,950/yr
- Insurance
- −$304
- HOA
- −$0
- Vacancy / Maint / Mgmt
- −$3,589
- Net cashflow
- $8,457
Break-even live
10-unit breakdown (identical units grouped — click to expand)
| Units | Beds | Baths | Est. rent |
|---|---|---|---|
| 10× units | 10 | — | $17,090 |
| #1 | 10 | — | $1,709 |
| #2 | 10 | — | $1,709 |
| #3 | 10 | — | $1,709 |
| #4 | 10 | — | $1,709 |
| #5 | 10 | — | $1,709 |
| #6 | 10 | — | $1,709 |
| #7 | 10 | — | $1,709 |
| #8 | 10 | — | $1,709 |
| #9 | 10 | — | $1,709 |
| #10 | 10 | — | $1,709 |
| Total (10 units) | $17,091 | ||
UW: 25.0% down · 7.5% · 30yr · 1.5% tax · 5.0% vac · 8.0% maint · 8.0% mgmt
Financing live
Cash to close
- Down payment
- $182,500
- Closing costs
- $21,900
- Reserves months
- —
- Total cash needed
- —
Loan-product check · same deal, 3 products live
Conventional
25% down · 7.5% · 30yr
- Down + closing
- —
- Monthly P&I
- —
- Monthly cashflow
- —
- DSCR
- —
- Eligible?
- —
Personal DTI + credit; lowest rate.
DSCR
20% down · 8.5% · 30yr
- Down + closing
- —
- Monthly P&I
- —
- Monthly cashflow
- —
- DSCR
- —
- Eligible?
- —
No personal income docs; deal must DSCR.
Hard money
10% down · 12.0% · 12mo
- Down + closing
- —
- Monthly P&I
- —
- Monthly cashflow
- —
- DSCR
- —
- Eligible?
- —
Short-term bridge; refi at stabilization.
Listing history 23 events
-
2026-06-19days on market $730,000 Active 206 DOM
-
2026-06-18days on market $730,000 Active 205 DOM
-
2026-06-17days on market $730,000 Active 204 DOM
-
2026-06-16days on market $730,000 Active 203 DOM
-
2026-06-15days on market $730,000 Active 202 DOM
-
2026-06-14days on market $730,000 Active 200 DOM
-
2026-06-13pricedays on market $730,000 Active 199 DOM
-
2026-06-10days on market $770,000 Active 197 DOM
-
2026-06-09days on market $770,000 Active 196 DOM
-
2026-06-08days on market $770,000 Active 195 DOM
-
2026-06-07days on market $770,000 Active 194 DOM
-
2026-06-05days on market $770,000 Active 191 DOM
-
2026-06-02days on market $770,000 Active 189 DOM
-
2026-06-01days on market $770,000 Active 188 DOM
-
2026-05-31days on market $770,000 Active 187 DOM
-
2026-05-30days on market $770,000 Active 186 DOM
-
2026-04-02price $770,000 457-char remark
Show marketing remark (457 chars)
Prime redevelopment opportunity with strong cash flow in Downtown Tyler. This 7-building, 10-unit property sits one block from the new Smith County Courthouse and generates $8,600/month in rental income, providing solid returns while you plan a future multifamily or mixed-use project. Surrounded by major public and private investment, this location offers exceptional appreciation potential and rare scale in Tyler’s fastest-improving district.
-
2026-02-10status Active 457-char remark
Show marketing remark (457 chars)
Prime redevelopment opportunity with strong cash flow in Downtown Tyler. This 7-building, 10-unit property sits one block from the new Smith County Courthouse and generates $8,600/month in rental income, providing solid returns while you plan a future multifamily or mixed-use project. Surrounded by major public and private investment, this location offers exceptional appreciation potential and rare scale in Tyler’s fastest-improving district.
-
2026-01-16price $790,000 457-char remark
Show marketing remark (457 chars)
Prime redevelopment opportunity with strong cash flow in Downtown Tyler. This 7-building, 10-unit property sits one block from the new Smith County Courthouse and generates $8,600/month in rental income, providing solid returns while you plan a future multifamily or mixed-use project. Surrounded by major public and private investment, this location offers exceptional appreciation potential and rare scale in Tyler’s fastest-improving district.
-
2025-11-18$810,000 Active 457-char remark
Show marketing remark (457 chars)
Prime redevelopment opportunity with strong cash flow in Downtown Tyler. This 7-building, 10-unit property sits one block from the new Smith County Courthouse and generates $8,600/month in rental income, providing solid returns while you plan a future multifamily or mixed-use project. Surrounded by major public and private investment, this location offers exceptional appreciation potential and rare scale in Tyler’s fastest-improving district.
-
2025-09-08price $870,000
-
2025-06-23price $940,000
-
2025-05-08price $950,000
ⓘ Source: listings_history table (triggers on properties + properties_extension) + one-shot
backfill from property_details.listing_events for pre-trigger history.
Climate risk First Street
- Flood 1/10 Low FEMA zone X (unshaded) · 0% chance over 30 yrs
- Wildfire 1/10 Low
- Heat 7/10 Severe 7 d/yr ≥109°F today · 27 d/yr by 30 yrs out
- Wind 6/10 Major 59% chance of damaging wind over 30 yrs
- Air quality 2/10 Low 0 unhealthy d/yr today · 1 by 30 yrs out
Nearby sold comps map
Loading sold comps map…
Walkable amenities ~0.75 mi
Loading nearby amenities…
Taxation est. · year 1
- Rental income
- $205,092
- − Mortgage interest
- −$40,891
- − Property taxes
- −$10,950
- − Insurance
- −$3,650
- − Repairs & maintenance
- −$16,407
- − Management
- −$16,407
- − Depreciation
- −$21,236
- Taxable income
- $95,550
- Est. tax owed @ 24.0%
- −$22,932
- After-tax cash flow
- $78,552/yr
For passive investors: Depreciation is non-cash, so a rental often shows a tax loss while cash-flowing — sheltering income. Rental losses are passive: they offset passive income freely, and up to $25,000/yr can offset ordinary (W-2) income if you actively participate and your MAGI is under $100k (phasing out to $0 by $150k); unused losses carry forward. On sale, claimed depreciation is recaptured at up to 25%, and gains may owe capital-gains tax (a 1031 exchange can defer both). Figures are a year-1 estimate at your 24.0% rate — not tax advice; consult a CPA.
Condition & rehab AI · 4 photos
This 10-unit multifamily property requires moderate rehabilitation to improve its condition and increase its value. Repairs and maintenance are needed in the exterior, flooring, interior walls, and landscaping. Upgrades to the exterior, HVAC, and landscaping would significantly enhance its resale and rental value.
Repairs flagged
- Major exterior siding — Significant wear and tear
- Major flooring — Worn-out carpet
- Major interior walls — Peeling paint
- Major landscaping — Overgrown yard
Value-add opportunities
- Both exterior painting — Enhances curb appeal and property value
- Both HVAC replacement — Improves comfort and energy efficiency
- Both landscaping — Enhances curb appeal and property value
- Both flooring replacement — Improves comfort and property value
Renovation cost estimate screening
| Repair item | Severity | Est. cost |
|---|---|---|
| exterior siding · Significant wear and tear | Major | $15,000–50,000 |
| flooring · Worn-out carpet | Major | $15,000–50,000 |
| interior walls · Peeling paint | Major | $15,000–50,000 |
| landscaping · Overgrown yard | Major | $15,000–50,000 |
| Total estimated repair cost · 4 items | $60,000–200,000 |
Value-add ROI direction
- Both exterior painting — Enhances curb appeal and property value ↑
- Both HVAC replacement — Improves comfort and energy efficiency ↑
- Both landscaping — Enhances curb appeal and property value ↑
- Both flooring replacement — Improves comfort and property value ↑
ⓘ Cost ranges are severity-bucket heuristics (US national rule-of-thumb). Get contractor quotes + a written scope before underwriting a rehab budget.
Schools (NCES district)
- District
- Tyler ISD
- NCES district ID
- 4843470
- Math proficiency
- 39% ▼ -4.00%
- Reading proficiency
- 38% ▼ -1.00%
- Median HH income
- $44,090
- Composite
- 32.69/100
- National rank
- #5650
- State rank
- #449 of 826 in TX
Livability — Tyler
- Score
- 75/100
- State rank
- #147
- US rank
- #4181
Category grades
Schools grade is shown separately in the Schools card above.
Census & demographics
- Census place
- Tyler, TX
- County
- Smith County · 180,570 people
- City population
- 127,842
- Metro
- Tyler, TX
- Population (ZIP)
- 27,927
- Household income
- $51,564
- Rent vs Own
- Severe rent burden
- 803.0
Population outlook (Smith County) Hauer SSP2
- Today (2025)
- 248,890 people
- By 2030
- 261,665 · +5.1%
- By 2040
- 286,114 · +15.0%
- By 2050
- 308,006 · +23.8%
- By 2075
- 354,171 · +42.3%
- By 2100
- 372,828 · +49.8%
Race, ethnicity, and origin ACS 2023
- Neighborhood character
- Diverse neighborhood (Simpson 0.61)
- Race & ethnicity
- Hispanic / Latino 49% Black 37% White 12% Two or more races 11% Native American 1%
- Hispanic origin (detail)
- Mexican 47%
- Common ancestry
- Lithuanian 1%
- Foreign-born
- 20% · Canada
- Languages at home
- 56% English-only · Spanish 44%
Political lean MEDSL · Smith
- 2024 margin
- Solid R (+45.1) · D 27.0% · R 72.1%
- 2008→2024 swing
- -5.6pp toward R · 2008: -39.5pp · 2024: -45.1pp
- All cycles
- 2024: R+45.1 2020: R+39.4 2016: R+43.9 2012: R+46.9 2008: R+39.5
Not yet ingested
- Civics
- —
Market trends
- HPI YoY
- ▼ -12.63%
- Current HPI
- 207.1573
- Rent YoY
- ▲ 2.27%
- Metro
- Tyler, TX
- State GDP YoY
- ▲ 3.95%
- F500 in state
- 110
Industry mix (Fortune 500 HQ in TX)
| Industry | F500 HQs | Revenue |
|---|---|---|
| Energy | 16 | $1,198B |
|
||
| Technology | 5 | $198B |
|
||
| Engineering / Construction | 4 | $72B |
|
||
| Energy Services | 3 | $60B |
|
||
| Utilities | 3 | $41B |
|
||
| Healthcare | 2 | $330B |
|
||
Price history
-18.9% since first listed7 events — show timeline
- 2026-04-02 Price Changed $770,000 GTAR
- 2026-02-10 Relisted — GTAR
- 2026-01-16 Price Changed $790,000 GTAR
- 2025-11-18 Listed $810,000 GTAR
- 2025-09-08 Price Changed $870,000 GTAR
- 2025-06-23 Price Changed $940,000 GTAR
- 2025-05-08 Price Changed $950,000 GTAR
Cash-flow waterfall
monthlySold comps — $/sqft
last 12 mo · ≤1 miLoading sold comps…