4150 Wilson Hollow Rd · Corning, NY
Flood risk 10/10 · Severe
- FEMA flood zone
- A
- Chance of flooding over 30 yrs
- 0.99%
- Est. flood insurance / yr
- $946 – $6,584
Fire risk 3/10 · Minor
- Est. fire insurance / yr
- $691 – $1,283
Heat risk 2/10 · Minimal
- Hot days now (above 92°F)
- 7 days/yr
- Hot days in 30 yrs
- 16 days/yr
Wind risk 1/10 · Minimal
- Chance of severe wind over 30 yrs
- —
Air-quality risk 1/10 · Minimal
- Unhealthy air days now
- 0 days/yr
- Unhealthy air days in 30 yrs
- 0 days/yr
Risk factors via First Street. Map © Google.
Why this score? — see what drove the D grade
The composite is a weighted blend of 9 inputs, each scored 0–100. Each bar is that input's sub-score; the figure is the points it added to the 100-point composite (weight × sub-score).
- Cash flow +13.9/30.0
- ARV discount +7.5/15.0
- 1% rule +4.7/10.0
- Livability +4.4/5.0
- DSCR +4.2/10.0
- Schools +4.2/10.0
- Rent growth +2.5/5.0
- Condition / age +2.5/5.0
- Appreciation +0.0/10.0
$148,500
🖨 Deal sheet 📄 Offer letter ✓ Due diligence
Listing remarks MLS
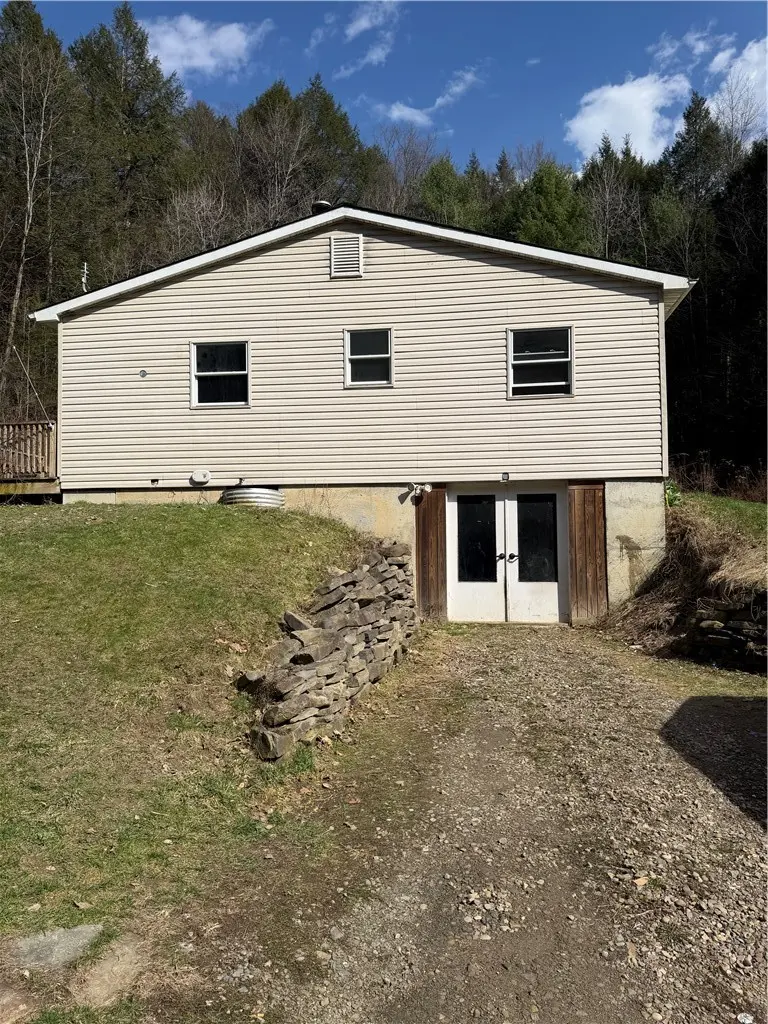
Ranch house with a private setting. Needs a little TLC. Den/office could be 3rd bedroom. Freddie Mac first look initiative for owner occupant through 1/17/2015
Key facts
- Single-bay space
- 1.15 acre lot
- Garage
Tags
Property features AI
Exterior
- Parking: Underground parking; 1-car garage with storage and workshop; Garage has electricity
- Utilities: Electricity connected (circuit breakers); Well water; Septic sewer; High-speed internet available
- Home design: Ranch model; 2 stories; Existing construction; Shingle roof; Block foundation; Resale condition; Lot dimensions approximately 39 x 200 (1.15 acres)
- Construction: Vinyl siding; Copper and PEX plumbing; Shingle roof
- Exterior features: Deck; Open porch; Private yard; Gravel driveway; Shed(s) and additional storage; Propane tank (leased); Secluded, rectangular lot
Interior
- Kitchen: Electric oven; Electric range; Microwave; Refrigerator
- Bedrooms: 3 main-level bedrooms; Includes a garage apartment and studio among room types
- Flooring: Vinyl flooring; Varied flooring throughout
- Bathrooms: 2 full bathrooms (both on the main level)
- Heating & cooling: Electric heating; Propane heating; Baseboard heating; Hot water heating; Window cooling units
- Interior features: Ceiling fans; Separate/formal living room; Kitchen and family room combined; Living/dining room; Storage; Bath in primary bedroom; Primary suite; Main level primary; Bedroom on main level; Workshop
- Laundry & utility: Washer and dryer; Laundry located in basement
Neighborhood map
What this means for you Summary
Snapshot
- This is a 2-bed/2.0-bath single-family listed at $148k.
Deal economics
- At list price, monthly cash flow is $-296 ($-4k/yr) — negative.
- To cash-flow at today's rent, offer at most $96k (35.3% below list).
- To meet the 1% rule (rent ≥ 1% of price), the offer needs to be $144k (2.7% below list).
- Recommended offer: $96k (35.3% below list) — sets the bar for cash-flow.
Location & tenants
- Location reads 87/100 on livability (#14 in NY, #334 nationally) — a professional / high-income tenant draw. Strengths: amenities A+, housing A+, health & safety A+; Watch: employment D.
- Corning City School District (town): math 44% / reading 53% proficiency, ranked #406 of 590 in NY (top 69%) — families likely to look elsewhere, expect single-tenant / working-renter base with shorter leases.
- Market conditions: 106 active listings in the ZIP; 196 units permitted in Steuben County in 2024 (0 in 5+ unit buildings).
Forward outlook
- Local home prices are declining (-3.0%/yr); year-one equity from $1k of loan paydown is wiped out by about $4k of value loss. Plan a longer hold.
- Steuben County population projected at -20% by 2050 — secular population decline; favor cash flow + early exit over multi-decade hold.
Negotiation context
- Only 2 days on market — expect competitive offers; lowballing is unlikely to land.
- 2 sale attempts since 12y ago with the ask held roughly flat each time — persistent listings suggest the price (not the market) is what's stuck; bring a comps-based counter.
- Current owner paid $45k; list at $148k implies a 230% gain — meaningful room to come down on a strong offer.
Risks & watch-outs
- Watch-outs: flood insurance adds $314/mo.
- Climate carrying-cost: in FEMA flood zone A (mandatory federal flood insurance) — expect insurance premiums to compound above CPI over the hold.
Questions for the listing agent
- What do current leases actually rent for vs. the listed asking? Can we see a recent rent roll and the last 12 months of T-12 income?
- Built in 1970 — when were the roof, HVAC, electrical panel, plumbing, and water heater last replaced?
- What's the actual annual flood-insurance premium (NFIP or private), and is the property in a SFHA with mandatory coverage?
- Is there a deadline driving the sale (1031 exchange, divorce, estate, relocation)? That informs how much negotiation room exists.
- Schools are A-rated — typically a magnet for longer-tenancy family renters. What's the average tenant stay here, and is there a school-zone premium baked into asking?
- The area grade is low — what's the realistic commute time and amenity access for the typical tenant pool here? Any planned neighborhood developments (good or bad) we should know about?
- What's the average days-on-market for RENTAL listings here right now (not sales)? A rising rental-DOM trend means longer vacancies and softer asking-rent achievability than the comps imply.
- What's the recent tenant-quality profile in this submarket — average credit score on applications, eviction rate, late-payment / NSF rate, and stable-employment percentage? A property-management company in the area should have these aggregated.
- How much new for-sale + rental construction is in the pipeline within 1–3 miles? Heavy new supply typically softens prices + rents 12–24 months out; constrained supply supports both.
Investment metrics
- 1% rule
- 0.97% ✗
- Cap rate
- 6.43%
- Cash-on-cash
- 0.50%
- DSCR
- 1.02
- GRM
- 8.6
CMA / ARV
No comps found within radius.
Projected returns pro-forma
-3.0% appreciation · 3.0% rent growth · sell at horizon
- IRR
- -31.1%
- Equity multiple
- -0.03×
- Total profit
- $-42,667
- Equity at exit
- $22,142
- IRR
- -32.9%
- Equity multiple
- -0.45×
- Total profit
- $-60,347
- Equity at exit
- $12,840
Cash invested: $41,580 (down + closing). Projections, not guarantees.
Landlord ↔ Tenant lean methodology
- Overall (STATE)
- 15 Strongly Tenant-Friendly
- State New York
- 15 Strongly Tenant-Friendly · D+10
- County
- — inherits STATE
- City
- — inherits STATE
ZIP-level market 14830
- Active inventory
- 106
- Price-to-rent
- 8.6×
Monthly cashflow live
- Estimated rent
- $1,444 medium interval (Pro) →
- Mortgage (P&I)
- −$779
- Tax from tax record
- −$283 /mo · $3,396/yr
- Insurance
- −$62
- Flood insurance flood zone
- −$314 /mo · $3,765/yr
- HOA
- −$0
- Vacancy / Maint / Mgmt
- −$303
- Net cashflow
- $-296
Break-even live
UW: 25.0% down · 7.5% · 30yr · 1.5% tax · 5.0% vac · 8.0% maint · 8.0% mgmt
Financing live
Cash to close
- Down payment
- $37,125
- Closing costs
- $4,455
- Reserves months
- —
- Total cash needed
- —
Loan-product check · same deal, 3 products live
Conventional
25% down · 7.5% · 30yr
- Down + closing
- —
- Monthly P&I
- —
- Monthly cashflow
- —
- DSCR
- —
- Eligible?
- —
Personal DTI + credit; lowest rate.
DSCR
20% down · 8.5% · 30yr
- Down + closing
- —
- Monthly P&I
- —
- Monthly cashflow
- —
- DSCR
- —
- Eligible?
- —
No personal income docs; deal must DSCR.
Hard money
10% down · 12.0% · 12mo
- Down + closing
- —
- Monthly P&I
- —
- Monthly cashflow
- —
- DSCR
- —
- Eligible?
- —
Short-term bridge; refi at stabilization.
Listing history 4 events
-
2026-04-07status Pending
-
2026-04-05$148,500 Active
-
2015-04-14soldstatus $45,000 159-char remark
Show marketing remark (159 chars)
Ranch house with a private setting. Needs a little TLC. Den/office could be 3rd bedroom. Freddie Mac first look initiative for owner occupant through 1/17/2015
-
2014-12-27$49,900 159-char remark
Show marketing remark (159 chars)
Ranch house with a private setting. Needs a little TLC. Den/office could be 3rd bedroom. Freddie Mac first look initiative for owner occupant through 1/17/2015
ⓘ Source: listings_history table (triggers on properties + properties_extension) + one-shot
backfill from property_details.listing_events for pre-trigger history.
Tax reassessment forecast NY · Partial reset (capped growth)
- Current annual tax
- $3,396 · $283/mo
- Projected year-2 tax
- $3,396 · $283/mo
- Expected delta
- $0/yr ($0/mo · 0.0%)
ⓘ Screening estimate from a state-policy table — verify with the county assessor before closing.
Climate risk First Street
- Flood 10/10 Extreme FEMA zone A · 99% chance over 30 yrs
- Wildfire 3/10 Moderate
- Heat 2/10 Low 7 d/yr ≥92°F today · 16 d/yr by 30 yrs out
- Wind 1/10 Low
- Air quality 1/10 Low 0 unhealthy d/yr today · 0 by 30 yrs out
Nearby sold comps map
Loading sold comps map…
Walkable amenities ~0.75 mi
Loading nearby amenities…
Taxation est. · year 1
- Rental income
- $17,331
- − Mortgage interest
- −$8,318
- − Property taxes
- −$3,396
- − Insurance
- −$4,508
- − Repairs & maintenance
- −$1,386
- − Management
- −$1,386
- − Depreciation
- −$4,320
- Taxable loss
- −$5,984
- Est. tax savings @ 24.0%
- +$1,436
- After-tax cash flow
- $-2,121/yr
For passive investors: Depreciation is non-cash, so a rental often shows a tax loss while cash-flowing — sheltering income. Rental losses are passive: they offset passive income freely, and up to $25,000/yr can offset ordinary (W-2) income if you actively participate and your MAGI is under $100k (phasing out to $0 by $150k); unused losses carry forward. On sale, claimed depreciation is recaptured at up to 25%, and gains may owe capital-gains tax (a 1031 exchange can defer both). Figures are a year-1 estimate at your 24.0% rate — not tax advice; consult a CPA.
Schools (NCES district)
- District
- Corning City School District
- NCES district ID
- 3608400
- Math proficiency
- 44% ▼ -12.00%
- Reading proficiency
- 53% ▲ 4.00%
- Median HH income
- $53,042
- Composite
- 41.8/100
- National rank
- #3392
- State rank
- #406 of 590 in NY
Livability — Corning
- Score
- 87/100
- State rank
- #14
- US rank
- #334
Category grades
Schools grade is shown separately in the Schools card above.
Census & demographics
- County
- Steuben County · 41,193 people
- City population
- 19,015
- Metro
- Corning, NY
- Population (ZIP)
- 19,015
- Household income
- $73,263
- Rent vs Own
- Severe rent burden
- 565.0
Population outlook (Steuben County) Hauer SSP2
- Today (2025)
- 93,062 people
- By 2030
- 89,793 · -3.5%
- By 2040
- 82,353 · -11.5%
- By 2050
- 74,286 · -20.2%
- By 2075
- 55,589 · -40.3%
- By 2100
- 37,587 · -59.6%
Race, ethnicity, and origin ACS 2023
- Neighborhood character
- Predominantly White (91%)
- Race & ethnicity
- White 91% Two or more races 3% Black 3% Hispanic / Latino 3% Asian 2%
- Common ancestry
- Romanian 4% Slovak 3% Lithuanian 2%
- Foreign-born
- 5% · Canada, China
- Languages at home
- 95% English-only · Russian/Polish/Slavic 1% Spanish 1% Other Asian/Pacific 1%
Political lean MEDSL · Steuben
- 2024 margin
- Solid R (+31.8) · D 34.1% · R 65.9%
- 2008→2024 swing
- -15.0pp toward R · 2008: -16.8pp · 2024: -31.8pp
- All cycles
- 2024: R+31.8 2020: R+29.6 2016: R+36.2 2012: R+16.4 2008: R+16.8
Not yet ingested
- Civics
- —
Market trends
- HPI YoY
- ▼ -94.59%
- Current HPI
- 173.9857
- Rent YoY
- —
- Metro
- Corning, NY
- State GDP YoY
- ▲ 2.60%
- F500 in state
- 92
Industry mix (Fortune 500 HQ in NY)
| Industry | F500 HQs | Revenue |
|---|---|---|
| Financial Services | 10 | $950B |
|
||
| Consumer Goods | 9 | $162B |
|
||
| Insurance | 4 | $225B |
|
||
| Telecommunications | 2 | $144B |
|
||
| Pharmaceuticals | 2 | $112B |
|
||
| Media / Entertainment | 2 | $69B |
|
||
Price history
+197.6% since first listed4 events — show timeline
- 2026-04-07 Pending — UNYREIS
- 2026-04-05 Listed $148,500 UNYREIS
- 2015-04-14 Sold (MLS) $45,000 UNYREIS
- 2014-12-27 Listed $49,900 UNYREIS
Property tax history
+1.7%/yrLatest (2025): $3,396 · +4.9% YoY. Source: county tax records.
Cash-flow waterfall
monthlySold comps — $/sqft
last 12 mo · ≤1 miLoading sold comps…