881 N Lake St #69 · Hemet, CA
Flood risk 1/10 · Minimal
- FEMA flood zone
- X (unshaded)
- Chance of flooding over 30 yrs
- 0.0%
- Est. flood insurance / yr
- $507 – $1,088
Fire risk 7/10 · Major
- Est. fire insurance / yr
- $659 – $1,223
Heat risk 7/10 · Major
- Hot days now (above 103°F)
- 5 days/yr
- Hot days in 30 yrs
- 14 days/yr
Wind risk 1/10 · Minimal
- Chance of severe wind over 30 yrs
- —
Air-quality risk 6/10 · Moderate
- Unhealthy air days now
- 11 days/yr
- Unhealthy air days in 30 yrs
- 13 days/yr
Risk factors via First Street. Map © Google.
Why this score? — see what drove the B grade
The composite is a weighted blend of 9 inputs, each scored 0–100. Each bar is that input's sub-score; the figure is the points it added to the 100-point composite (weight × sub-score).
- Cash flow +30.0/30.0
- ARV discount +12.4/15.0
- 1% rule +10.0/10.0
- DSCR +10.0/10.0
- Condition / age +3.8/5.0
- Rent growth +3.7/5.0
- Livability +2.6/5.0
- Schools +2.5/10.0
- Appreciation +0.0/10.0
$76,200
🖨 Deal sheet 📄 Offer letter ✓ Due diligence
Listing remarks
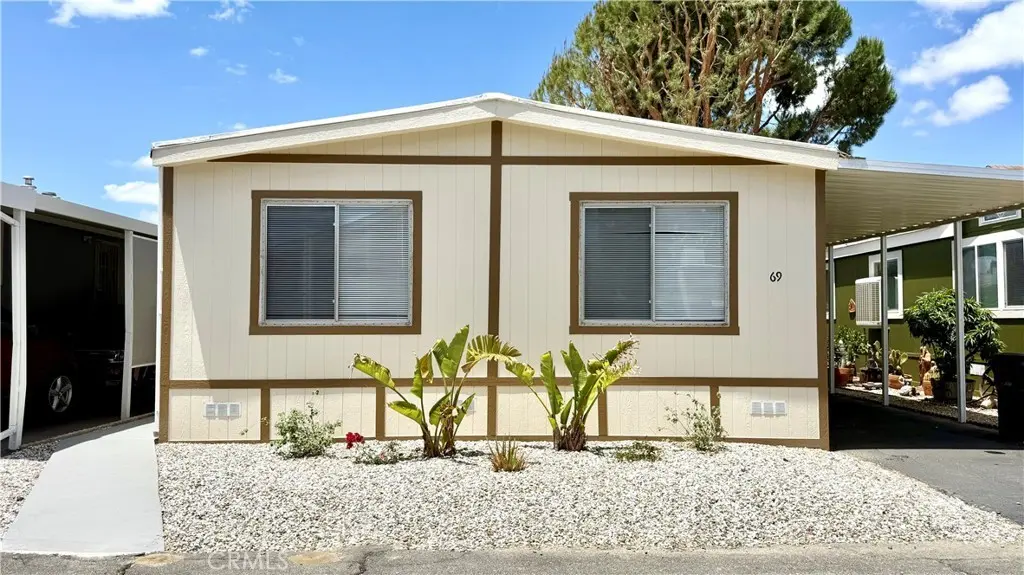
Welcome to Casa Del Rey Park, a desirable 55+ gated community offering comfort, convenience, and an active lifestyle. This turnkey 2-bedroom, 2-bath home is move-in ready and features fresh interior paint, new carpeting, and new appliances. Enjoy the peace and privacy of this secure community while being conveniently located near Highway 74, shopping, dining, and everyday amenities. Residents have access to outstanding amenities, including two clubhouses, swimming pools, an enclosed jacuzzi, fitness center, billiards room, library, TV room, conference room, and barbecue area. Don't miss this opportunity to enjoy affordable, low-maintenance living in one of the area's most welcoming senior c
Key facts
- Gated community
- New carpeting
- Swimming pools
Tags
Property features AI
Finance
- Other: Lot described as 0-1 Unit/Acre; Elevation measured in feet
- Financial info: Land lease of $700 monthly (seller provided)
- HOA & community: Senior community; Park name: Casa Del Rey; Manager approval required; Pets: contact manager
Exterior
- Parking: Located in Casa Del Rey park
- Utilities: Public sewer; District/Public water
- Home design: Mobile home (Whittier model); Double-wide body; Single story
- Construction: Mobile home remains on lot; Mobile dimensions approximately 24 ft wide by 44 ft long
- Exterior features: Community pool; Sidewalks
Interior
- Bedrooms: Entry level: 1
- Flooring: Vinyl flooring
- Bathrooms: 2 full bathrooms with bathtub and shower
- Interior features: One-level home with entry on the left side; Community spa
- Laundry & utility: Community laundry
Neighborhood map
What this means for you Summary
Snapshot
- This is a 2-bed/2.0-bath manufactured listed at $76k. Condition is rated good.
Deal economics
- At list price, monthly cash flow is $888 ($11k/yr) — positive.
- The deal already cash-flows at list — no discount required.
- Meets the 1% rule at list price ($2k rent vs $76k).
- Recommended offer: $75k (1.5% below list) — sets the bar for market timing.
- Cap rate 20.3% vs local median 4.9% in Hemet — top-decile yield for the area; either an underpriced asset or a hidden risk that comps aren't pricing in. Stress-test before assuming the spread holds.
Location & tenants
- Location reads 51/100 on livability (#1,056 in CA) — a working-class tenant base; expect higher turnover. Strengths: housing A+; Watch: crime D+, schools F, amenities F.
- Hemet Unified (suburban): math 19% / reading 41% proficiency, ranked #360 of 517 in CA (top 70%) — families likely to look elsewhere, expect single-tenant / working-renter base with shorter leases; 66% free/reduced lunch — lower-income household profile, screen leases tightly.
- Market conditions: Rents rising fast (+4.9%/yr); 323 active listings in the ZIP; 19 comparable units currently listed for rent nearby; rentals at typical pace (median 25d on market — plan ~3-4 weeks tenant-placement turnaround); 42% of comp listings sitting > 30 days — soft ceiling on asking rent; 9,195 units permitted in Riverside County in 2024 (1,512 in 5+ unit buildings).
Forward outlook
- Local home prices are declining (-3.0%/yr); year-one equity from $527 of loan paydown is wiped out by about $2k of value loss. Plan a longer hold.
- Riverside County population projected at +22% by 2050 — long-run rental-demand tailwind backs the buy-and-hold thesis.
- At projected returns (-3.0% appreciation + 4.9% rent growth), your $21k cash investment doubles in ~3 years — after that, you're playing with house money.
Negotiation context
- It's been on market 15 days — a 2% lower offer ($75k) is reasonable based on typical stale-listing flexibility.
Risks & watch-outs
- Climate carrying-cost: major wildfire risk; extreme-heat days projected 5→14/yr by 2055 (HVAC capex compounding) — expect insurance premiums to compound above CPI over the hold.
Questions for the listing agent
- Built in 1978 — when were the roof, HVAC, electrical panel, plumbing, and water heater last replaced?
- Is there a deadline driving the sale (1031 exchange, divorce, estate, relocation)? That informs how much negotiation room exists.
- Schools are F-rated, which usually means shorter tenancies and higher turnover. Who's the typical renter profile here, and what's been the actual vacancy rate?
- Crime grade is D in this area — have there been break-ins, vandalism, or insurance claims at this property in the last 3 years? What carrier currently insures it and at what premium?
- What's the average days-on-market for RENTAL listings here right now (not sales)? A rising rental-DOM trend means longer vacancies and softer asking-rent achievability than the comps imply.
- What's the recent tenant-quality profile in this submarket — average credit score on applications, eviction rate, late-payment / NSF rate, and stable-employment percentage? A property-management company in the area should have these aggregated.
- How much new for-sale + rental construction is in the pipeline within 1–3 miles? Heavy new supply typically softens prices + rents 12–24 months out; constrained supply supports both.
Investment metrics
- 1% rule
- 2.35% ✓
- Cap rate
- 20.27%
- Cash-on-cash
- 49.93%
- DSCR
- 3.22
- GRM
- 3.5
CMA / ARV
- ARV (on-the-fly)
- $85,536
- Comps found
- 7
Show comp detail 7 sales within ~0.75 mi
| Address | Dist | Beds/Ba | Sqft | Sold | Price | $/sf | Match |
|---|---|---|---|---|---|---|---|
| 881 N Lake St #357 | 0.00mi | 2/1.0 | 1,100 (+4%) | 0mo | $45,999 | $42 | 89 |
| 880 N Lake St #82 | 0.20mi | 3/2.0 (+1) | 1,000 (-5%) | 4mo | $83,500 | $84 | 73 |
| 881 Lake Street Space 253 | 0.08mi | 2/2.0 | 1,200 (+14%) | 2mo | $80,000 | $67 | 72 |
| 881 N Lake St #332 | 0.10mi | 2/2.0 | 1,000 (-5%) | 19mo | $78,000 | $78 | 71 |
| 880 N Lake St #75 | 0.20mi | 3/2.0 (+1) | 1,104 (+4%) | 21mo | $136,500 | $124 | 61 |
| 880 N LAKE St #111 | 0.20mi | 3/2.0 (+1) | 1,188 (+12%) | 10mo | $112,000 | $94 | 56 |
| 24600 Mountain Ave #136 | 0.26mi | 3/2.0 (+1) | 1,152 (+9%) | 14mo | $93,500 | $81 | 56 |
Match score weights: distance 35% · size 25% · config 20% · recency 20%. Top-matched comps best support the ARV.
Projected returns pro-forma
-3.0% appreciation · 4.9% rent growth · sell at horizon
- IRR
- 49.8%
- Equity multiple
- 3.24×
- Total profit
- $47,713
- Equity at exit
- $11,362
- IRR
- 56.1%
- Equity multiple
- 7.06×
- Total profit
- $129,348
- Equity at exit
- $6,588
Cash invested: $21,336 (down + closing). Projections, not guarantees.
Landlord ↔ Tenant lean methodology
- Overall (STATE)
- 18 Strongly Tenant-Friendly
- State California
- 18 Strongly Tenant-Friendly · D+13
- County
- — inherits STATE
- City
- — inherits STATE
ZIP-level market 92544
- Rents YoY
- 4.9%
- Active inventory
- 323
- Price-to-rent
- 3.5×
Monthly cashflow live
- Estimated rent
- $1,790 high interval (Pro) →
- Mortgage (P&I)
- −$400
- Tax est. 1.5%
- −$95 /mo · $1,143/yr
- Insurance
- −$32
- HOA
- −$0
- Vacancy / Maint / Mgmt
- −$376
- Net cashflow
- $888
Break-even live
UW: 25.0% down · 7.5% · 30yr · 1.5% tax · 5.0% vac · 8.0% maint · 8.0% mgmt
Financing live
Cash to close
- Down payment
- $19,050
- Closing costs
- $2,286
- Reserves months
- —
- Total cash needed
- —
Loan-product check · same deal, 3 products live
Conventional
25% down · 7.5% · 30yr
- Down + closing
- —
- Monthly P&I
- —
- Monthly cashflow
- —
- DSCR
- —
- Eligible?
- —
Personal DTI + credit; lowest rate.
DSCR
20% down · 8.5% · 30yr
- Down + closing
- —
- Monthly P&I
- —
- Monthly cashflow
- —
- DSCR
- —
- Eligible?
- —
No personal income docs; deal must DSCR.
Hard money
10% down · 12.0% · 12mo
- Down + closing
- —
- Monthly P&I
- —
- Monthly cashflow
- —
- DSCR
- —
- Eligible?
- —
Short-term bridge; refi at stabilization.
Rent comps 19 comps
| Address | Beds | Baths | Sqft | Rent | $/sqft | DOM | Units | Dist |
|---|---|---|---|---|---|---|---|---|
| 1939 Hooper Dr San Jacinto, CA | 2.0 | 2.0 | 1111 | $1,950 | $1.76 | 24d | 1 | 0.77mi |
| 43170 Wall St Hemet, CA | 2.0 | 2.0 | 1140 | $1,895 | $1.66 | 3d | 1 | 0.78mi |
| 43435 Nola St Hemet, CA | 3.0 | 2.0 | 1500 | $1,950 | $1.30 | 24d | 1 | 0.79mi |
| 25564 Sharp Dr Unit F Hemet, CA | 1.0 | 1.0 | 832 | $1,475 | $1.77 | 44d | 1 | 0.81mi |
| 43611 Florida Ave Unit 10 Hemet, CA | 2.0 | 2.0 | 850 | $1,550 | $1.82 | 44d | 1 | 1.19mi |
| 43601 California 74 Unit 17 Hemet, CA | 2.0 | 2.0 | 840 | $1,400 | $1.67 | 24d | 1 | 1.29mi |
| 43601 E Florida Ave #98 Hemet, CA | 2.0 | 2.0 | 840 | $1,400 | $1.67 | 24d | 1 | 1.30mi |
| 43601 E Florida Ave Hemet, CA | 2.0 | 2.0 | 960 | $1,550 | $1.61 | 44d | 1 | 1.30mi |
| 43601 E Florida Ave Unit 43 Hemet, CA | 2.0 | 2.0 | 960 | $1,500 | $1.56 | 44d | 1 | 1.30mi |
| 43601 E Florida Ave #98 Hemet, CA | 2.0 | 2.0 | 800 | $1,400 | $1.75 | 44d | 1 | 1.30mi |
| 43601 E Florida Ave Unit 43 Hemet, CA | 2.0 | 2.0 | 960 | $1,450 | $1.51 | 24d | 1 | 1.30mi |
| 41900 Acacia Ave Hemet, CA | 2.0 | 1.0 | 850 | $1,800 | $2.12 | 44d | 1 | 1.31mi |
| 43816 C St Hemet, CA | 2.0 | 2.0 | 1040 | $2,250 | $2.16 | 24d | 1 | 1.34mi |
| 26123 Anawood Pl Hemet, CA | 2.0 | 1.0 | 991 | $1,680 | $1.70 | 44d | 1 | 1.36mi |
| 26097 Doverwood Pl Hemet, CA | 2.0 | 1.0 | 1019 | $1,849 | $1.81 | 44d | 1 | 1.39mi |
| 26111 Doverwood Pl Hemet, CA | 2.0 | 1.0 | 1252 | $1,849 | $1.48 | 12d | 1 | 1.40mi |
| 41818 Acacia East Ave Hemet, CA | 2.0 | 1.0 | 1000 | $1,850 | $1.85 | 15d | 1 | 1.41mi |
| 41611 Marine Dr Hemet, CA | 2.0 | 1.0 | 1050 | $1,700 | $1.62 | 12d | 1 | 1.46mi |
| 41541 Marine Dr Hemet, CA | 2.0 | 1.0 | 1000 | $1,700 | $1.70 | 12d | 1 | 1.50mi |
Listing history 10 events
-
2026-06-18days on market $76,200 Active 15 DOM
-
2026-06-17days on market $76,200 Active 14 DOM
-
2026-06-16days on market $76,200 Active 13 DOM
-
2026-06-15days on market $76,200 Active 12 DOM
-
2026-06-13days on market $76,200 Active 10 DOM
-
2026-06-09days on market $76,200 Active 6 DOM
-
2026-06-08days on market $76,200 Active 5 DOM
-
2026-06-07days on market $76,200 Active 4 DOM
-
2026-06-04remarks 699-char remark
-
2026-06-04$76,200 Active 1 DOM
ⓘ Source: listings_history table (triggers on properties + properties_extension) + one-shot
backfill from property_details.listing_events for pre-trigger history.
Climate risk First Street
- Flood 1/10 Low FEMA zone X (unshaded) · 0% chance over 30 yrs
- Wildfire 7/10 Severe
- Heat 7/10 Severe 5 d/yr ≥103°F today · 14 d/yr by 30 yrs out
- Wind 1/10 Low
- Air quality 6/10 Major 11 unhealthy d/yr today · 13 by 30 yrs out
Nearby sold comps map
Loading sold comps map…
Walkable amenities ~0.75 mi
Loading nearby amenities…
Taxation est. · year 1
- Rental income
- $21,485
- − Mortgage interest
- −$4,268
- − Property taxes
- −$1,143
- − Insurance
- −$381
- − Repairs & maintenance
- −$1,719
- − Management
- −$1,719
- − Depreciation
- −$2,217
- Taxable income
- $10,038
- Est. tax owed @ 24.0%
- −$2,409
- After-tax cash flow
- $8,245/yr
For passive investors: Depreciation is non-cash, so a rental often shows a tax loss while cash-flowing — sheltering income. Rental losses are passive: they offset passive income freely, and up to $25,000/yr can offset ordinary (W-2) income if you actively participate and your MAGI is under $100k (phasing out to $0 by $150k); unused losses carry forward. On sale, claimed depreciation is recaptured at up to 25%, and gains may owe capital-gains tax (a 1031 exchange can defer both). Figures are a year-1 estimate at your 24.0% rate — not tax advice; consult a CPA.
Condition & rehab AI · 13 photos
This manufactured home is in good condition with minimal repairs needed. It is move-in ready and has a good curb appeal. Painting the exterior siding and replacing the HVAC system would significantly increase its resale and rental value.
Value-add opportunities
- Resale Paint the exterior siding — Painting the exterior siding can enhance the home's curb appeal and make it more attractive to potential buyers.
- Rental Replace the HVAC system — A new HVAC system can improve the comfort and energy efficiency of the home, making it more appealing to renters.
Renovation cost estimate screening
Value-add ROI direction
- Resale Paint the exterior siding — Painting the exterior siding can enhance the home's curb appeal and make it more attractive to potential buyers. ↑
- Rental Replace the HVAC system — A new HVAC system can improve the comfort and energy efficiency of the home, making it more appealing to renters. ↑
ⓘ Cost ranges are severity-bucket heuristics (US national rule-of-thumb). Get contractor quotes + a written scope before underwriting a rehab budget.
Schools (NCES district)
- District
- Hemet Unified
- NCES district ID
- 0616920
- Math proficiency
- 19% ▼ -3.00%
- Reading proficiency
- 41% ▲ 4.00%
- Median HH income
- $39,962
- Composite
- 25.16/100
- National rank
- #7517
- State rank
- #360 of 517 in CA
Livability — Hemet
- Score
- 51/100
- State rank
- #1056
- US rank
- #25208
Category grades
Schools grade is shown separately in the Schools card above.
Census & demographics
- Census place
- Hemet, CA
- County
- Riverside County · 2,287,001 people
- City population
- 137,670
- Metro
- Riverside-San Bernardino-Ontario, CA
- Population (ZIP)
- 51,751
- Household income
- $73,596
- Rent vs Own
- Severe rent burden
- 1518.0
Population outlook (Riverside County) Hauer SSP2
- Today (2025)
- 2,664,475 people
- By 2030
- 2,802,692 · +5.2%
- By 2040
- 3,050,904 · +14.5%
- By 2050
- 3,256,783 · +22.2%
- By 2075
- 3,655,058 · +37.2%
- By 2100
- 3,766,594 · +41.4%
Race, ethnicity, and origin ACS 2023
- Neighborhood character
- Diverse neighborhood (Simpson 0.59)
- Race & ethnicity
- Hispanic / Latino 49% White 40% Two or more races 18% Black 5% Asian 3% Native American 2%
- Hispanic origin (detail)
- Mexican 43% Puerto Rican 1%
- Common ancestry
- Slovak 2% Italian 2% Portuguese 2%
- Foreign-born
- 15% · Canada, China
- Languages at home
- 70% English-only · Spanish 27% Other Asian/Pacific 1% Other Indo-European 1%
Political lean MEDSL · Riverside
- 2024 margin
- Toss-up / Even · D 48.0% · R 49.3% · Other 2.6%
- 2008→2024 swing
- -3.6pp toward R · 2008: 2.3pp · 2024: -1.3pp
- All cycles
- 2024: R+1.3 2020: D+8.0 2016: D+4.3 2012: R+0.4 2008: D+2.3
Not yet ingested
- Civics
- —
Market trends
- HPI YoY
- ▼ -219.06%
- Current HPI
- 391.972
- Rent YoY
- ▲ 4.90%
- Metro
- Riverside-San Bernardino-Ontario, CA
- State GDP YoY
- ▲ 3.21%
- F500 in state
- 116
Industry mix (Fortune 500 HQ in CA)
| Industry | F500 HQs | Revenue |
|---|---|---|
| Technology | 27 | $1,492B |
|
||
| Financial Services | 3 | $174B |
|
||
| Retail | 3 | $44B |
|
||
| Insurance | 3 | $26B |
|
||
| Media / Entertainment | 2 | $115B |
|
||
| Pharmaceuticals / Biotech | 2 | $62B |
|
||
Price history
1 event — show timeline
- 2026-06-03 Listed $76,200 CRMLS
Cash-flow waterfall
monthlySold comps — $/sqft
last 12 mo · ≤1 miLoading sold comps…