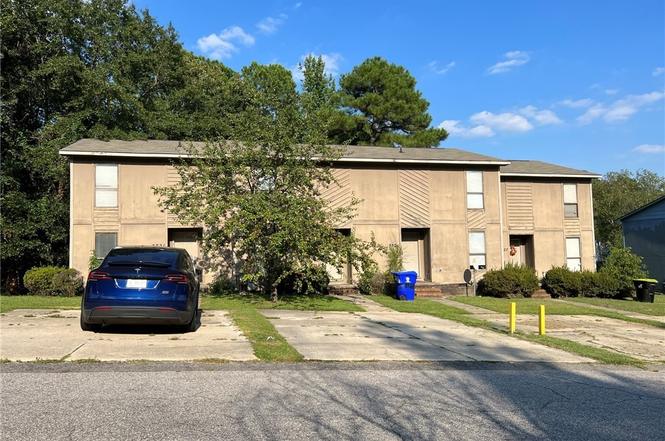
5725 Aftonshire Dr · Fayetteville, NC
Flood risk 1/10 · Minimal
- FEMA flood zone
- X (unshaded)
- Chance of flooding over 30 yrs
- 0.0%
- Est. flood insurance / yr
- $507 – $1,088
Fire risk 4/10 · Minor
- Est. fire insurance / yr
- $906 – $1,684
Heat risk 7/10 · Major
- Hot days now (above 107°F)
- 7 days/yr
- Hot days in 30 yrs
- 16 days/yr
Wind risk 6/10 · Moderate
- Chance of severe wind over 30 yrs
- 72.0%
Air-quality risk 1/10 · Minimal
- Unhealthy air days now
- 0 days/yr
- Unhealthy air days in 30 yrs
- 0 days/yr
Risk factors via First Street. Map © Google.
Why this score? — see what drove the D grade
The composite is a weighted blend of 9 inputs, each scored 0–100. Each bar is that input's sub-score; the figure is the points it added to the 100-point composite (weight × sub-score).
- Cash flow +14.9/30.0
- ARV discount +7.5/15.0
- DSCR +4.6/10.0
- Livability +3.8/5.0
- 1% rule +3.6/10.0
- Rent growth +3.3/5.0
- Schools +3.1/10.0
- Condition / age +2.5/5.0
- Appreciation +0.0/10.0
$135,000
🖨 Deal sheet (PDF) 📄 Offer letter ✓ Due diligence
Listing remarks
Investor Special in Established Fayetteville Location! This two-story townhome offers strong potential with interior updates already completed, including refreshed kitchen cabinetry, modern lighting, updated flooring, and neutral paint throughout. Spacious living area with breakfast bar and rear deck access. Generously sized bedrooms with ample natural light. Exterior repairs are needed, including siding, trim, soffits, and deck improvements. Property is priced accordingly and is being sold as-is. Excellent opportunity for investors or buyers looking to add value through exterior renovation. Conveniently located near shopping, dining, schools, and Fort Liberty. Great value-add opportunity w
Key facts
- Updated flooring
- Neutral paint
- Rear deck access
Tags
Property features AI
Finance
- Other: Located in the CreekS Edge subdivision
- HOA & community: Homeowners association with a $35 monthly fee
Exterior
- Parking: No garage
- Security: Smoke detectors
- Utilities: Public water; Public sewer
- Home design: Townhouse; Residential single-family residence; Cedar construction
- Construction: Cedar exterior
- Exterior features: Deck
Interior
- Kitchen: Refrigerator; Range
- Bedrooms: 4 total rooms (bedroom count not specified separately)
- Flooring: Carpet; Vinyl
- Bathrooms: 2 full bathrooms; 1 half bathroom
- Heating & cooling: Heat pump heating; Central air conditioning; Ceiling fans
- Interior features: Ceiling fans
Neighborhood map
What this means for you Summary
Snapshot
- This is a 2-bed/3.0-bath other listed at $135k.
Deal economics
- At list price, monthly cash flow is $40 ($476/yr) — positive.
- The deal already cash-flows at list — no discount required.
- To meet the 1% rule (rent ≥ 1% of price), the offer needs to be $116k (13.9% below list).
- Recommended offer: $116k (13.9% below list) — sets the bar for 1% rule.
- Cap rate 6.6% vs local median 4.8% in Fayetteville — top-decile yield for the area; either an underpriced asset or a hidden risk that comps aren't pricing in. Stress-test before assuming the spread holds.
Location & tenants
- Location reads 75/100 on livability (#45 in NC, #4,031 nationally) — a middle-class / working-renter tenant base. Strengths: commute A+, cost of living A+, housing A+; Watch: crime F, employment D-.
- Cumberland County Schools (urban): math 32% / reading 41% proficiency, ranked #126 of 178 in NC (top 71%) — families likely to look elsewhere, expect single-tenant / working-renter base with shorter leases.
- Zoned schools: Brentwood Elementary (math 22% / reading 27%, grade F, #1,112 of 1,410 statewide, top 82%, 498 students, 99% FRL); Lewis Chapel Middle (math 15% / reading 27%, grade F, #424 of 475 statewide, top 90%, 578 students, 100% FRL); Seventy-First High (math 45% / reading 44%, grade F, #352 of 535 statewide, top 68%, 1,366 students, 70% FRL) — zoned schools average 90% FRL vs 55% district-wide (35 pts higher); higher-poverty schools than district average — tighter screening recommended.
- Market conditions: Rents rising (+3.2%/yr); 308 active listings in the ZIP; 40 comparable units currently listed for rent nearby; rentals at typical pace (median 25d on market — plan ~3-4 weeks tenant-placement turnaround); 1,125 units permitted in Cumberland County in 2024 (104 in 5+ unit buildings).
Forward outlook
- Local home prices are declining (-3.0%/yr); year-one equity from $933 of loan paydown is wiped out by about $4k of value loss. Plan a longer hold.
Negotiation context
- It's been on market 118 days — a 9% lower offer ($123k) is reasonable based on typical stale-listing flexibility.
- 5 sale attempts since 2y ago with the ask held roughly flat each time — persistent listings suggest the price (not the market) is what's stuck; bring a comps-based counter.
Risks & watch-outs
- Climate carrying-cost: major wind risk, 72% chance of damaging wind over 30y; extreme-heat days projected 7→16/yr by 2055 (HVAC capex compounding) — expect insurance premiums to compound above CPI over the hold.
Questions for the listing agent
- It's been on market 118 days. Have you received any prior offers? Is the seller open to a 14% concession, seller financing, or rate buy-down credit?
- What does the HOA fee cover, when was the last increase, and are there any pending special assessments or reserve-fund shortfalls?
- Why hasn't it sold? Are there any deal-killer items the seller is aware of (foundation, flood, title, zoning, code violations)?
- Is there a deadline driving the sale (1031 exchange, divorce, estate, relocation)? That informs how much negotiation room exists.
- Crime grade is F in this area — have there been break-ins, vandalism, or insurance claims at this property in the last 3 years? What carrier currently insures it and at what premium?
- The area grade is low — what's the realistic commute time and amenity access for the typical tenant pool here? Any planned neighborhood developments (good or bad) we should know about?
- What's the average days-on-market for RENTAL listings here right now (not sales)? A rising rental-DOM trend means longer vacancies and softer asking-rent achievability than the comps imply.
- What's the recent tenant-quality profile in this submarket — average credit score on applications, eviction rate, late-payment / NSF rate, and stable-employment percentage? A property-management company in the area should have these aggregated.
- How much new for-sale + rental construction is in the pipeline within 1–3 miles? Heavy new supply typically softens prices + rents 12–24 months out; constrained supply supports both.
Investment metrics
- 1% rule
- 0.86% ✗
- Cap rate
- 6.65%
- Cash-on-cash
- 1.26%
- DSCR
- 1.06
- GRM
- 9.7
CMA / ARV
No comps found within radius.
Projected returns pro-forma
-3.0% appreciation · 3.17% rent growth · sell at horizon
- IRR
- -14.1%
- Equity multiple
- 0.49×
- Total profit
- $-19,166
- Equity at exit
- $20,129
- IRR
- -5.1%
- Equity multiple
- 0.66×
- Total profit
- $-12,681
- Equity at exit
- $11,672
Cash invested: $37,800 (down + closing). Projections, not guarantees.
Landlord ↔ Tenant lean methodology
- Overall (STATE)
- 85 Strongly Landlord-Friendly
- State North Carolina
- 85 Strongly Landlord-Friendly · R+3
- County
- — inherits STATE
- City
- — inherits STATE
ZIP-level market 28304
- Home prices YoY
- -21.7%
- Rents YoY
- 3.2%
- Active inventory
- 308
- Price-to-rent
- 9.7×
Monthly cashflow live
- Estimated rent
- $1,163 high interval (Pro) →
- Mortgage (P&I)
- −$708
- Tax from tax record
- −$80 /mo · $954/yr
- Insurance
- −$56
- HOA
- −$35
- Vacancy / Maint / Mgmt
- −$244
- Net cashflow
- $40
Break-even live
Sensitivity live
| Price | -10% $116 | -5% $78 | +0% $40 | +5% $1 | +10% $-37 |
|---|---|---|---|---|---|
| Rent | -10% $-52 | -5% $-6 | +0% $40 | +5% $86 | +10% $131 |
| Rate | -1.0pp $108 | -0.5pp $74 | base $40 | +0.5pp $5 | +1.0pp $-31 |
UW: 25.0% down · 7.5% · 30yr · 1.5% tax · 5.0% vac · 8.0% maint · 8.0% mgmt
Financing live
Cash to close
- Down payment
- $33,750
- Closing costs
- $4,050
- Reserves months
- —
- Total cash needed
- —
Loan-product check · same deal, 3 products live
Conventional
25% down · 7.5% · 30yr
- Down + closing
- —
- Monthly P&I
- —
- Monthly cashflow
- —
- DSCR
- —
- Eligible?
- —
Personal DTI + credit; lowest rate.
DSCR
20% down · 8.5% · 30yr
- Down + closing
- —
- Monthly P&I
- —
- Monthly cashflow
- —
- DSCR
- —
- Eligible?
- —
No personal income docs; deal must DSCR.
Hard money
10% down · 12.0% · 12mo
- Down + closing
- —
- Monthly P&I
- —
- Monthly cashflow
- —
- DSCR
- —
- Eligible?
- —
Short-term bridge; refi at stabilization.
Rent comps 40 comps
| Address | Beds | Baths | Sqft | Rent | $/sqft | DOM | Units | Dist |
|---|---|---|---|---|---|---|---|---|
| 1406 Tangora Ln Fayetteville, NC | 2.0 | 2.5 | 1192 | $1,015 | $0.85 | 25d | 1 | 0.02mi |
| 1413 Tangora Ln Fayetteville, NC | 2.0 | 1.5 | 945 | $979 | $1.04 | 15d | 1 | 0.03mi |
| 5713 Aftonshire Dr Fayetteville, NC | 2.0 | 2.5 | 1025 | $995 | $0.97 | 15d | 1 | 0.03mi |
| 5876 Aftonshire Dr Fayetteville, NC | 2.0 | 1.5 | 1024 | $1,015 | $0.99 | 25d | 1 | 0.07mi |
| 5864 Aftonshire Dr Fayetteville, NC | 2.0 | 2.0 | 1100 | $1,100 | $1.00 | 25d | 1 | 0.07mi |
| 5744 Aftonshire Dr Fayetteville, NC | 2.0 | 1.5 | 945 | $999 | $1.06 | 25d | 1 | 0.08mi |
| 5842 Aftonshire Dr Fayetteville, NC | 2.0 | 1.5 | 1010 | $1,000 | $0.99 | 25d | 1 | 0.08mi |
| 1216 Weeping Willow Way Unit 229 Fayetteville, NC | 3.0 | 2.0 | 960 | $969 | $1.01 | 15d | 1 | 0.11mi |
| 1401 Carnsmore Dr Fayetteville, NC | 3.0 | 2.5 | 1450 | $1,575 | $1.09 | 25d | 1 | 0.21mi |
| 1070 Rulnick St Fayetteville, NC | 3.0 | 1.0 | 1014 | $1,200 | $1.18 | 25d | 1 | 0.52mi |
| 1053 Rulnick St Unit C Fayetteville, NC | 1.0 | 1.0 | 795 | $800 | $1.01 | 25d | 1 | 0.52mi |
| 1051 Rulnick St Unit D Fayetteville, NC | 1.0 | 1.0 | 795 | $800 | $1.01 | 23d | 1 | 0.54mi |
| 909 Sandalwood Dr Fayetteville, NC | 3.0 | 1.0 | 1346 | $1,595 | $1.18 | 25d | 1 | 0.65mi |
| 5200 Cypress Rd Fayetteville, NC | 3.0 | 1.0 | 1210 | $1,250 | $1.03 | 25d | 1 | 0.66mi |
| 821 Sandalwood Dr Fayetteville, NC | 3.0 | 1.0 | 1204 | $1,200 | $1.00 | 15d | 1 | 0.68mi |
| 6320 Marykirk Dr Unit C Fayetteville, NC | 1.0 | 1.0 | 710 | $875 | $1.23 | 25d | 1 | 0.68mi |
| 5632 Birch Rd Fayetteville, NC | 3.0 | 1.0 | 1228 | $1,250 | $1.02 | 25d | 1 | 0.69mi |
| 6324 Marykirk Dr Unit A Fayetteville, NC | 2.0 | 1.5 | 792 | $900 | $1.14 | 25d | 1 | 0.71mi |
| 6324 Marykirk Dr Unit B Fayetteville, NC | 1.0 | 1.0 | 792 | $875 | $1.10 | 25d | 1 | 0.71mi |
| 3001 Stone Carriage Cir Fayetteville, NC | 1.0–3.0 | 1.0–2.0 | 1098 | $1,448 | $1.32 | 15d | 12 | 0.73mi |
| 1437 Artesian Ct Fayetteville, NC | 2.0 | 1.5 | 850 | $1,000 | $1.18 | 15d | 1 | 0.76mi |
| 6332 Marykirk Dr Unit A Fayetteville, NC | 2.0 | 1.5 | 925 | $1,150 | $1.24 | 25d | 1 | 0.76mi |
| 1715 Arrow Ridge Way Fayetteville, NC | 3.0 | 2.0 | 1220 | $1,550 | $1.27 | 15d | 1 | 0.77mi |
| 6333 Marykirk Dr Unit A Fayetteville, NC | 2.0 | 1.5 | 1080 | $1,075 | $1.00 | 25d | 1 | 0.78mi |
| 1508 Darvel Ave Fayetteville, NC | 3.0 | 2.0 | 1269 | $1,700 | $1.34 | 25d | 1 | 0.81mi |
| 4809 Belford Rd Fayetteville, NC | 3.0 | 1.5 | 1459 | $1,300 | $0.89 | 25d | 1 | 0.89mi |
| 4935 Walnut Dr Fayetteville, NC | 3.0 | 1.5 | 1024 | $1,200 | $1.17 | 15d | 1 | 0.92mi |
| 6340 Ginger Cir Fayetteville, NC | 3.0 | 1.5 | 1052 | $1,400 | $1.33 | 25d | 1 | 1.02mi |
| 5744 Randleman St Fayetteville, NC | 3.0 | 2.0 | 1171 | $1,395 | $1.19 | 25d | 1 | 1.03mi |
| 5721 Randleman St Fayetteville, NC | 3.0 | 2.0 | 1050 | $1,575 | $1.50 | 25d | 1 | 1.03mi |
| 4909 Walnut Dr Fayetteville, NC | 3.0 | 2.0 | 1188 | $1,500 | $1.26 | 25d | 1 | 1.04mi |
| 6408 Dunham Dr Fayetteville, NC | 3.0 | 2.0 | 1400 | $1,500 | $1.07 | 15d | 1 | 1.04mi |
| 6400 Starbrook Dr #1 Fayetteville, NC | 2.0 | 2.0 | 860 | $1,000 | $1.16 | 25d | 1 | 1.05mi |
| 6408 Starbrook Dr #5 Fayetteville, NC | 2.0 | 2.0 | 860 | $995 | $1.16 | 25d | 1 | 1.08mi |
| 6338 Rhemish Dr Fayetteville, NC | 3.0 | 2.0 | 1201 | $1,500 | $1.25 | 25d | 1 | 1.08mi |
| 1701 Carter Baron Pl Unit 211 Fayetteville, NC | 3.0 | 2.0 | 1295 | $1,700 | $1.31 | 25d | 1 | 1.10mi |
| 6132 Dandy Loop Rd Fayetteville, NC | 3.0 | 1.0 | 1456 | $1,325 | $0.91 | 25d | 1 | 1.12mi |
| 855 King Arthur Dr Fayetteville, NC | 1.0–2.0 | 1.0–2.0 | 810 | $1,182 | $1.46 | 15d | 9 | 1.15mi |
| 613 Ashbrook Ct Fayetteville, NC | 3.0 | 1.5 | 1103 | $1,299 | $1.18 | 25d | 1 | 1.15mi |
| 1222 Southwood Dr Fayetteville, NC | 2.0 | 1.5 | 801 | $875 | $1.09 | 25d | 1 | 1.16mi |
HOA detail
- Monthly dues
- $35 · $420/yr
- Likely covers
- exterior maint.
Listing history 29 events
-
2026-06-21days on market $135,000 Active 118 DOM
-
2026-06-18days on market $135,000 Active 115 DOM
-
2026-06-17days on market $135,000 Active 114 DOM
-
2026-06-16days on market $135,000 Active 113 DOM
-
2026-06-15days on market $135,000 Active 112 DOM
-
2026-06-14days on market $135,000 Active 110 DOM
-
2026-06-13days on market $135,000 Active 109 DOM
-
2026-06-10days on market $135,000 Active 107 DOM
-
2026-06-09days on market $135,000 Active 106 DOM
-
2026-06-08days on market $135,000 Active 105 DOM
-
2026-06-07days on market $135,000 Active 104 DOM
-
2026-06-03days on market $135,000 Active 100 DOM
-
2026-06-02days on market $135,000 Active 99 DOM
-
2026-06-01days on market $135,000 Active 98 DOM
-
2026-05-31days on market $135,000 Active 97 DOM
-
2026-05-30days on market $135,000 Active 96 DOM
-
2026-04-30historical $800
-
2026-04-08price $800
-
2026-02-23$135,000 Active
-
2026-01-23price $895
-
2025-11-06$995
-
2025-11-06historical $995
-
2025-10-29$995
-
2024-08-28historical $875
-
2024-08-24$875
-
2024-08-24historical $875
-
2024-07-18$875
-
2021-10-21soldstatus $218,000
-
2005-08-11soldstatus $45,000
ⓘ Source: listings_history table (triggers on properties + properties_extension) + one-shot
backfill from property_details.listing_events for pre-trigger history.
Tax reassessment forecast NC · Resets to sale price
- Current annual tax
- $954 · $80/mo
- Projected year-2 tax
- $1,107 · $92/mo
- Expected delta
- +$153/yr (+$13/mo · 16.0%)
ⓘ Screening estimate from a state-policy table — verify with the county assessor before closing.
Climate risk First Street
- Flood 1/10 Low FEMA zone X (unshaded) · 0% chance over 30 yrs
- Wildfire 4/10 Moderate
- Heat 7/10 Severe 7 d/yr ≥107°F today · 16 d/yr by 30 yrs out
- Wind 6/10 Major 72% chance of damaging wind over 30 yrs
- Air quality 1/10 Low 0 unhealthy d/yr today · 0 by 30 yrs out
Nearby sold comps map
Loading sold comps map…
Walkable amenities ~0.75 mi
Loading nearby amenities…
Taxation est. · year 1
- Rental income
- $13,950
- − Mortgage interest
- −$7,562
- − Property taxes
- −$954
- − Insurance
- −$675
- − Repairs & maintenance
- −$1,116
- − Management
- −$1,116
- − HOA
- −$420
- − Depreciation
- −$3,927
- Taxable loss
- −$1,820
- Est. tax savings @ 24.0%
- +$437
- After-tax cash flow
- $913/yr
For passive investors: Depreciation is non-cash, so a rental often shows a tax loss while cash-flowing — sheltering income. Rental losses are passive: they offset passive income freely, and up to $25,000/yr can offset ordinary (W-2) income if you actively participate and your MAGI is under $100k (phasing out to $0 by $150k); unused losses carry forward. On sale, claimed depreciation is recaptured at up to 25%, and gains may owe capital-gains tax (a 1031 exchange can defer both). Figures are a year-1 estimate at your 24.0% rate — not tax advice; consult a CPA.
Schools (NCES district)
- District
- Cumberland County Schools
- NCES district ID
- 3700011
- Math proficiency
- 32% ▼ -2.00%
- Reading proficiency
- 41% ▼ -1.00%
- Median HH income
- $44,168
- Composite
- 31.0/100
- National rank
- #6096
- State rank
- #126 of 178 in NC
Livability — Fayetteville
- Score
- 75/100
- State rank
- #45
- US rank
- #4031
Category grades
Schools grade is shown separately in the Schools card above.
Census & demographics
- Census place
- Fayetteville, NC
- County
- Cumberland County · 265,314 people
- City population
- 226,118
- Metro
- Fayetteville, NC
- Population (ZIP)
- 37,140
- Household income
- $58,563
- Rent vs Own
- Severe rent burden
- 1667.0
Population outlook (Cumberland County) Hauer SSP2
- Today (2025)
- 330,855 people
- By 2030
- 333,523 · +0.8%
- By 2040
- 335,583 · +1.4%
- By 2050
- 335,325 · +1.4%
- By 2075
- 342,853 · +3.6%
- By 2100
- 340,698 · +3.0%
Race, ethnicity, and origin ACS 2023
- Neighborhood character
- Highly diverse neighborhood (Simpson 0.70)
- Race & ethnicity
- Black 39% White 36% Hispanic / Latino 14% Two or more races 12% Asian 3% Native American 1%
- Hispanic origin (detail)
- Mexican 5% Puerto Rican 5%
- Common ancestry
- Slovak 2% Italian 1% Serbian 1%
- Foreign-born
- 8% · Canada, South Korea, Vietnam
- Languages at home
- 87% English-only · Spanish 9% Tagalog/Filipino 1% French/Haitian/Cajun 1%
Political lean MEDSL · Cumberland
- 2024 margin
- D (+13.4) · D 56.1% · R 42.7% · Other 1.2%
- 2008→2024 swing
- -4.3pp toward R · 2008: 17.7pp · 2024: 13.4pp
- All cycles
- 2024: D+13.4 2020: D+16.6 2016: D+16.0 2012: D+19.7 2008: D+17.7
Not yet ingested
- Civics
- —
Market trends
- HPI YoY
- ▼ -59.90%
- Current HPI
- 215.927
- Rent YoY
- ▲ 3.17%
- Metro
- Fayetteville, NC
- State GDP YoY
- ▲ 3.28%
- F500 in state
- 26
Industry mix (Fortune 500 HQ in NC)
| Industry | F500 HQs | Revenue |
|---|---|---|
| Financial Services | 2 | $213B |
|
||
| Retail | 2 | $95B |
|
||
| Industrial Conglomerate | 1 | $38B |
|
||
| Metals / Steel | 1 | $35B |
|
||
| Utilities | 1 | $30B |
|
||
| Industrial Machinery | 1 | $19B |
|
||
Price history
+200.0% since first listed13 events — show timeline
- 2026-04-30 Rental Removed $800 LPRMLS
- 2026-04-08 Price Changed $800 LPRMLS
- 2026-02-23 Listed $135,000 LPRMLS
- 2026-01-23 Price Changed $895 LPRMLS
- 2025-11-06 Listed for Rent $995 LPRMLS
- 2025-11-06 Rental Removed $995 TMLS
- 2025-10-29 Listed for Rent $995 TMLS
- 2024-08-28 Rental Removed $875 RENTLY
- 2024-08-24 Listed for Rent $875 RENTLY
- 2024-08-24 Rental Removed $875 RENTLY
- 2024-07-18 Listed for Rent $875 RENTLY
- 2021-10-21 Sold (Public Records) $218,000 Public Records
- 2005-08-11 Sold (Public Records) $45,000 Public Records
Property tax history
+5.2%/yrLatest (2025): $954 · -8.6% YoY. Source: county tax records.
Cash-flow waterfall
monthlySold comps — $/sqft
last 12 mo · ≤1 miLoading sold comps…