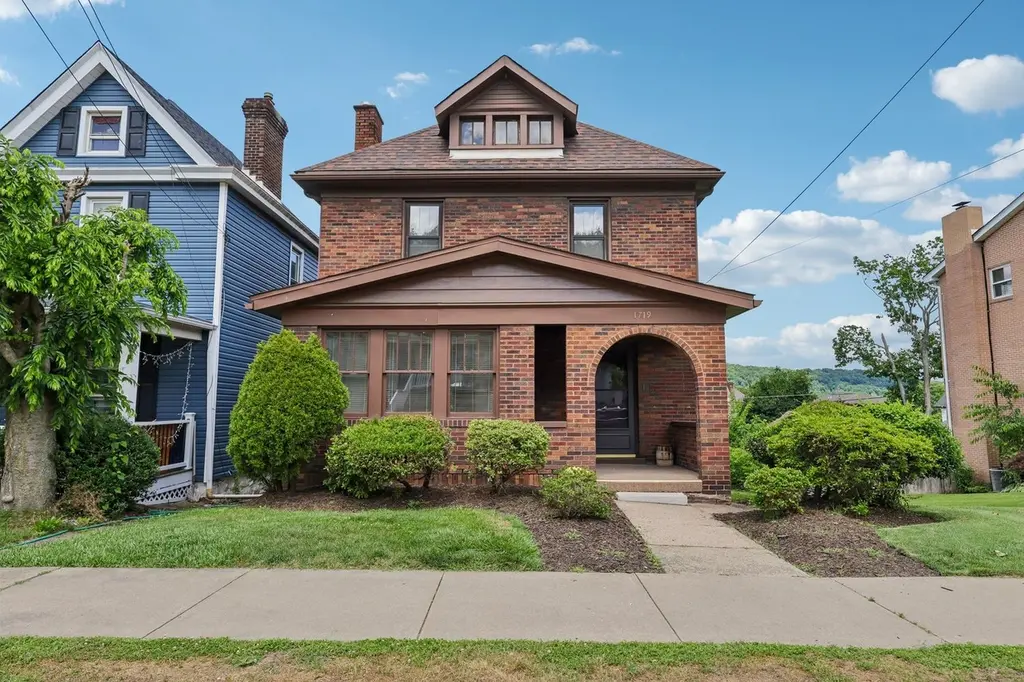
1719 Vance Ave · Coraopolis, PA
Flood risk 1/10 · Minimal
- FEMA flood zone
- X (unshaded)
- Chance of flooding over 30 yrs
- 0.0%
- Est. flood insurance / yr
- $473 – $860
Fire risk 1/10 · Minimal
- Est. fire insurance / yr
- $511 – $949
Heat risk 4/10 · Minor
- Hot days now (above 97°F)
- 7 days/yr
- Hot days in 30 yrs
- 19 days/yr
Wind risk 2/10 · Minimal
- Chance of severe wind over 30 yrs
- —
Air-quality risk 3/10 · Minor
- Unhealthy air days now
- 2 days/yr
- Unhealthy air days in 30 yrs
- 3 days/yr
Risk factors via First Street. Map © Google.
Why this score? — see what drove the D- grade
The composite is a weighted blend of 9 inputs, each scored 0–100. Each bar is that input's sub-score; the figure is the points it added to the 100-point composite (weight × sub-score).
- Cash flow +10.1/30.0
- ARV discount +8.6/15.0
- Livability +4.0/5.0
- Rent growth +3.5/5.0
- 1% rule +3.4/10.0
- DSCR +2.9/10.0
- Condition / age +2.5/5.0
- Schools +2.3/10.0
- Appreciation +0.0/10.0
$199,900
🖨 Deal sheet 📄 Offer letter ✓ Due diligence
Listing remarks
First time on the market in nearly 50 years, this lovingly maintained brick home sits on a desirable double lot and is full of the character and craftsmanship that simply aren't found in newer construction. The covered front porch welcomes you into a tiled entry and a warm, inviting living room anchored by a fireplace with tile surround and flanked by beautiful built-in cabinetry. An adjacent sunroom bathes in natural light providing the perfect spot for morning coffee or curling up with a good book. Entertain with ease in the spacious dining room, then make your way into the kitchen, which offers an abundance of wood cabinetry, a dedicated pantry cabinet, and a convenient desk area. The ad
Key facts
- Covered front porch
- Tiled entry
- Living room
Tags
Property features AI
Exterior
- Parking: On-street parking
- Utilities: Public water; Public sewer
- Home design: 3-story brick home; Resale property; Asphalt roof
- Construction: Brick construction
- Exterior features: Lot dimensions approx. 55 x 147 x 56 x 147
Interior
- Kitchen: Kitchen on main level (approx. 19x11); Stove; Refrigerator; Dishwasher; Disposal
- Bedrooms: Upper-level bedrooms (three listed) including rooms approx. 15x12, 12x10, and 15x12; Additional upper bedroom approx. 12x11; Lower-level game room approx. 20x18; Main-level bonus room approx. 11x8
- Flooring: Hardwood; Tile; Carpet
- Bathrooms: Two full bathrooms; One half bathroom
- Heating & cooling: Gas hot water heating; Central air conditioning
- Interior features: Partially finished walk-out basement; Fireplace (1)
- Laundry & utility: Washer; Dryer; Some gas appliances
Neighborhood map
What this means for you Summary
Snapshot
- This is a 3-bed/2.5-bath single-family listed at $200k.
Deal economics
- At list price, monthly cash flow is $-117 ($-1k/yr) — negative.
- To cash-flow at today's rent, offer at most $179k (10.4% below list).
- To meet the 1% rule (rent ≥ 1% of price), the offer needs to be $169k (15.7% below list).
- Recommended offer: $169k (15.7% below list) — sets the bar for 1% rule.
Location & tenants
- Location reads 80/100 on livability (#193 in PA, #1,621 nationally) — a professional / high-income tenant draw. Strengths: cost of living A+, housing A+, amenities B+.
- Cornell SD (suburban): math 16% / reading 39% proficiency, ranked #461 of 539 in PA (top 86%) — low school quality limits family demand, transient renter base, plan for 1-2y turnover; 66% free/reduced lunch — lower-income household profile, screen leases tightly.
- Market conditions: Rents rising fast (+4.1%/yr); 177 active listings in the ZIP; 5 comparable units currently listed for rent nearby; rentals at typical pace (median 17d on market — plan ~3-4 weeks tenant-placement turnaround); solid renter incomes; 2,996 units permitted in Allegheny County in 2024 (1,588 in 5+ unit buildings).
Forward outlook
- Local home prices are declining (-3.0%/yr); year-one equity from $1k of loan paydown is wiped out by about $6k of value loss. Plan a longer hold.
Negotiation context
- Only 1 days on market — expect competitive offers; lowballing is unlikely to land.
- Current owner paid $33k; list at $200k implies a 506% gain — meaningful room to come down on a strong offer.
Risks & watch-outs
- Watch-outs: built in 1925 — expect roof / HVAC / electrical / plumbing capex.
Questions for the listing agent
- What do current leases actually rent for vs. the listed asking? Can we see a recent rent roll and the last 12 months of T-12 income?
- Built in 1925 — when were the roof, HVAC, electrical panel, plumbing, and water heater last replaced?
- Is there a deadline driving the sale (1031 exchange, divorce, estate, relocation)? That informs how much negotiation room exists.
- The area grade is low — what's the realistic commute time and amenity access for the typical tenant pool here? Any planned neighborhood developments (good or bad) we should know about?
- What's the average days-on-market for RENTAL listings here right now (not sales)? A rising rental-DOM trend means longer vacancies and softer asking-rent achievability than the comps imply.
- What's the recent tenant-quality profile in this submarket — average credit score on applications, eviction rate, late-payment / NSF rate, and stable-employment percentage? A property-management company in the area should have these aggregated.
- How much new for-sale + rental construction is in the pipeline within 1–3 miles? Heavy new supply typically softens prices + rents 12–24 months out; constrained supply supports both.
Investment metrics
- 1% rule
- 0.84% ✗
- Cap rate
- 5.59%
- Cash-on-cash
- -2.52%
- DSCR
- 0.89
- GRM
- 9.9
CMA / ARV
- ARV (on-the-fly)
- $204,905
- Comps found
- 11
Show comp detail 11 sales within ~0.75 mi
| Address | Dist | Beds/Ba | Sqft | Sold | Price | $/sf | Match |
|---|---|---|---|---|---|---|---|
| 726 George | 0.06mi | 3/1.5 | 1,984 (+4%) | 9mo | $275,000 | $139 | 80 |
| 1702 Vance Ave | 0.05mi | 4/2.0 (+1) | 1,857 (-3%) | 14mo | $265,000 | $143 | 74 |
| 1520 4th Ave | 0.25mi | 4/2.0 (+1) | 1,972 (+3%) | 4mo | $295,000 | $150 | 73 |
| 1525 State Ave | 0.19mi | 3/1.0 | 2,076 (+8%) | 0mo | $223,600 | $108 | 71 |
| 718 George St | 0.06mi | 4/1.5 (+1) | 1,825 (-5%) | 18mo | $155,000 | $85 | 65 |
| 1312 Hiland Ave | 0.43mi | 3/2.0 | 2,018 (+5%) | 6mo | $216,500 | $107 | 64 |
| 1324 Hiland Ave | 0.40mi | 3/2.0 | 1,694 (-12%) | 8mo | $225,900 | $133 | 54 |
| 1050 Rose Ave | 0.69mi | 3/2.5 | 2,040 (+6%) | 10mo | $215,000 | $105 | 48 |
| 1050 Vance Ave | 0.67mi | 3/1.5 | 1,755 (-8%) | 5mo | $112,000 | $64 | 47 |
| 1223 4th Ave | 0.52mi | 4/2.0 (+1) | 2,093 (+9%) | 15mo | $95,000 | $45 | 40 |
| 705 Maple St | 0.37mi | 4/1.0 (+1) | 1,664 (-13%) | 24mo | $157,500 | $95 | 30 |
Match score weights: distance 35% · size 25% · config 20% · recency 20%. Top-matched comps best support the ARV.
Projected returns pro-forma
-3.0% appreciation · 4.13% rent growth · sell at horizon
- IRR
- -19.1%
- Equity multiple
- 0.32×
- Total profit
- $-37,864
- Equity at exit
- $29,806
- IRR
- -9.4%
- Equity multiple
- 0.39×
- Total profit
- $-34,191
- Equity at exit
- $17,284
Cash invested: $55,972 (down + closing). Projections, not guarantees.
Landlord ↔ Tenant lean methodology
- Overall (STATE)
- 62 Landlord-Friendly
- State Pennsylvania
- 62 Landlord-Friendly · EVEN
- County
- — inherits STATE
- City
- — inherits STATE
ZIP-level market 15108
- Rents YoY
- 4.1%
- Active inventory
- 177
- Price-to-rent
- 9.9×
Monthly cashflow live
- Estimated rent
- $1,685 high interval (Pro) →
- Mortgage (P&I)
- −$1,048
- Tax from tax record
- −$317 /mo · $3,806/yr
- Insurance
- −$83
- HOA
- −$0
- Vacancy / Maint / Mgmt
- −$354
- Net cashflow
- $-117
Break-even live
UW: 25.0% down · 7.5% · 30yr · 1.5% tax · 5.0% vac · 8.0% maint · 8.0% mgmt
Financing live
Cash to close
- Down payment
- $49,975
- Closing costs
- $5,997
- Reserves months
- —
- Total cash needed
- —
Loan-product check · same deal, 3 products live
Conventional
25% down · 7.5% · 30yr
- Down + closing
- —
- Monthly P&I
- —
- Monthly cashflow
- —
- DSCR
- —
- Eligible?
- —
Personal DTI + credit; lowest rate.
DSCR
20% down · 8.5% · 30yr
- Down + closing
- —
- Monthly P&I
- —
- Monthly cashflow
- —
- DSCR
- —
- Eligible?
- —
No personal income docs; deal must DSCR.
Hard money
10% down · 12.0% · 12mo
- Down + closing
- —
- Monthly P&I
- —
- Monthly cashflow
- —
- DSCR
- —
- Eligible?
- —
Short-term bridge; refi at stabilization.
Rent comps 5 comps
| Address | Beds | Baths | Sqft | Rent | $/sqft | DOM | Units | Dist |
|---|---|---|---|---|---|---|---|---|
| 1704 State Ave Coraopolis, PA | 3.0 | 2.0 | 1456 | $1,500 | $1.03 | 7d | 1 | 0.12mi |
| 1865 Montour St Coraopolis, PA | 3.0 | 1.5 | 1360 | $1,499 | $1.10 | 23d | 1 | 0.37mi |
| 1865 Montour St Coraopolis, PA | 3.0 | 1.5 | 1360 | $1,499 | $1.10 | 43d | 1 | 0.37mi |
| 105 Broadway St Coraopolis, PA | 3.0 | 1.5 | 1672 | $1,799 | $1.08 | 7d | 1 | 0.62mi |
| 1669 Charlton Heights Rd Coraopolis, PA | 3.0 | 2.5 | 1738 | $2,500 | $1.44 | 17d | 1 | 1.19mi |
Listing history 2 events
-
2026-06-18remarks 699-char remark
-
2026-06-18$199,900 Active 1 DOM
ⓘ Source: listings_history table (triggers on properties + properties_extension) + one-shot
backfill from property_details.listing_events for pre-trigger history.
Tax reassessment forecast PA · Partial reset (capped growth)
- Current annual tax
- $3,806 · $317/mo
- Projected year-2 tax
- $3,806 · $317/mo
- Expected delta
- $0/yr ($0/mo · 0.0%)
ⓘ Screening estimate from a state-policy table — verify with the county assessor before closing.
Climate risk First Street
- Flood 1/10 Low FEMA zone X (unshaded) · 0% chance over 30 yrs
- Wildfire 1/10 Low
- Heat 4/10 Moderate 7 d/yr ≥97°F today · 19 d/yr by 30 yrs out
- Wind 2/10 Low
- Air quality 3/10 Moderate 2 unhealthy d/yr today · 3 by 30 yrs out
Nearby sold comps map
Loading sold comps map…
Walkable amenities ~0.75 mi
Loading nearby amenities…
Taxation est. · year 1
- Rental income
- $20,224
- − Mortgage interest
- −$11,198
- − Property taxes
- −$3,806
- − Insurance
- −$1,000
- − Repairs & maintenance
- −$1,618
- − Management
- −$1,618
- − Depreciation
- −$5,815
- Taxable loss
- −$4,831
- Est. tax savings @ 24.0%
- +$1,159
- After-tax cash flow
- $-249/yr
For passive investors: Depreciation is non-cash, so a rental often shows a tax loss while cash-flowing — sheltering income. Rental losses are passive: they offset passive income freely, and up to $25,000/yr can offset ordinary (W-2) income if you actively participate and your MAGI is under $100k (phasing out to $0 by $150k); unused losses carry forward. On sale, claimed depreciation is recaptured at up to 25%, and gains may owe capital-gains tax (a 1031 exchange can defer both). Figures are a year-1 estimate at your 24.0% rate — not tax advice; consult a CPA.
Schools (NCES district)
- District
- Cornell SD
- NCES district ID
- 4206810
- Math proficiency
- 16% ▼ -10.00%
- Reading proficiency
- 39% ▼ -8.00%
- Median HH income
- $36,558
- Composite
- 22.75/100
- National rank
- #8032
- State rank
- #461 of 539 in PA
Livability — Coraopolis
- Score
- 80/100
- State rank
- #193
- US rank
- #1621
Category grades
Schools grade is shown separately in the Schools card above.
Census & demographics
- Census place
- Coraopolis, PA
- County
- Allegheny County · 1,022,028 people
- City population
- 42,799
- Metro
- Pittsburgh, PA
- Population (ZIP)
- 42,799
- Household income
- $100,859
- Rent vs Own
- Severe rent burden
- 890.0
Population outlook (Allegheny County) Hauer SSP2
- Today (2025)
- 1,250,282 people
- By 2030
- 1,256,482 · +0.5%
- By 2040
- 1,256,318 · +0.5%
- By 2050
- 1,244,169 · -0.5%
- By 2075
- 1,197,693 · -4.2%
- By 2100
- 1,093,187 · -12.6%
Race, ethnicity, and origin ACS 2023
- Neighborhood character
- Predominantly White (85%)
- Race & ethnicity
- White 85% Black 5% Two or more races 5% Asian 4% Hispanic / Latino 2%
- Common ancestry
- Romanian 7% Subsaharan African 4% Slovak 2%
- Foreign-born
- 6% · Canada, Vietnam
- Languages at home
- 93% English-only · Spanish 2% Other Indo-European 1% Other Asian/Pacific 1%
Political lean MEDSL · Allegheny
- 2024 margin
- Strong D (+20.3) · D 59.7% · R 39.4%
- 2008→2024 swing
- +4.8pp toward D · 2008: 15.5pp · 2024: 20.3pp
- All cycles
- 2024: D+20.3 2020: D+20.4 2016: D+16.4 2012: D+14.4 2008: D+15.5
Not yet ingested
- Civics
- —
Market trends
- HPI YoY
- ▼ -220.09%
- Current HPI
- 250.7623
- Rent YoY
- ▲ 4.13%
- Metro
- Pittsburgh, PA
- State GDP YoY
- ▲ 1.68%
- F500 in state
- 34
Industry mix (Fortune 500 HQ in PA)
| Industry | F500 HQs | Revenue |
|---|---|---|
| Healthcare | 2 | $309B |
|
||
| Insurance | 2 | $27B |
|
||
| Telecommunications / Media | 1 | $124B |
|
||
| Industrial Distribution | 1 | $22B |
|
||
| Financial Services | 1 | $20B |
|
||
| Chemicals / Materials | 1 | $18B |
|
||
Price history
+505.8% since first listed2 events — show timeline
- 2026-06-17 Listed $199,900 West Penn MLS
- 1976-07-08 Sold (Public Records) $33,000 Public Records
Property tax history
+0.8%/yrLatest (2026): $3,806 · +2.8% YoY. Source: county tax records.
Cash-flow waterfall
monthlySold comps — $/sqft
last 12 mo · ≤1 miLoading sold comps…