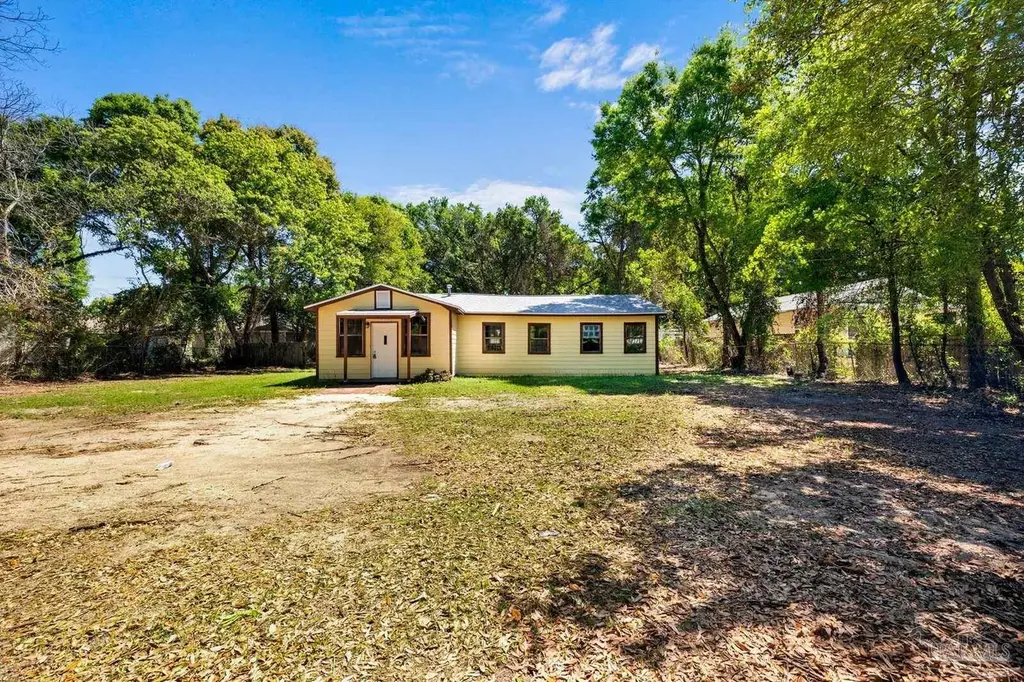
2403 E Johnson Ave · Ferry Pass, FL
Flood risk 4/10 · Minor
- FEMA flood zone
- X (unshaded)
- Chance of flooding over 30 yrs
- 0.2%
- Est. flood insurance / yr
- $507 – $1,088
Fire risk 1/10 · Minimal
- Est. fire insurance / yr
- $947 – $1,759
Heat risk 10/10 · Severe
- Hot days now (above 106°F)
- 7 days/yr
- Hot days in 30 yrs
- 22 days/yr
Wind risk 9/10 · Severe
- Chance of severe wind over 30 yrs
- 99.0%
Air-quality risk 1/10 · Minimal
- Unhealthy air days now
- 0 days/yr
- Unhealthy air days in 30 yrs
- 0 days/yr
Risk factors via First Street. Map © Google.
Why this score? — see what drove the B- grade
The composite is a weighted blend of 9 inputs, each scored 0–100. Each bar is that input's sub-score; the figure is the points it added to the 100-point composite (weight × sub-score).
- Cash flow +26.9/30.0
- ARV discount +15.0/15.0
- DSCR +9.3/10.0
- 1% rule +6.3/10.0
- Schools +3.6/10.0
- Livability +3.2/5.0
- Rent growth +2.7/5.0
- Condition / age +2.5/5.0
- Appreciation +0.0/10.0
$170,000
🖨 Deal sheet 📄 Offer letter ✓ Due diligence
Listing remarks MLS
Great opportunity for first-time homebuyers or investors! - Space, location, and incredible potential! This property is tucked away in the heart of Pensacola, offering both convenience and a sense of tranquility. This spacious 4-bedroom, 1-bath home sits on a generous 0.51-acre lot, ideally located just minutes from restaurants, malls, shopping centers, and grocery stores, with easy access to the interstate. Inside, the home features tile flooring throughout the main living areas, including a large living room and an oversized dining area. All four bedrooms are generously sized, providing comfort and flexibility. The kitchen offers abundant cabinet space, perfect for storage and organization. Recent updates include a roof that is only 4 years old and an HVAC system that is just 2 years old, adding value and peace of mind. Step outside to the expansive backyard with endless potential—ideal for entertaining, adding a firepit, or creating your own private retreat - plenty space to park your RV or your boat. Don’t miss this opportunity schedule your private showing today !
Key facts
- Generous lot
- Tile flooring
- Expansive backyard
Tags
Neighborhood map
What this means for you Summary
Snapshot
- This is a 4-bed/1.0-bath single-family listed at $170k.
Deal economics
- At list price, monthly cash flow is $469 ($6k/yr) — positive.
- The deal already cash-flows at list — no discount required.
- Meets the 1% rule at list price ($2k rent vs $170k).
- Recommended offer: $160k (6.0% below list) — sets the bar for market timing.
- Cap rate 9.6% vs local median 4.4% in Ferry Pass — top-decile yield for the area; either an underpriced asset or a hidden risk that comps aren't pricing in. Stress-test before assuming the spread holds.
Location & tenants
- Location reads 65/100 on livability (#664 in FL) — a middle-class / working-renter tenant base. Strengths: cost of living A+, housing A+; Watch: employment C-, schools D, amenities F.
- Escambia (suburban): math 40% / reading 45% proficiency, ranked #56 of 73 in FL (top 77%) — families likely to look elsewhere, expect single-tenant / working-renter base with shorter leases.
- Market conditions: Rents flat; 221 active listings in the ZIP; 24 comparable units currently listed for rent nearby; rentals at typical pace (median 21d on market — plan ~3-4 weeks tenant-placement turnaround); 1,479 units permitted in Escambia County in 2024 (0 in 5+ unit buildings).
- This rent runs 35% of the median local income ($67k/yr) — at the standard rent-burdened threshold; future hikes will face affordability resistance.
Forward outlook
- Local home prices are declining (-3.0%/yr); year-one equity from $1k of loan paydown is wiped out by about $5k of value loss. Plan a longer hold.
- Escambia County population projected at +13% by 2050 — modest demand growth; plan on rents tracking national, not racing it.
Negotiation context
- It's been on market 63 days — a 6% lower offer ($160k) is reasonable based on typical stale-listing flexibility.
- Current owner paid $41k; list at $170k implies a 312% gain — meaningful room to come down on a strong offer.
Risks & watch-outs
- Watch-outs: built in 1958 — expect roof / HVAC / electrical / plumbing capex.
- Climate carrying-cost: severe wind risk, 99% chance of damaging wind over 30y; extreme-heat days projected 7→22/yr by 2055 (HVAC capex compounding) — expect insurance premiums to compound above CPI over the hold.
Questions for the listing agent
- It's been on market 63 days. Have you received any prior offers? Is the seller open to a 6% concession, seller financing, or rate buy-down credit?
- Built in 1958 — when were the roof, HVAC, electrical panel, plumbing, and water heater last replaced?
- Why hasn't it sold? Are there any deal-killer items the seller is aware of (foundation, flood, title, zoning, code violations)?
- Is there a deadline driving the sale (1031 exchange, divorce, estate, relocation)? That informs how much negotiation room exists.
- Schools are D-rated, which usually means shorter tenancies and higher turnover. Who's the typical renter profile here, and what's been the actual vacancy rate?
- What's the average days-on-market for RENTAL listings here right now (not sales)? A rising rental-DOM trend means longer vacancies and softer asking-rent achievability than the comps imply.
- What's the recent tenant-quality profile in this submarket — average credit score on applications, eviction rate, late-payment / NSF rate, and stable-employment percentage? A property-management company in the area should have these aggregated.
- How much new for-sale + rental construction is in the pipeline within 1–3 miles? Heavy new supply typically softens prices + rents 12–24 months out; constrained supply supports both.
Investment metrics
- 1% rule
- 1.13% ✓
- Cap rate
- 9.60%
- Cash-on-cash
- 11.83%
- DSCR
- 1.53
- GRM
- 7.4
CMA / ARV
- ARV (median comp)
- $290,457
- List price
- $170,000
- Delta
- -41.47%
- Verdict
- UNDERPRICED
- Comps
- 20 within 1.0 mi
Show comp detail 12 sales within ~0.75 mi
| Address | Dist | Beds/Ba | Sqft | Sold | Price | $/sf | Match |
|---|---|---|---|---|---|---|---|
| 2776 Honeywood Dr | 0.44mi | 3/2.0 (-1) | 1,383 (+0%) | 1mo | $257,900 | $186 | 69 |
| 8106 Binkley St | 0.36mi | 5/2.0 (+1) | 1,404 (+2%) | 6mo | $222,500 | $158 | 66 |
| 8196 Lode Star Ave | 0.74mi | 3/2.0 (-1) | 1,363 (-1%) | 6mo | $203,933 | $150 | 50 |
| 7775 Marlow St | 0.72mi | 4/2.0 | 1,300 (-6%) | 5mo | $193,000 | $148 | 49 |
| 2969 Skycrest Dr | 0.62mi | 3/2.0 (-1) | 1,488 (+8%) | 4mo | $222,000 | $149 | 46 |
| 174 Mirabelle Cir | 0.70mi | 3/2.0 (-1) | 1,307 (-5%) | 5mo | $247,300 | $189 | 46 |
| 369 Mirabelle Dr | 0.71mi | 3/2.0 (-1) | 1,274 (-8%) | 2mo | $299,900 | $235 | 43 |
| 9190 Brunson Rd | 0.67mi | 3/2.0 (-1) | 1,257 (-9%) | 5mo | $281,250 | $224 | 41 |
| 2317 Langston St | 0.73mi | 3/2.0 (-1) | 1,227 (-11%) | 2mo | $263,000 | $214 | 37 |
| 2152 Atwood Dr | 0.75mi | 3/2.0 (-1) | 1,547 (+12%) | 2mo | $220,000 | $142 | 34 |
| 139 Mirabelle Cir | 0.73mi | 3/2.0 (-1) | 1,528 (+11%) | 6mo | $284,000 | $186 | 34 |
| 182 Mirabelle Cir | 0.72mi | 3/2.0 (-1) | 1,577 (+14%) | 1mo | $272,500 | $173 | 33 |
Match score weights: distance 35% · size 25% · config 20% · recency 20%. Top-matched comps best support the ARV.
Projected returns pro-forma
-3.0% appreciation · 0.76% rent growth · sell at horizon
- IRR
- -1.1%
- Equity multiple
- 0.96×
- Total profit
- $-1,944
- Equity at exit
- $25,348
- IRR
- 6.2%
- Equity multiple
- 1.42×
- Total profit
- $19,992
- Equity at exit
- $14,698
Cash invested: $47,600 (down + closing). Projections, not guarantees.
Landlord ↔ Tenant lean methodology
- Overall (STATE)
- 87 Strongly Landlord-Friendly
- State Florida
- 87 Strongly Landlord-Friendly · R+3
- County
- — inherits STATE
- City
- — inherits STATE
ZIP-level market 32514
- Home prices YoY
- -31.2%
- Rents YoY
- 0.8%
- Active inventory
- 221
- Price-to-rent
- 7.4×
Monthly cashflow live
- Estimated rent
- $1,918 high interval (Pro) →
- Mortgage (P&I)
- −$891
- Tax from tax record
- −$84 /mo · $1,004/yr
- Insurance
- −$71
- HOA
- −$0
- Vacancy / Maint / Mgmt
- −$403
- Net cashflow
- $469
Break-even live
UW: 25.0% down · 7.5% · 30yr · 1.5% tax · 5.0% vac · 8.0% maint · 8.0% mgmt
Financing live
Cash to close
- Down payment
- $42,500
- Closing costs
- $5,100
- Reserves months
- —
- Total cash needed
- —
Loan-product check · same deal, 3 products live
Conventional
25% down · 7.5% · 30yr
- Down + closing
- —
- Monthly P&I
- —
- Monthly cashflow
- —
- DSCR
- —
- Eligible?
- —
Personal DTI + credit; lowest rate.
DSCR
20% down · 8.5% · 30yr
- Down + closing
- —
- Monthly P&I
- —
- Monthly cashflow
- —
- DSCR
- —
- Eligible?
- —
No personal income docs; deal must DSCR.
Hard money
10% down · 12.0% · 12mo
- Down + closing
- —
- Monthly P&I
- —
- Monthly cashflow
- —
- DSCR
- —
- Eligible?
- —
Short-term bridge; refi at stabilization.
Rent comps 24 comps
| Address | Beds | Baths | Sqft | Rent | $/sqft | DOM | Units | Dist |
|---|---|---|---|---|---|---|---|---|
| 8707 N Davis Hwy Pensacola, FL | 1.0–3.0 | 1.0–2.0 | 1017 | $2,475 | $2.43 | 13d | 38 | 0.42mi |
| 161 Mirabelle Cir Pensacola, FL | 3.0 | 2.0 | 1701 | $2,000 | $1.18 | 23d | 1 | 0.66mi |
| 8990 N Davis Hwy Pensacola, FL | 1.0–3.0 | 1.0–2.0 | 1019 | $1,775 | $1.74 | 13d | 20 | 0.70mi |
| 7758 Kipling St Pensacola, FL | 4.0 | 2.0 | 1652 | $1,695 | $1.03 | 13d | 1 | 0.74mi |
| 112 Mirabelle Cir Pensacola, FL | 3.0 | 2.0 | 1576 | $1,850 | $1.17 | 23d | 1 | 0.80mi |
| 1600 Governors Dr Pensacola, FL | 1.0–3.0 | 1.0–2.0 | 1010 | $1,991 | $1.97 | 13d | 25 | 0.84mi |
| 7650 Kipling St Unit 1 Pensacola, FL | 3.0 | 2.0 | 1200 | $1,300 | $1.08 | 23d | 1 | 0.91mi |
| 9165 Loomis St Pensacola, FL | 3.0 | 2.0 | 1056 | $1,400 | $1.33 | 23d | 1 | 0.92mi |
| 2220 Gloria Cir Pensacola, FL | 2.0–3.0 | 2.0 | 1123 | $1,825 | $1.63 | 13d | 1 | 0.95mi |
| 7840 Lilac Ln Pensacola, FL | 1.0–3.0 | 1.0–2.0 | 1025 | $1,904 | $1.86 | 13d | 16 | 0.97mi |
| 9307 Mabel St Pensacola, FL | 3.0 | 1.0 | 915 | $1,300 | $1.42 | 23d | 1 | 1.02mi |
| 3505 Mossy Oak Villas Cir Pensacola, FL | 3.0 | 2.5 | 1738 | $1,800 | $1.04 | 23d | 1 | 1.10mi |
| 8053 Malibu Cir Pensacola, FL | 3.0 | 2.0 | 1575 | $1,810 | $1.15 | 13d | 1 | 1.10mi |
| 9184 Arand Dr Pensacola, FL | 3.0 | 2.0 | 1348 | $1,575 | $1.17 | 21d | 1 | 1.13mi |
| 3514 Mossy Oak Villas Cir Pensacola, FL | 3.0 | 2.5 | 1738 | $2,000 | $1.15 | 23d | 1 | 1.13mi |
| 3514 Mossy Oak Villas Cir Pensacola, FL | 3.0 | 2.5 | 1738 | $2,000 | $1.15 | 13d | 1 | 1.13mi |
| 9100 Baldridge Rd Pensacola, FL | 1.0–3.0 | 1.0–2.0 | 1086 | $1,966 | $1.81 | 13d | 13 | 1.15mi |
| 7104 Cedar Grove Way Ferry Pass, FL | 3.0 | 2.5 | 1534 | $1,850 | $1.21 | 13d | 37 | 1.25mi |
| 7101 Joy St Unit I5 Pensacola, FL | 3.0 | 2.0 | 1183 | $1,950 | $1.65 | 23d | 1 | 1.26mi |
| 7074 Javelin Ct Pensacola, FL | 3.0 | 2.5 | 1543 | $1,850 | $1.20 | 13d | 30 | 1.39mi |
| 1040 E Olive Rd Pensacola, FL | 1.0–3.0 | 1.0–2.0 | 897 | $1,644 | $1.83 | 23d | 7 | 1.39mi |
| 8108 Ridgefield Rd Pensacola, FL | 3.0 | 2.0 | 1485 | $2,000 | $1.35 | 13d | 1 | 1.40mi |
| 1878 E Nine Mile Rd Pensacola, FL | 1.0–3.0 | 1.0–2.0 | 887 | $1,495 | $1.68 | 23d | 8 | 1.44mi |
| 6016 Sewell St Pensacola, FL | 3.0 | 1.5 | 1377 | $1,650 | $1.20 | 23d | 1 | 1.49mi |
Listing history 20 events
-
2026-06-18days on market $170,000 Active 63 DOM
-
2026-06-17days on market $170,000 Active 62 DOM
-
2026-06-16days on market $170,000 Active 61 DOM
-
2026-06-15days on market $170,000 Active 60 DOM
-
2026-06-14pricedays on market $170,000 Active 58 DOM
-
2026-06-10days on market $185,000 Active 55 DOM
-
2026-06-09days on market $185,000 Active 54 DOM
-
2026-06-08days on market $185,000 Active 53 DOM
-
2026-06-07pricedays on market $185,000 Active 52 DOM
-
2026-06-03days on market $189,000 Active 48 DOM
-
2026-06-02days on market $189,000 Active 47 DOM
-
2026-06-01days on market $189,000 Active 46 DOM
-
2026-05-31days on market $189,000 Active 45 DOM
-
2026-05-31days on market $189,000 Active 44 DOM
-
2026-05-05price $189,000 1100-char remark
Show marketing remark (1100 chars)
Great opportunity for first-time homebuyers or investors! - Space, location, and incredible potential! This property is tucked away in the heart of Pensacola, offering both convenience and a sense of tranquility. This spacious 4-bedroom, 1-bath home sits on a generous 0.51-acre lot, ideally located just minutes from restaurants, malls, shopping centers, and grocery stores, with easy access to the interstate. Inside, the home features tile flooring throughout the main living areas, including a large living room and an oversized dining area. All four bedrooms are generously sized, providing comfort and flexibility. The kitchen offers abundant cabinet space, perfect for storage and organization. Recent updates include a roof that is only 4 years old and an HVAC system that is just 2 years old, adding value and peace of mind. Step outside to the expansive backyard with endless potential—ideal for entertaining, adding a firepit, or creating your own private retreat - plenty space to park your RV or your boat. Don’t miss this opportunity schedule your private showing today !
-
2026-04-16$210,000 Active 1100-char remark
Show marketing remark (1100 chars)
Great opportunity for first-time homebuyers or investors! - Space, location, and incredible potential! This property is tucked away in the heart of Pensacola, offering both convenience and a sense of tranquility. This spacious 4-bedroom, 1-bath home sits on a generous 0.51-acre lot, ideally located just minutes from restaurants, malls, shopping centers, and grocery stores, with easy access to the interstate. Inside, the home features tile flooring throughout the main living areas, including a large living room and an oversized dining area. All four bedrooms are generously sized, providing comfort and flexibility. The kitchen offers abundant cabinet space, perfect for storage and organization. Recent updates include a roof that is only 4 years old and an HVAC system that is just 2 years old, adding value and peace of mind. Step outside to the expansive backyard with endless potential—ideal for entertaining, adding a firepit, or creating your own private retreat - plenty space to park your RV or your boat. Don’t miss this opportunity schedule your private showing today !
-
2020-07-06soldstatus $41,300
-
2006-01-17soldstatus $45,000
-
1988-12-01soldstatus $15,400
-
1981-11-01soldstatus $23,500
ⓘ Source: listings_history table (triggers on properties + properties_extension) + one-shot
backfill from property_details.listing_events for pre-trigger history.
Tax reassessment forecast FL · Resets to sale price
- Current annual tax
- $1,004 · $84/mo
- Projected year-2 tax
- $1,411 · $118/mo
- Expected delta
- +$407/yr (+$34/mo · 40.5%)
ⓘ Screening estimate from a state-policy table — verify with the county assessor before closing.
Climate risk First Street
- Flood 4/10 Moderate FEMA zone X (unshaded) · 20% chance over 30 yrs
- Wildfire 1/10 Low
- Heat 10/10 Extreme 7 d/yr ≥106°F today · 22 d/yr by 30 yrs out
- Wind 9/10 Extreme 99% chance of damaging wind over 30 yrs
- Air quality 1/10 Low 0 unhealthy d/yr today · 0 by 30 yrs out
Nearby sold comps map
Loading sold comps map…
Walkable amenities ~0.75 mi
Loading nearby amenities…
Taxation est. · year 1
- Rental income
- $23,015
- − Mortgage interest
- −$9,523
- − Property taxes
- −$1,004
- − Insurance
- −$850
- − Repairs & maintenance
- −$1,841
- − Management
- −$1,841
- − Depreciation
- −$4,945
- Taxable income
- $3,011
- Est. tax owed @ 24.0%
- −$723
- After-tax cash flow
- $4,907/yr
For passive investors: Depreciation is non-cash, so a rental often shows a tax loss while cash-flowing — sheltering income. Rental losses are passive: they offset passive income freely, and up to $25,000/yr can offset ordinary (W-2) income if you actively participate and your MAGI is under $100k (phasing out to $0 by $150k); unused losses carry forward. On sale, claimed depreciation is recaptured at up to 25%, and gains may owe capital-gains tax (a 1031 exchange can defer both). Figures are a year-1 estimate at your 24.0% rate — not tax advice; consult a CPA.
Schools (NCES district)
- District
- Escambia
- NCES district ID
- 1200510
- Math proficiency
- 40% ▼ -9.00%
- Reading proficiency
- 45% ▼ -4.00%
- Median HH income
- $44,649
- Composite
- 36.04/100
- National rank
- #4773
- State rank
- #56 of 73 in FL
Livability — Ferry Pass
- Score
- 65/100
- State rank
- #664
- US rank
- #13543
Category grades
Schools grade is shown separately in the Schools card above.
Census & demographics
- Census place
- Ferry Pass, FL
- County
- Escambia County · 301,722 people
- City population
- 43,072
- Metro
- Pensacola-Ferry Pass-Brent, FL
- Population (ZIP)
- 42,447
- Household income
- $66,644
- Rent vs Own
- Severe rent burden
- 1962.0
Population outlook (Escambia County) Hauer SSP2
- Today (2025)
- 334,637 people
- By 2030
- 345,779 · +3.3%
- By 2040
- 364,828 · +9.0%
- By 2050
- 378,514 · +13.1%
- By 2075
- 403,220 · +20.5%
- By 2100
- 386,125 · +15.4%
Race, ethnicity, and origin ACS 2023
- Neighborhood character
- Diverse neighborhood (Simpson 0.55)
- Race & ethnicity
- White 63% Black 22% Two or more races 9% Hispanic / Latino 7% Asian 2%
- Hispanic origin (detail)
- Mexican 2% Puerto Rican 2%
- Common ancestry
- Italian 3% Lithuanian 2% Slovak 2%
- Foreign-born
- 6% · Canada, South Korea
- Languages at home
- 91% English-only · Spanish 5% Other Indo-European 1% Tagalog/Filipino 1%
Political lean MEDSL · Escambia
- 2024 margin
- R (+19.5) · D 39.7% · R 59.2% · Other 1.1%
- 2008→2024 swing
- -0.2pp no change · 2008: -19.3pp · 2024: -19.5pp
- All cycles
- 2024: R+19.5 2020: R+15.1 2016: R+20.6 2012: R+20.6 2008: R+19.3
Not yet ingested
- Civics
- —
Market trends
- HPI YoY
- ▼ -120.99%
- Current HPI
- 266.7408
- Rent YoY
- ▲ 0.76%
- Metro
- Pensacola-Ferry Pass-Brent, FL
- State GDP YoY
- ▲ 3.28%
- F500 in state
- 36
Industry mix (Fortune 500 HQ in FL)
| Industry | F500 HQs | Revenue |
|---|---|---|
| Industrial Technology | 2 | $29B |
|
||
| Insurance | 2 | $17B |
|
||
| Retail | 1 | $60B |
|
||
| Technology Distribution | 1 | $58B |
|
||
| Homebuilding | 1 | $35B |
|
||
| Technology Manufacturing | 1 | $35B |
|
||
Price history
+704.3% since first listed6 events — show timeline
- 2026-05-05 Price Changed $189,000 PARMLS
- 2026-04-16 Listed $210,000 PARMLS
- 2020-07-06 Sold (Public Records) $41,300 Public Records
- 2006-01-17 Sold (Public Records) $45,000 Public Records
- 1988-12-01 Sold (Public Records) $15,400 Public Records
- 1981-11-01 Sold (Public Records) $23,500 Public Records
Property tax history
+4.0%/yrLatest (2025): $1,004 · +28.8% YoY. Source: county tax records.
Cash-flow waterfall
monthlySold comps — $/sqft
last 12 mo · ≤1 miLoading sold comps…