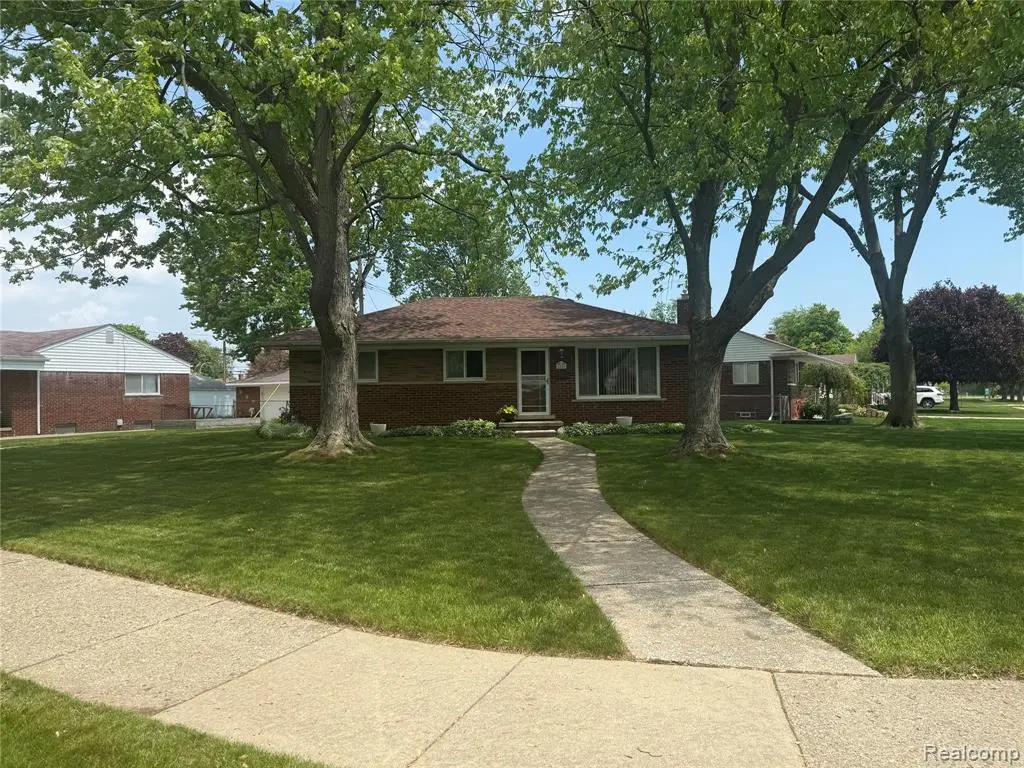
2555 Longmeadow Dr · Trenton, MI
Flood risk 1/10 · Minimal
- FEMA flood zone
- X (unshaded)
- Chance of flooding over 30 yrs
- 0.0%
- Est. flood insurance / yr
- $473 – $860
Fire risk 1/10 · Minimal
- Est. fire insurance / yr
- $784 – $1,456
Heat risk 3/10 · Minor
- Hot days now (above 96°F)
- 7 days/yr
- Hot days in 30 yrs
- 15 days/yr
Wind risk 2/10 · Minimal
- Chance of severe wind over 30 yrs
- —
Air-quality risk 2/10 · Minimal
- Unhealthy air days now
- 2 days/yr
- Unhealthy air days in 30 yrs
- 2 days/yr
Risk factors via First Street. Map © Google.
Why this score? — see what drove the D+ grade
The composite is a weighted blend of 9 inputs, each scored 0–100. Each bar is that input's sub-score; the figure is the points it added to the 100-point composite (weight × sub-score).
- ARV discount +15.0/15.0
- Cash flow +12.6/30.0
- 1% rule +4.7/10.0
- Livability +4.4/5.0
- Schools +4.2/10.0
- DSCR +3.8/10.0
- Rent growth +2.5/5.0
- Condition / age +2.5/5.0
- Appreciation +0.0/10.0
$169,900
🖨 Deal sheet (PDF) 📄 Offer letter ✓ Due diligence
Listing remarks MLS
IT IS ALL ABOUT THE LOCATION OF THIS: 3 bedroom Trenton brick ranch situated on an oversized corner lot! Foyer w/ entrance closet * cove ceilings & wet plaster walls in L/R and D/R * Oak hardwood floors throughout * #1 bedroom being used as a home office and the closet is being used as a pantry (hdwd flooring under the plywood) * #2 bedroom has hardwood flooring under the carpeting * #3 bedroom has hardwood flooring under the present tile floor * bathroom has original ceramic tile and is in EXCELLENT condition * kitchen has original cabinetry, stainless steel refrigerator, gas stove * basement has poured walls, circuit breakers, glass block windows, built-in shelving * newer sewer line and newer trap * Amana furnace * vinyl windows throughout home * attractive brick paver patio plus large shed to house lawn equipment *
Key facts
- Oversized corner lot
- Original cabinetry
- Gas stove
Tags
Property features AI
Finance
- Other: Lot approximately 0.2 acres (100 x 83); Subdivision: Butler Farms Sub
Exterior
- Parking: No garage
- Utilities: Public water; Public sewer
- Home design: Single-family residence; One level; Ground-level entry with steps; Brick construction
- Construction: Brick construction; Asphalt roof; Unfinished basement
- Exterior features: Asphalt roof; Paved road access; Unfinished basement
Interior
- Kitchen: Gas range; Garbage disposal
- Bedrooms: Total of 5 rooms (includes bedrooms and living spaces)
- Bathrooms: 1 full bathroom
- Heating & cooling: Forced air heating; Natural gas heating; No central cooling
- Interior features: Disposal; Free-standing gas range
- Laundry & utility: Washer; Dryer
Neighborhood map
What this means for you Summary
Snapshot
- This is a 3-bed/1.5-bath single-family listed at $170k.
Deal economics
- At list price, monthly cash flow is $-21 ($-252/yr) — negative.
- To cash-flow at today's rent, offer at most $166k (2.2% below list).
- To meet the 1% rule (rent ≥ 1% of price), the offer needs to be $165k (2.8% below list).
- Recommended offer: $165k (2.8% below list) — sets the bar for 1% rule.
- Cap rate 6.1% vs local median 3.9% in Trenton — top-decile yield for the area; either an underpriced asset or a hidden risk that comps aren't pricing in. Stress-test before assuming the spread holds.
Location & tenants
- Location reads 88/100 on livability (#15 in MI, #250 nationally) — a professional / high-income tenant draw. Strengths: crime A+, cost of living A+, housing A+.
- Trenton Public Schools (suburban): math 44% / reading 53% proficiency, ranked #109 of 540 in MI (top 20%) — families likely to look elsewhere, expect single-tenant / working-renter base with shorter leases.
- Zoned schools: Jesse L Anderson Elementary School (math 52% / reading 58%, grade C, #271 of 1,397 statewide, top 20%, 582 students, 31% FRL); Boyd W Arthurs Middle School (math 40% / reading 53%, grade D+, #150 of 493 statewide, top 31%, 513 students, 32% FRL); Trenton High School (math 47% / reading 62%, grade C-, #109 of 713 statewide, top 17%, 892 students, 30% FRL).
- Market conditions: 181 active listings in the ZIP; 1 comparable units currently listed for rent nearby; solid renter incomes; 2,639 units permitted in Wayne County in 2024 (1,216 in 5+ unit buildings).
Forward outlook
- Local home prices are declining (-3.0%/yr); year-one equity from $1k of loan paydown is wiped out by about $5k of value loss. Plan a longer hold.
- Wayne County population projected at -17% by 2050 — secular population decline; favor cash flow + early exit over multi-decade hold.
Negotiation context
- Only 5 days on market — expect competitive offers; lowballing is unlikely to land.
- 2 sale attempts with the ask held roughly flat each time — persistent listings suggest the price (not the market) is what's stuck; bring a comps-based counter.
Risks & watch-outs
- Watch-outs: property tax is 2.6% of price; built in 1955 — expect roof / HVAC / electrical / plumbing capex.
Questions for the listing agent
- What do current leases actually rent for vs. the listed asking? Can we see a recent rent roll and the last 12 months of T-12 income?
- Built in 1955 — when were the roof, HVAC, electrical panel, plumbing, and water heater last replaced?
- Property tax is high relative to price — has the assessment been appealed recently, and will the sale trigger a re-assessment?
- Is there a deadline driving the sale (1031 exchange, divorce, estate, relocation)? That informs how much negotiation room exists.
- Schools are B-rated — typically a magnet for longer-tenancy family renters. What's the average tenant stay here, and is there a school-zone premium baked into asking?
- The area grade is low — what's the realistic commute time and amenity access for the typical tenant pool here? Any planned neighborhood developments (good or bad) we should know about?
- What's the average days-on-market for RENTAL listings here right now (not sales)? A rising rental-DOM trend means longer vacancies and softer asking-rent achievability than the comps imply.
- What's the recent tenant-quality profile in this submarket — average credit score on applications, eviction rate, late-payment / NSF rate, and stable-employment percentage? A property-management company in the area should have these aggregated.
- How much new for-sale + rental construction is in the pipeline within 1–3 miles? Heavy new supply typically softens prices + rents 12–24 months out; constrained supply supports both.
Investment metrics
- 1% rule
- 0.97% ✗
- Cap rate
- 6.14%
- Cash-on-cash
- -0.53%
- DSCR
- 0.98
- GRM
- 8.6
CMA / ARV
- ARV (on-the-fly)
- $216,675
- Comps found
- 11
Show comp detail 11 sales within ~0.75 mi
| Address | Dist | Beds/Ba | Sqft | Sold | Price | $/sf | Match |
|---|---|---|---|---|---|---|---|
| 2490 Pinetree Dr | 0.06mi | 3/2.0 | 963 (0%) | 4mo | $227,500 | $236 | 92 |
| 2431 Grange Rd | 0.24mi | 3/1.0 | 954 (-1%) | 3mo | $215,000 | $225 | 83 |
| 2450 Sherwood St | 0.26mi | 3/1.5 | 954 (-1%) | 11mo | $208,500 | $219 | 77 |
| 1934 Pinetree Dr | 0.42mi | 3/1.5 | 1,040 (+8%) | 5mo | $260,000 | $250 | 63 |
| 3256 S Stella Ct | 0.40mi | 3/1.0 | 1,055 (+10%) | 5mo | $200,000 | $190 | 59 |
| 2980 Maxwell St | 0.51mi | 3/1.0 | 1,044 (+8%) | 8mo | $215,000 | $206 | 53 |
| 2950 Manning St | 0.49mi | 3/1.5 | 1,008 (+5%) | 22mo | $205,000 | $203 | 50 |
| 1925 Pinetree Dr | 0.43mi | 3/2.0 | 1,040 (+8%) | 24mo | $234,000 | $225 | 45 |
| 2990 Maxwell St | 0.52mi | 3/2.0 | 1,026 (+6%) | 24mo | $235,000 | $229 | 43 |
| 3101 Maxwell St | 0.59mi | 3/2.0 | 1,044 (+8%) | 22mo | $261,000 | $250 | 38 |
| 3122 Patton St | 0.67mi | 3/1.0 | 1,044 (+8%) | 19mo | $189,900 | $182 | 37 |
Match score weights: distance 35% · size 25% · config 20% · recency 20%. Top-matched comps best support the ARV.
Projected returns pro-forma
-3.0% appreciation · 3.0% rent growth · sell at horizon
- IRR
- -17.1%
- Equity multiple
- 0.40×
- Total profit
- $-28,753
- Equity at exit
- $25,333
- IRR
- -8.9%
- Equity multiple
- 0.45×
- Total profit
- $-26,284
- Equity at exit
- $14,690
Cash invested: $47,572 (down + closing). Projections, not guarantees.
Landlord ↔ Tenant lean methodology
- Overall (STATE)
- 62 Landlord-Friendly
- State Michigan
- 62 Landlord-Friendly · EVEN
- County
- — inherits STATE
- City
- — inherits STATE
ZIP-level market 48183
- Active inventory
- 181
- Price-to-rent
- 8.6×
Monthly cashflow live
- Estimated rent
- $1,651 medium interval (Pro) →
- Mortgage (P&I)
- −$891
- Tax from tax record
- −$364 /mo · $4,365/yr
- Insurance
- −$71
- HOA
- −$0
- Vacancy / Maint / Mgmt
- −$347
- Net cashflow
- $-21
Break-even live
Sensitivity live
| Price | -10% $75 | -5% $27 | +0% $-21 | +5% $-69 | +10% $-117 |
|---|---|---|---|---|---|
| Rent | -10% $-151 | -5% $-86 | +0% $-21 | +5% $44 | +10% $109 |
| Rate | -1.0pp $65 | -0.5pp $22 | base $-21 | +0.5pp $-65 | +1.0pp $-110 |
UW: 25.0% down · 7.5% · 30yr · 1.5% tax · 5.0% vac · 8.0% maint · 8.0% mgmt
Financing live
Cash to close
- Down payment
- $42,475
- Closing costs
- $5,097
- Reserves months
- —
- Total cash needed
- —
Loan-product check · same deal, 3 products live
Conventional
25% down · 7.5% · 30yr
- Down + closing
- —
- Monthly P&I
- —
- Monthly cashflow
- —
- DSCR
- —
- Eligible?
- —
Personal DTI + credit; lowest rate.
DSCR
20% down · 8.5% · 30yr
- Down + closing
- —
- Monthly P&I
- —
- Monthly cashflow
- —
- DSCR
- —
- Eligible?
- —
No personal income docs; deal must DSCR.
Hard money
10% down · 12.0% · 12mo
- Down + closing
- —
- Monthly P&I
- —
- Monthly cashflow
- —
- DSCR
- —
- Eligible?
- —
Short-term bridge; refi at stabilization.
Rent comps 1 comps
| Address | Beds | Baths | Sqft | Rent | $/sqft | DOM | Units | Dist |
|---|---|---|---|---|---|---|---|---|
| 25010 Marsh Creek Blvd Woodhaven, MI | 2.0–3.0 | 2.0 | 1150 | $2,123 | $1.85 | 0d | 6 | 1.33mi |
Listing history 4 events
-
2026-06-15statusdays on market $169,900 Pending 5 DOM
-
2026-06-13days on market $169,900 Active 4 DOM
-
2026-06-10remarks 695-char remark
-
2026-06-10$169,900 Active 1 DOM
ⓘ Source: listings_history table (triggers on properties + properties_extension) + one-shot
backfill from property_details.listing_events for pre-trigger history.
Tax reassessment forecast MI · Partial reset (capped growth)
- Current annual tax
- $4,365 · $364/mo
- Projected year-2 tax
- $4,365 · $364/mo
- Expected delta
- $0/yr ($0/mo · 0.0%)
ⓘ Screening estimate from a state-policy table — verify with the county assessor before closing.
Climate risk First Street
- Flood 1/10 Low FEMA zone X (unshaded) · 0% chance over 30 yrs
- Wildfire 1/10 Low
- Heat 3/10 Moderate 7 d/yr ≥96°F today · 15 d/yr by 30 yrs out
- Wind 2/10 Low
- Air quality 2/10 Low 2 unhealthy d/yr today · 2 by 30 yrs out
Nearby sold comps map
Loading sold comps map…
Walkable amenities ~0.75 mi
Loading nearby amenities…
Taxation est. · year 1
- Rental income
- $19,815
- − Mortgage interest
- −$9,517
- − Property taxes
- −$4,365
- − Insurance
- −$850
- − Repairs & maintenance
- −$1,585
- − Management
- −$1,585
- − Depreciation
- −$4,943
- Taxable loss
- −$3,030
- Est. tax savings @ 24.0%
- +$727
- After-tax cash flow
- $475/yr
For passive investors: Depreciation is non-cash, so a rental often shows a tax loss while cash-flowing — sheltering income. Rental losses are passive: they offset passive income freely, and up to $25,000/yr can offset ordinary (W-2) income if you actively participate and your MAGI is under $100k (phasing out to $0 by $150k); unused losses carry forward. On sale, claimed depreciation is recaptured at up to 25%, and gains may owe capital-gains tax (a 1031 exchange can defer both). Figures are a year-1 estimate at your 24.0% rate — not tax advice; consult a CPA.
Schools (NCES district)
- District
- Trenton Public Schools
- NCES district ID
- 2633900
- Math proficiency
- 44% ▼ -7.00%
- Reading proficiency
- 53% ▼ -2.00%
- Median HH income
- $55,947
- Composite
- 42.08/100
- National rank
- #3321
- State rank
- #109 of 540 in MI
Livability — Trenton
- Score
- 88/100
- State rank
- #15
- US rank
- #250
Category grades
Schools grade is shown separately in the Schools card above.
Census & demographics
- Census place
- Trenton, MI
- County
- Wayne County · 1,562,939 people
- Metro
- Detroit-Warren-Dearborn, MI
- Population (ZIP)
- 41,765
- Household income
- $83,508
- Rent vs Own
- Severe rent burden
- 836.0
Population outlook (Wayne County) Hauer SSP2
- Today (2025)
- 1,675,273 people
- By 2030
- 1,620,300 · -3.3%
- By 2040
- 1,502,341 · -10.3%
- By 2050
- 1,384,039 · -17.4%
- By 2075
- 1,124,592 · -32.9%
- By 2100
- 881,193 · -47.4%
Race, ethnicity, and origin ACS 2023
- Neighborhood character
- Predominantly White (82%)
- Race & ethnicity
- White 82% Hispanic / Latino 6% Black 5% Two or more races 5% Asian 2%
- Hispanic origin (detail)
- Mexican 4%
- Common ancestry
- Romanian 15% Lithuanian 4% Slovak 2%
- Foreign-born
- 4% · Canada
- Languages at home
- 94% English-only · Other Indo-European 3% Spanish 2%
Political lean MEDSL · Wayne
- 2024 margin
- Strong D (+29.0) · D 62.7% · R 33.7% · Other 3.6%
- 2008→2024 swing
- -20.5pp toward R · 2008: 49.5pp · 2024: 29.0pp
- All cycles
- 2024: D+29.0 2020: D+38.1 2016: D+37.3 2012: D+46.9 2008: D+49.5
Not yet ingested
- Civics
- —
Market trends
- HPI YoY
- ▼ -222.34%
- Current HPI
- 216.3623
- Rent YoY
- —
- Metro
- Detroit-Warren-Dearborn, MI
- State GDP YoY
- ▲ 1.37%
- F500 in state
- 28
Industry mix (Fortune 500 HQ in MI)
| Industry | F500 HQs | Revenue |
|---|---|---|
| Automotive Parts | 3 | $48B |
|
||
| Automotive | 2 | $372B |
|
||
| Chemicals | 1 | $45B |
|
||
| Automotive Retail | 1 | $29B |
|
||
| Healthcare / Medical Devices | 1 | $23B |
|
||
| Automotive Technology | 1 | $20B |
|
||
Price history
+0.0% since first listed2 events — show timeline
- 2026-06-09 Listed $169,900 MiRealSource-MiMLS
- 2026-06-09 Listed $169,900 REALCOMP
Property tax history
+3.3%/yrLatest (2025): $4,365 · +7.9% YoY. Source: county tax records.
Cash-flow waterfall
monthlySold comps — $/sqft
last 12 mo · ≤1 miLoading sold comps…