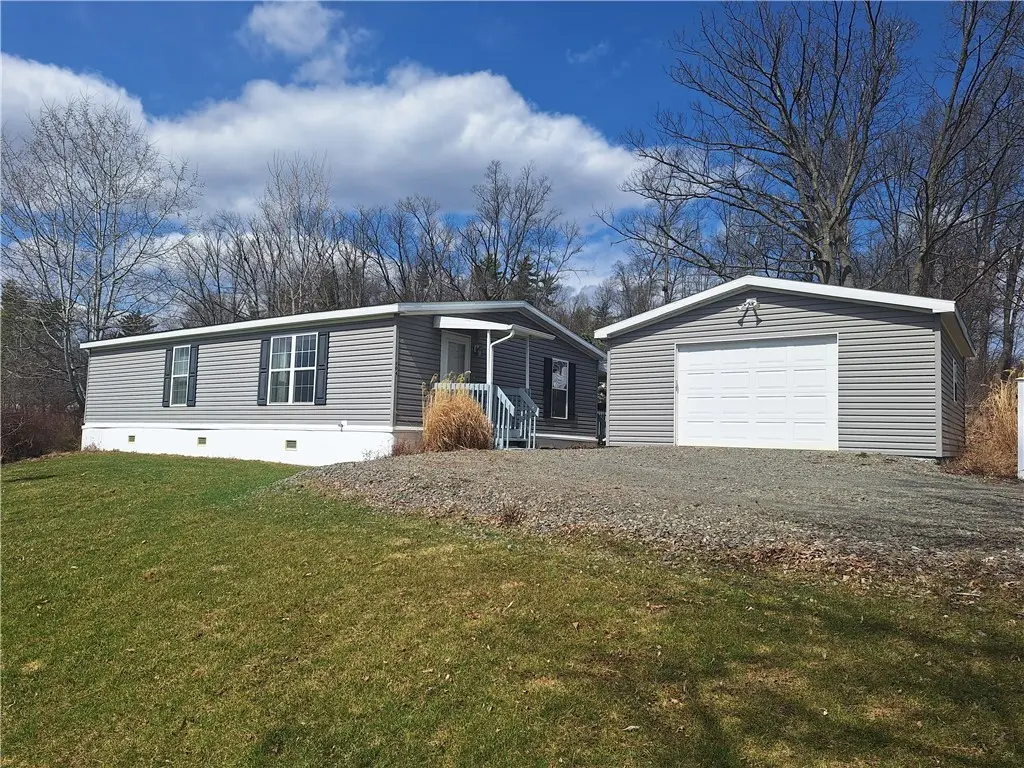
104 Jordan Ave Ave · Northwest Ithaca, NY
Flood risk 8/10 · Major
- FEMA flood zone
- —
- Chance of flooding over 30 yrs
- 0.99%
- Est. flood insurance / yr
- —
Fire risk 1/10 · Minimal
- Est. fire insurance / yr
- $691 – $1,283
Heat risk 2/10 · Minimal
- Hot days now (above 96°F)
- 5 days/yr
- Hot days in 30 yrs
- 11 days/yr
Wind risk 2/10 · Minimal
- Chance of severe wind over 30 yrs
- 1.0%
Air-quality risk 1/10 · Minimal
- Unhealthy air days now
- 0 days/yr
- Unhealthy air days in 30 yrs
- 0 days/yr
Risk factors via First Street. Map © Google.
Why this score? — see what drove the A- grade
The composite is a weighted blend of 9 inputs, each scored 0–100. Each bar is that input's sub-score; the figure is the points it added to the 100-point composite (weight × sub-score).
- Cash flow +30.0/30.0
- ARV discount +15.0/15.0
- 1% rule +10.0/10.0
- DSCR +10.0/10.0
- Schools +5.4/10.0
- Rent growth +3.8/5.0
- Livability +3.5/5.0
- Condition / age +2.5/5.0
- Appreciation +0.0/10.0
$107,000
🖨 Deal sheet 📄 Offer letter ✓ Due diligence
Listing remarks
Wonderful Ritzcraft Nantucket home in Collegeview North Park! This low-maintenance, easy-living home offers distant views from its raised, thoughtfully landscaped lot. Inside, you'll find a well-designed layout with a centrally located kitchen, open-concept living areas, and a great back deck, creating a warm atmosphere for entertaining or relaxing. This home has sheetrocked walls throughout, adding a polished feel. The main bedroom is a serene retreat, with a spacious en-suite bath and a huge walk-in closet. The second bedroom offers a large closet, great light, and a full bath across the hall. There is also a 20x20 garage for extra storage and weather-free parking. Schedule your private
Key facts
- Garage
- Built 2009
- Listed 35 days
Property features AI
Finance
- HOA & community: Land lease: $545
Exterior
- Parking: Detached garage with workshop and storage; Garage door opener; Driveway; Gravel parking areas; One garage space
- Utilities: Well water; Septic tank; Propane available; Electricity connected; Cable available
- Home design: Manufactured double-wide home; One-level / single-story; RitzCraft model
- Construction: Vinyl siding; Asphalt roof; Built as a manufactured (RitzCraft) home
- Exterior features: Deck; Sliding doors; Irregular lot (see remarks); Public maintained road frontage on a city street
Interior
- Kitchen: Gas oven and gas range; Refrigerator; Eat-in kitchen layout
- Bedrooms: Two main-level bedrooms
- Flooring: Carpet; Vinyl; Varies
- Bathrooms: Two full bathrooms (both on the main level)
- Heating & cooling: Propane forced-air heating
- Interior features: Breakfast bar; Eat-in kitchen; Pantry; Skylight(s)
- Laundry & utility: Washer and dryer; Laundry room on the main level; Electric water heater
Neighborhood map
What this means for you Summary
Snapshot
- This is a 2-bed/2.0-bath manufactured listed at $107k.
Deal economics
- At list price, monthly cash flow is $905 ($11k/yr) — positive.
- The deal already cash-flows at list — no discount required.
- Meets the 1% rule at list price ($2k rent vs $107k).
- Recommended offer: $104k (3.0% below list) — sets the bar for market timing.
Location & tenants
- Location reads 69/100 on livability (#488 in NY) — a middle-class / working-renter tenant base. Strengths: health & safety A+, crime A, employment A; Watch: amenities F, commute F.
- Ithaca City School District (urban): math 57% / reading 71% proficiency, ranked #195 of 590 in NY (top 33%) — acceptable for families but not a draw, mixed tenant base, ~2y average lease.
- Zoned schools: Enfield School (math 10% / reading 30%, grade F, #1,945 of 2,108 statewide, top 94%, 164 students, 65% FRL) — zoned schools average 65% FRL vs 30% district-wide (35 pts higher); higher-poverty schools than district average — tighter screening recommended.
- Zoned-school proficiency averages 20% at this address vs 64% district-wide (-44 pts) — the specific schools serving this property underperform the Ithaca City School District average; the district grade overstates school quality for this exact location.
- Market conditions: Rents rising fast (+5.2%/yr); 327 active listings in the ZIP; 1 comparable units currently listed for rent nearby; 382 units permitted in Tompkins County in 2024 (208 in 5+ unit buildings).
- This rent runs 34% of the median local income ($71k/yr) — at the standard rent-burdened threshold; future hikes will face affordability resistance.
Forward outlook
- Local home prices are declining (-3.0%/yr); year-one equity from $740 of loan paydown is wiped out by about $3k of value loss. Plan a longer hold.
- Tompkins County population projected at +17% by 2050 — long-run rental-demand tailwind backs the buy-and-hold thesis.
- At projected returns (-3.0% appreciation + 5.2% rent growth), your $30k cash investment doubles in ~4 years — after that, you're playing with house money.
Negotiation context
- It's been on market 35 days — a 3% lower offer ($104k) is reasonable based on typical stale-listing flexibility.
- 2 sale attempts; this cycle's ask has dropped $12k (10%) from the opening price — seller is motivated, your offer sets the floor, not the list.
Risks & watch-outs
- Climate carrying-cost: severe flood risk — expect insurance premiums to compound above CPI over the hold.
Questions for the listing agent
- It's been on market 35 days. Have you received any prior offers? Is the seller open to a 3% concession, seller financing, or rate buy-down credit?
- Is there a deadline driving the sale (1031 exchange, divorce, estate, relocation)? That informs how much negotiation room exists.
- Schools are D-rated, which usually means shorter tenancies and higher turnover. Who's the typical renter profile here, and what's been the actual vacancy rate?
- What's the average days-on-market for RENTAL listings here right now (not sales)? A rising rental-DOM trend means longer vacancies and softer asking-rent achievability than the comps imply.
- What's the recent tenant-quality profile in this submarket — average credit score on applications, eviction rate, late-payment / NSF rate, and stable-employment percentage? A property-management company in the area should have these aggregated.
- How much new for-sale + rental construction is in the pipeline within 1–3 miles? Heavy new supply typically softens prices + rents 12–24 months out; constrained supply supports both.
Investment metrics
- 1% rule
- 1.91% ✓
- Cap rate
- 16.44%
- Cash-on-cash
- 36.25%
- DSCR
- 2.61
- GRM
- 4.4
CMA / ARV
- ARV (on-the-fly)
- $150,375
- Comps found
- 2
Show comp detail 2 sales within ~0.75 mi
| Address | Dist | Beds/Ba | Sqft | Sold | Price | $/sf | Match |
|---|---|---|---|---|---|---|---|
| 104 Jordan Ave Ave | 0.00mi | 2/2.0 | 1,203 (0%) | 1mo | $100,000 | $83 | 99 |
| 182 Brianna Dr | 0.10mi | 3/2.0 (+1) | 1,102 (-8%) | 1mo | $137,900 | $125 | 76 |
Match score weights: distance 35% · size 25% · config 20% · recency 20%. Top-matched comps best support the ARV.
Projected returns pro-forma
-3.0% appreciation · 5.22% rent growth · sell at horizon
- IRR
- 34.5%
- Equity multiple
- 2.50×
- Total profit
- $44,990
- Equity at exit
- $15,954
- IRR
- 42.5%
- Equity multiple
- 5.46×
- Total profit
- $133,530
- Equity at exit
- $9,251
Cash invested: $29,960 (down + closing). Projections, not guarantees.
Landlord ↔ Tenant lean methodology
- Overall (STATE)
- 15 Strongly Tenant-Friendly
- State New York
- 15 Strongly Tenant-Friendly · D+10
- County
- — inherits STATE
- City
- — inherits STATE
ZIP-level market 14850
- Rents YoY
- 5.2%
- Active inventory
- 327
- Price-to-rent
- 4.4×
Monthly cashflow live
- Estimated rent
- $2,048 medium interval (Pro) →
- Mortgage (P&I)
- −$561
- Tax from tax record
- −$107 /mo · $1,282/yr
- Insurance
- −$45
- HOA
- −$0
- Vacancy / Maint / Mgmt
- −$430
- Net cashflow
- $905
Break-even live
UW: 25.0% down · 7.5% · 30yr · 1.5% tax · 5.0% vac · 8.0% maint · 8.0% mgmt
Financing live
Cash to close
- Down payment
- $26,750
- Closing costs
- $3,210
- Reserves months
- —
- Total cash needed
- —
Loan-product check · same deal, 3 products live
Conventional
25% down · 7.5% · 30yr
- Down + closing
- —
- Monthly P&I
- —
- Monthly cashflow
- —
- DSCR
- —
- Eligible?
- —
Personal DTI + credit; lowest rate.
DSCR
20% down · 8.5% · 30yr
- Down + closing
- —
- Monthly P&I
- —
- Monthly cashflow
- —
- DSCR
- —
- Eligible?
- —
No personal income docs; deal must DSCR.
Hard money
10% down · 12.0% · 12mo
- Down + closing
- —
- Monthly P&I
- —
- Monthly cashflow
- —
- DSCR
- —
- Eligible?
- —
Short-term bridge; refi at stabilization.
Rent comps 1 comps
| Address | Beds | Baths | Sqft | Rent | $/sqft | DOM | Units | Dist |
|---|---|---|---|---|---|---|---|---|
| 5 Maxs Dr Ithaca, NY | 2.0 | 2.0 | 1488 | $2,700 | $1.81 | 44d | 1 | 1.22mi |
Listing history 6 events
-
2026-05-06status Pending
-
2026-05-01historical Active Under Contract
-
2026-04-20price $107,000
-
2026-04-15status Active
-
2026-04-13historical Active Under Contract
-
2026-04-01$119,000 Active
ⓘ Source: listings_history table (triggers on properties + properties_extension) + one-shot
backfill from property_details.listing_events for pre-trigger history.
Tax reassessment forecast NY · Partial reset (capped growth)
- Current annual tax
- $1,282 · $107/mo
- Projected year-2 tax
- $1,545 · $129/mo
- Expected delta
- +$263/yr (+$22/mo · 20.5%)
ⓘ Screening estimate from a state-policy table — verify with the county assessor before closing.
Climate risk First Street
- Flood 8/10 Severe 99% chance over 30 yrs
- Wildfire 1/10 Low
- Heat 2/10 Low 5 d/yr ≥96°F today · 11 d/yr by 30 yrs out
- Wind 2/10 Low 100% chance of damaging wind over 30 yrs
- Air quality 1/10 Low 0 unhealthy d/yr today · 0 by 30 yrs out
Nearby sold comps map
Loading sold comps map…
Walkable amenities ~0.75 mi
Loading nearby amenities…
Taxation est. · year 1
- Rental income
- $24,570
- − Mortgage interest
- −$5,994
- − Property taxes
- −$1,282
- − Insurance
- −$535
- − Repairs & maintenance
- −$1,966
- − Management
- −$1,966
- − Depreciation
- −$3,113
- Taxable income
- $9,715
- Est. tax owed @ 24.0%
- −$2,332
- After-tax cash flow
- $8,528/yr
For passive investors: Depreciation is non-cash, so a rental often shows a tax loss while cash-flowing — sheltering income. Rental losses are passive: they offset passive income freely, and up to $25,000/yr can offset ordinary (W-2) income if you actively participate and your MAGI is under $100k (phasing out to $0 by $150k); unused losses carry forward. On sale, claimed depreciation is recaptured at up to 25%, and gains may owe capital-gains tax (a 1031 exchange can defer both). Figures are a year-1 estimate at your 24.0% rate — not tax advice; consult a CPA.
Schools (NCES district)
- District
- Ithaca City School District
- NCES district ID
- 3615570
- Math proficiency
- 57% ▼ -5.00%
- Reading proficiency
- 71% ▲ 11.00%
- Median HH income
- $46,528
- Composite
- 54.01/100
- National rank
- #1397
- State rank
- #195 of 590 in NY
Livability — Northwest Ithaca
- Score
- 69/100
- State rank
- #488
- US rank
- #8598
Category grades
Schools grade is shown separately in the Schools card above.
Census & demographics
- County
- Tompkins County · 68,610 people
- Metro
- Ithaca, NY
- Population (ZIP)
- 68,610
- Household income
- $71,445
- Rent vs Own
- Severe rent burden
- 5169.0
Population outlook (Tompkins County) Hauer SSP2
- Today (2025)
- 113,958 people
- By 2030
- 118,774 · +4.2%
- By 2040
- 125,927 · +10.5%
- By 2050
- 133,599 · +17.2%
- By 2075
- 156,759 · +37.6%
- By 2100
- 169,896 · +49.1%
Race, ethnicity, and origin ACS 2023
- Neighborhood character
- Predominantly White (68%)
- Race & ethnicity
- White 68% Asian 13% Hispanic / Latino 8% Two or more races 8% Black 4%
- Hispanic origin (detail)
- Mexican 2% Puerto Rican 2%
- Common ancestry
- Romanian 3% Italian 3% Scotch-Irish 2%
- Foreign-born
- 18% · China, Canada, South Korea
- Languages at home
- 79% English-only · Chinese 5% Spanish 4% Other Indo-European 4%
Political lean MEDSL · Tompkins
- 2024 margin
- Solid D (+50.6) · D 75.3% · R 24.7%
- 2008→2024 swing
- +8.6pp toward D · 2008: 42.1pp · 2024: 50.6pp
- All cycles
- 2024: D+50.6 2020: D+49.2 2016: D+42.1 2012: D+39.8 2008: D+42.1
Not yet ingested
- Civics
- —
Market trends
- HPI YoY
- ▼ -276.59%
- Current HPI
- 389.7215
- Rent YoY
- ▲ 5.22%
- Metro
- Ithaca, NY
- State GDP YoY
- ▲ 2.60%
- F500 in state
- 92
Industry mix (Fortune 500 HQ in NY)
| Industry | F500 HQs | Revenue |
|---|---|---|
| Financial Services | 10 | $950B |
|
||
| Consumer Goods | 9 | $162B |
|
||
| Insurance | 4 | $225B |
|
||
| Telecommunications | 2 | $144B |
|
||
| Pharmaceuticals | 2 | $112B |
|
||
| Media / Entertainment | 2 | $69B |
|
||
Price history
-10.1% since first listed6 events — show timeline
- 2026-05-06 Pending — IBRMLS
- 2026-05-01 Contingent — IBRMLS
- 2026-04-20 Price Changed $107,000 IBRMLS
- 2026-04-15 Relisted — IBRMLS
- 2026-04-13 Contingent — IBRMLS
- 2026-04-01 Listed $119,000 IBRMLS
Property tax history
+19.6%/yrLatest (2016): $1,282 · +182.4% YoY. Source: county tax records.
Cash-flow waterfall
monthlySold comps — $/sqft
last 12 mo · ≤1 miLoading sold comps…