 🏗️ New Construction
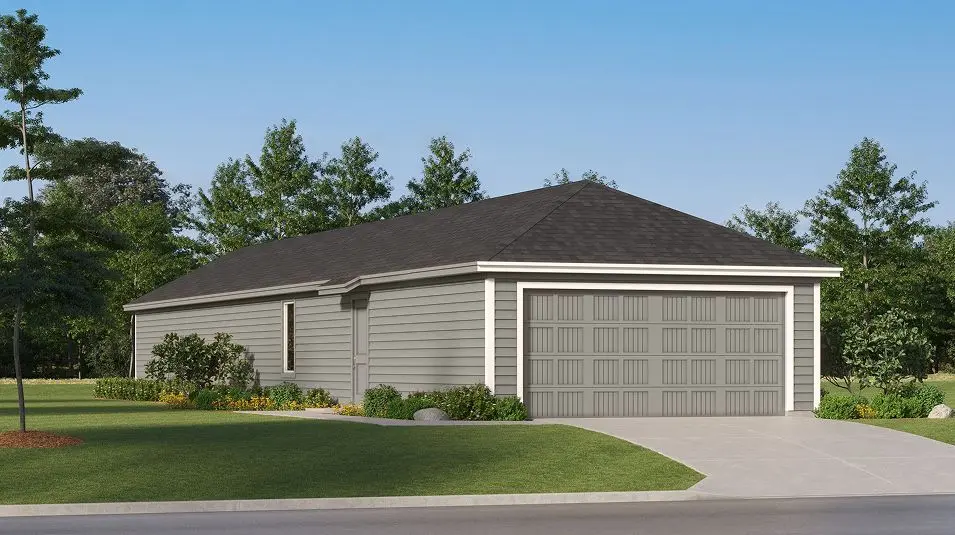
Carter Plan · Plum Grove, TX
Flood risk No data
- FEMA flood zone
- —
- Chance of flooding over 30 yrs
- —
- Est. flood insurance / yr
- —
Fire risk No data
- Est. fire insurance / yr
- —
Heat risk No data
- Hot days now (above threshold)
- —
- Hot days in 30 yrs
- —
Wind risk No data
- Chance of severe wind over 30 yrs
- —
Air-quality risk No data
- Unhealthy air days now
- —
- Unhealthy air days in 30 yrs
- —
Risk factors via First Street. Map © Google.
Why this score? — see what drove the B- grade
The composite is a weighted blend of 9 inputs, each scored 0–100. Each bar is that input's sub-score; the figure is the points it added to the 100-point composite (weight × sub-score).
- Cash flow +29.8/30.0
- DSCR +10.0/10.0
- 1% rule +8.4/10.0
- ARV discount +7.5/15.0
- Condition / age +5.0/5.0
- Rent growth +3.5/5.0
- Livability +2.9/5.0
- Schools +2.1/10.0
- Appreciation +0.0/10.0
$174,990
🖨 Deal sheet 📄 Offer letter ✓ Due diligence
Listing remarks MLS
This new single-level home features a low-maintenance layout with ample room to live and grow. Off the entry is an inviting open-concept layout that combines the kitchen with the living and dining areas. Four bedrooms are tucked away at the back of the home, including the luxe owner's suite with an en-suite bathroom and walk-in closet.
Key facts
- Luxe owner's suite
- Walk-in closet
- En-suite bathroom
Tags
Neighborhood map
What this means for you Summary
Snapshot
- This is a 4-bed/2.0-bath single-family listed at $175k. Condition is rated excellent.
Deal economics
- At list price, monthly cash flow is $629 ($8k/yr) — positive.
- The deal already cash-flows at list — no discount required.
- Meets the 1% rule at list price ($2k rent vs $175k).
- Recommended offer: $164k (6.0% below list) — sets the bar for market timing.
- Cap rate 10.7% vs local median 5.0% in Plum Grove — top-decile yield for the area; either an underpriced asset or a hidden risk that comps aren't pricing in. Stress-test before assuming the spread holds.
Location & tenants
- Location reads 58/100 on livability (#1,206 in TX) — a working-class tenant base; expect higher turnover. Strengths: crime A+, cost of living A+, housing A+; Watch: schools F, amenities F, commute F.
- Cleveland ISD (town): math 24% / reading 25% proficiency, ranked #723 of 826 in TX (top 88%) — low school quality limits family demand, transient renter base, plan for 1-2y turnover; 71% free/reduced lunch — lower-income household profile, screen leases tightly.
- Market conditions: Rents rising fast (+4.0%/yr); 1574 active listings in the ZIP; 2 comparable units currently listed for rent nearby; 1,321 units permitted in Liberty County in 2024 (0 in 5+ unit buildings).
- This rent runs 44% of the median local income ($62k/yr) — at the standard rent-burdened threshold; future hikes will face affordability resistance.
Forward outlook
- Local home prices are declining (-3.0%/yr); year-one equity from $1k of loan paydown is wiped out by about $5k of value loss. Plan a longer hold.
- Liberty County population projected at +24% by 2050 — long-run rental-demand tailwind backs the buy-and-hold thesis.
- At projected returns (-3.0% appreciation + 4.0% rent growth), your $48k cash investment doubles in ~7 years — after that, you're playing with house money.
Negotiation context
- It's been on market 90 days — a 6% lower offer ($164k) is reasonable based on typical stale-listing flexibility.
Questions for the listing agent
- It's been on market 90 days. Have you received any prior offers? Is the seller open to a 6% concession, seller financing, or rate buy-down credit?
- Why hasn't it sold? Are there any deal-killer items the seller is aware of (foundation, flood, title, zoning, code violations)?
- Is there a deadline driving the sale (1031 exchange, divorce, estate, relocation)? That informs how much negotiation room exists.
- Schools are F-rated, which usually means shorter tenancies and higher turnover. Who's the typical renter profile here, and what's been the actual vacancy rate?
- What's the average days-on-market for RENTAL listings here right now (not sales)? A rising rental-DOM trend means longer vacancies and softer asking-rent achievability than the comps imply.
- What's the recent tenant-quality profile in this submarket — average credit score on applications, eviction rate, late-payment / NSF rate, and stable-employment percentage? A property-management company in the area should have these aggregated.
- How much new for-sale + rental construction is in the pipeline within 1–3 miles? Heavy new supply typically softens prices + rents 12–24 months out; constrained supply supports both.
Investment metrics
- 1% rule
- 1.34% ✓
- Cap rate
- 10.70%
- Cash-on-cash
- 15.72%
- DSCR
- 1.70
- GRM
- 6.2
CMA / ARV
- ARV (median comp)
- $171,496
- List price
- $174,990
- Delta
- 2.04%
- Verdict
- FAIR
- Comps
- 20 within 1.0 mi
Show comp detail 5 sales within ~0.75 mi
| Address | Dist | Beds/Ba | Sqft | Sold | Price | $/sf | Match |
|---|---|---|---|---|---|---|---|
| 673 Maria Elena Way | 0.01mi | 3/2.0 (-1) | 1,411 (+2%) | 1mo | $180,991 | $128 | 91 |
| 381 Lucia Way | 0.01mi | 3/2.0 (-1) | 1,208 (-13%) | 1mo | $172,990 | $143 | 72 |
| 378 Lucia Way | 0.01mi | 3/2.0 (-1) | 1,208 (-13%) | 1mo | $174,990 | $145 | 72 |
| 338 Road 5840 Rd | 0.60mi | 3/2.0 (-1) | 1,350 (-3%) | 1mo | $172,000 | $127 | 62 |
| 662 Road 5846 | 0.75mi | 3/2.0 (-1) | 1,277 (-8%) | 6mo | $255,000 | $200 | 42 |
Match score weights: distance 35% · size 25% · config 20% · recency 20%. Top-matched comps best support the ARV.
Projected returns pro-forma
-3.0% appreciation · 4.0% rent growth · sell at horizon
- IRR
- 7.7%
- Equity multiple
- 1.31×
- Total profit
- $14,647
- Equity at exit
- $25,571
- IRR
- 17.8%
- Equity multiple
- 2.55×
- Total profit
- $74,263
- Equity at exit
- $14,828
Cash invested: $48,019 (down + closing). Projections, not guarantees.
Landlord ↔ Tenant lean methodology
- Overall (STATE)
- 87 Strongly Landlord-Friendly
- State Texas
- 87 Strongly Landlord-Friendly · R+5
- County
- — inherits STATE
- City
- — inherits STATE
ZIP-level market 77327
- Home prices YoY
- -5.2%
- Rents YoY
- 4.0%
- Active inventory
- 1574
- Price-to-rent
- 6.3×
Monthly cashflow live
- Estimated rent
- $2,297 medium interval (Pro) →
- Mortgage (P&I)
- −$899
- Tax est. 1.5%
- −$214 /mo · $2,572/yr
- Insurance
- −$71
- HOA
- −$0
- Vacancy / Maint / Mgmt
- −$482
- Net cashflow
- $629
Break-even live
UW: 25.0% down · 7.5% · 30yr · 1.5% tax · 5.0% vac · 8.0% maint · 8.0% mgmt
Financing live
Cash to close
- Down payment
- $42,874
- Closing costs
- $5,145
- Reserves months
- —
- Total cash needed
- —
Loan-product check · same deal, 3 products live
Conventional
25% down · 7.5% · 30yr
- Down + closing
- —
- Monthly P&I
- —
- Monthly cashflow
- —
- DSCR
- —
- Eligible?
- —
Personal DTI + credit; lowest rate.
DSCR
20% down · 8.5% · 30yr
- Down + closing
- —
- Monthly P&I
- —
- Monthly cashflow
- —
- DSCR
- —
- Eligible?
- —
No personal income docs; deal must DSCR.
Hard money
10% down · 12.0% · 12mo
- Down + closing
- —
- Monthly P&I
- —
- Monthly cashflow
- —
- DSCR
- —
- Eligible?
- —
Short-term bridge; refi at stabilization.
Rent comps 2 comps
| Address | Beds | Baths | Sqft | Rent | $/sqft | DOM | Units | Dist |
|---|---|---|---|---|---|---|---|---|
| 662 Road 590110 Cleveland, TX | 4.0 | 2.0 | 1600 | $2,200 | $1.38 | 12d | 1 | 0.21mi |
| 203 Road 5248 Cleveland, TX | 3.0 | 2.0 | 910 | $1,680 | $1.85 | 15d | 1 | 0.98mi |
Listing history 14 events
-
2026-06-18days on market $174,990 Active 90 DOM
-
2026-06-17days on market $174,990 Active 89 DOM
-
2026-06-16days on market $174,990 Active 88 DOM
-
2026-06-15days on market $174,990 Active 87 DOM
-
2026-06-13days on market $174,990 Active 85 DOM
-
2026-06-09days on market $174,990 Active 81 DOM
-
2026-06-08days on market $174,990 Active 80 DOM
-
2026-06-07days on market $174,990 Active 79 DOM
-
2026-06-04days on market $174,990 Active 76 DOM
-
2026-06-03days on market $174,990 Active 75 DOM
-
2026-06-02days on market $174,990 Active 74 DOM
-
2026-06-01days on market $174,990 Active 73 DOM
-
2026-05-31days on market $174,990 Active 72 DOM
-
2026-03-20$174,990 Active 337-char remark
Show marketing remark (337 chars)
This new single-level home features a low-maintenance layout with ample room to live and grow. Off the entry is an inviting open-concept layout that combines the kitchen with the living and dining areas. Four bedrooms are tucked away at the back of the home, including the luxe owner's suite with an en-suite bathroom and walk-in closet.
ⓘ Source: listings_history table (triggers on properties + properties_extension) + one-shot
backfill from property_details.listing_events for pre-trigger history.
Nearby sold comps map
Loading sold comps map…
Walkable amenities ~0.75 mi
Loading nearby amenities…
Taxation est. · year 1
- Rental income
- $27,559
- − Mortgage interest
- −$9,606
- − Property taxes
- −$2,572
- − Insurance
- −$857
- − Repairs & maintenance
- −$2,205
- − Management
- −$2,205
- − Depreciation
- −$4,989
- Taxable income
- $5,124
- Est. tax owed @ 24.0%
- −$1,230
- After-tax cash flow
- $6,320/yr
For passive investors: Depreciation is non-cash, so a rental often shows a tax loss while cash-flowing — sheltering income. Rental losses are passive: they offset passive income freely, and up to $25,000/yr can offset ordinary (W-2) income if you actively participate and your MAGI is under $100k (phasing out to $0 by $150k); unused losses carry forward. On sale, claimed depreciation is recaptured at up to 25%, and gains may owe capital-gains tax (a 1031 exchange can defer both). Figures are a year-1 estimate at your 24.0% rate — not tax advice; consult a CPA.
Condition & rehab AI · 3 photos
This move-in-ready single-level home features a low-maintenance layout with ample room to live and grow. The exterior is well-maintained, and the interior is ready for a fresh coat of paint and some minor updates to maximize its value.
Value-add opportunities
- Both Paint interior walls and trim — Fresh paint enhances curb appeal and interior aesthetics
- Both Install new flooring in kitchen and bathrooms — New flooring improves functionality and appearance
- Both Upgrade kitchen appliances — Modern appliances increase appeal and functionality
- Both Install smart home features — Smart home features enhance convenience and attract tech-savvy buyers
Renovation cost estimate screening
Value-add ROI direction
- Both Paint interior walls and trim — Fresh paint enhances curb appeal and interior aesthetics ↑
- Both Install new flooring in kitchen and bathrooms — New flooring improves functionality and appearance ↑
- Both Upgrade kitchen appliances — Modern appliances increase appeal and functionality ↑
- Both Install smart home features — Smart home features enhance convenience and attract tech-savvy buyers ↑
ⓘ Cost ranges are severity-bucket heuristics (US national rule-of-thumb). Get contractor quotes + a written scope before underwriting a rehab budget.
Schools (NCES district)
- District
- Cleveland ISD
- NCES district ID
- 4814370
- Math proficiency
- 24% ▼ -13.00%
- Reading proficiency
- 25% ▼ -4.00%
- Median HH income
- $39,173
- Composite
- 20.61/100
- National rank
- #8549
- State rank
- #723 of 826 in TX
Livability — Plum Grove
- Score
- 58/100
- State rank
- #1206
- US rank
- #21049
Category grades
Schools grade is shown separately in the Schools card above.
Census & demographics
- County
- Liberty County · 82,189 people
- Metro
- Houston-The Woodlands-Sugar Land, TX
- Population (ZIP)
- 42,685
- Household income
- $62,219
- Rent vs Own
- Severe rent burden
- 437.0
Population outlook (Liberty County) Hauer SSP2
- Today (2025)
- 87,956 people
- By 2030
- 92,161 · +4.8%
- By 2040
- 100,784 · +14.6%
- By 2050
- 109,471 · +24.5%
- By 2075
- 133,470 · +51.7%
- By 2100
- 147,372 · +67.6%
Race, ethnicity, and origin ACS 2023
- Neighborhood character
- Diverse neighborhood (Simpson 0.57)
- Race & ethnicity
- Hispanic / Latino 54% White 36% Two or more races 18% Black 8% Native American 2%
- Hispanic origin (detail)
- Mexican 42%
- Common ancestry
- Lithuanian 2% Serbian 1% Slovak 0%
- Foreign-born
- 22% · Canada
- Languages at home
- 51% English-only · Spanish 48%
Political lean MEDSL · Liberty
- 2024 margin
- Solid R (+61.6) · D 19.0% · R 80.6%
- 2008→2024 swing
- -17.9pp toward R · 2008: -43.7pp · 2024: -61.6pp
- All cycles
- 2024: R+61.6 2020: R+59.7 2016: R+58.0 2012: R+53.3 2008: R+43.7
Not yet ingested
- Civics
- —
Market trends
- HPI YoY
- ▼ -12.39%
- Current HPI
- 224.9222
- Rent YoY
- ▲ 4.00%
- Metro
- Houston-The Woodlands-Sugar Land, TX
- State GDP YoY
- ▲ 3.95%
- F500 in state
- 110
Industry mix (Fortune 500 HQ in TX)
| Industry | F500 HQs | Revenue |
|---|---|---|
| Energy | 16 | $1,198B |
|
||
| Technology | 5 | $198B |
|
||
| Engineering / Construction | 4 | $72B |
|
||
| Energy Services | 3 | $60B |
|
||
| Utilities | 3 | $41B |
|
||
| Healthcare | 2 | $330B |
|
||
Price history
1 event — show timeline
- 2026-03-20 Listed $174,990 Zillow
Cash-flow waterfall
monthlySold comps — $/sqft
last 12 mo · ≤1 miLoading sold comps…