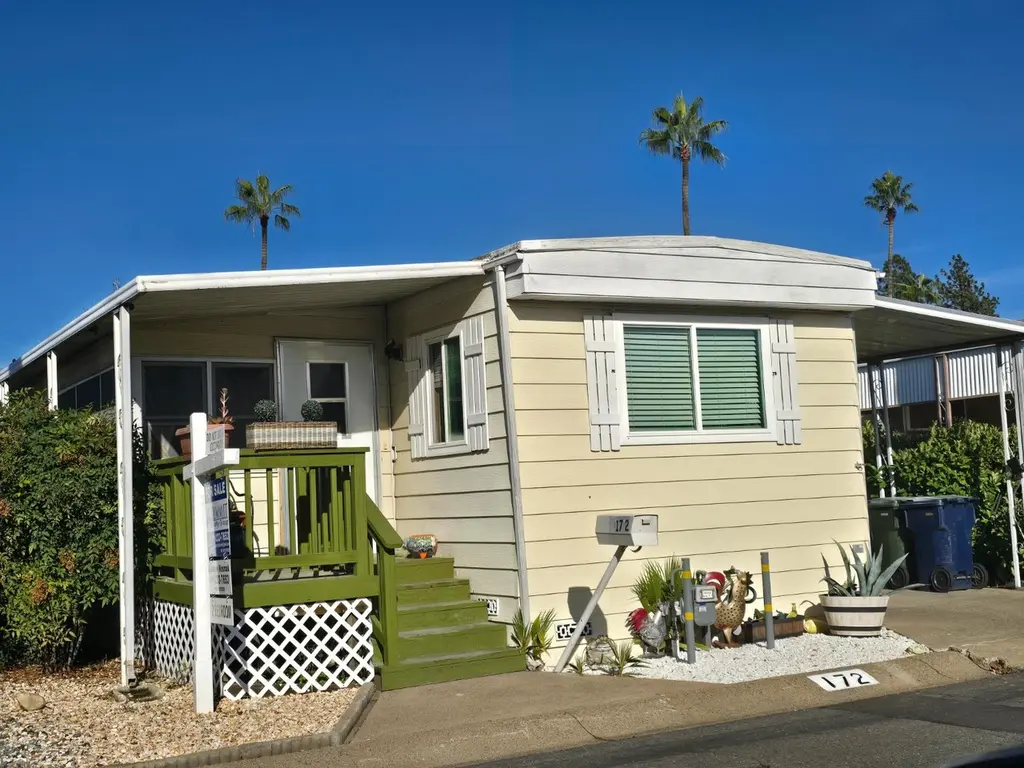
8181 Folsom Blvd #172 · Sacramento, CA
Flood risk 1/10 · Minimal
- FEMA flood zone
- X
- Chance of flooding over 30 yrs
- 0.0%
- Est. flood insurance / yr
- $507 – $1,088
Fire risk 2/10 · Minimal
- Est. fire insurance / yr
- $659 – $1,223
Heat risk 7/10 · Major
- Hot days now (above 102°F)
- 7 days/yr
- Hot days in 30 yrs
- 14 days/yr
Wind risk 1/10 · Minimal
- Chance of severe wind over 30 yrs
- —
Air-quality risk 10/10 · Severe
- Unhealthy air days now
- 28 days/yr
- Unhealthy air days in 30 yrs
- 33 days/yr
Risk factors via First Street. Map © Google.
Why this score? — see what drove the B- grade
The composite is a weighted blend of 9 inputs, each scored 0–100. Each bar is that input's sub-score; the figure is the points it added to the 100-point composite (weight × sub-score).
- Cash flow +30.0/30.0
- 1% rule +10.0/10.0
- DSCR +10.0/10.0
- ARV discount +6.9/15.0
- Livability +3.6/5.0
- Schools +3.5/10.0
- Condition / age +2.5/5.0
- Rent growth +2.4/5.0
- Appreciation +0.0/10.0
$67,900
🖨 Deal sheet 📄 Offer letter ✓ Due diligence
Listing remarks
Reduced to Sell Now! Affordable East Sacramento Cutie in Gated age55+ Park close to Everything. Vinyl Siding and Window Trim for EZ Maintenance, All Dual Pane Windows -1. Bright Open Living Room With Wood Wide Plank Floors, Large Eat-In Kitchen with Gas Stove. 2nd Bedroom w/ Closet, Rear Primary Bedroom has it's own Bath Access. Additional 20 x 8 Enclosed Patio Room-Large Rear Uncovered Private Patio retreat Surrounded by Greenery. Carport Parking for 2 cars. Park has Large Clubhouse w/ Activities. Huge Pool too.
Key facts
- Open living room
- Enclosed patio room
- Private patio
Tags
Neighborhood map
What this means for you Summary
Snapshot
- This is a 2-bed/1.0-bath manufactured listed at $68k.
Deal economics
- At list price, monthly cash flow is $994 ($12k/yr) — positive.
- The deal already cash-flows at list — no discount required.
- Meets the 1% rule at list price ($2k rent vs $68k).
- Recommended offer: $64k (6.0% below list) — sets the bar for market timing.
- Cap rate 23.9% vs local median 3.0% in Sacramento — top-decile yield for the area; either an underpriced asset or a hidden risk that comps aren't pricing in. Stress-test before assuming the spread holds.
Location & tenants
- Location reads 71/100 on livability (#218 in CA) — a middle-class / working-renter tenant base. Strengths: amenities A+, commute A+, housing A; Watch: schools D+, crime F, cost of living F.
- Sacramento City Unified (urban): math 32% / reading 43% proficiency, ranked #804 of 1,400 in CA (top 57%) — families likely to look elsewhere, expect single-tenant / working-renter base with shorter leases; 63% free/reduced lunch — lower-income household profile, screen leases tightly.
- Market conditions: Rents soft (-0.3%/yr); 123 active listings in the ZIP; 12 comparable units currently listed for rent nearby; rentals leasing fast (median 8d on market — plan ~1-2 weeks tenant-placement turnaround); solid renter incomes; 6,825 units permitted in Sacramento County in 2024 (1,752 in 5+ unit buildings).
Forward outlook
- Local home prices are declining (-3.0%/yr); year-one equity from $469 of loan paydown is wiped out by about $2k of value loss. Plan a longer hold.
- Sacramento County population projected at +17% by 2050 — long-run rental-demand tailwind backs the buy-and-hold thesis.
- At projected returns (-3.0% appreciation + 0.0% rent growth), your $19k cash investment doubles in ~2 years — after that, you're playing with house money.
Negotiation context
- It's been on market 74 days — a 6% lower offer ($64k) is reasonable based on typical stale-listing flexibility.
Risks & watch-outs
- Climate carrying-cost: extreme-heat days projected 7→14/yr by 2055 (HVAC capex compounding) — expect insurance premiums to compound above CPI over the hold.
Questions for the listing agent
- It's been on market 74 days. Have you received any prior offers? Is the seller open to a 6% concession, seller financing, or rate buy-down credit?
- Built in 1970 — when were the roof, HVAC, electrical panel, plumbing, and water heater last replaced?
- Why hasn't it sold? Are there any deal-killer items the seller is aware of (foundation, flood, title, zoning, code violations)?
- Is there a deadline driving the sale (1031 exchange, divorce, estate, relocation)? That informs how much negotiation room exists.
- Schools are D-rated, which usually means shorter tenancies and higher turnover. Who's the typical renter profile here, and what's been the actual vacancy rate?
- Crime grade is F in this area — have there been break-ins, vandalism, or insurance claims at this property in the last 3 years? What carrier currently insures it and at what premium?
- What's the average days-on-market for RENTAL listings here right now (not sales)? A rising rental-DOM trend means longer vacancies and softer asking-rent achievability than the comps imply.
- What's the recent tenant-quality profile in this submarket — average credit score on applications, eviction rate, late-payment / NSF rate, and stable-employment percentage? A property-management company in the area should have these aggregated.
- How much new for-sale + rental construction is in the pipeline within 1–3 miles? Heavy new supply typically softens prices + rents 12–24 months out; constrained supply supports both.
Investment metrics
- 1% rule
- 2.73% ✓
- Cap rate
- 23.86%
- Cash-on-cash
- 62.74%
- DSCR
- 3.79
- GRM
- 3.1
CMA / ARV
- ARV (median comp)
- $67,000
- List price
- $67,900
- Delta
- 1.34%
- Verdict
- FAIR
- Comps
- 3 within 1.0 mi
Show comp detail 4 sales within ~0.75 mi
| Address | Dist | Beds/Ba | Sqft | Sold | Price | $/sf | Match |
|---|---|---|---|---|---|---|---|
| 8181 Folsom Blvd #88 | 0.07mi | 2/1.0 | 800 (-6%) | 11mo | $79,000 | $99 | 78 |
| 8181 Folsom Blvd #106 | 0.09mi | 2/1.0 | 800 (-6%) | 11mo | $51,000 | $64 | 77 |
| 8181 Folsom Blvd #38 | 0.08mi | 2/1.0 | 784 (-8%) | 24mo | $67,000 | $85 | 64 |
| 8181 Folsom Blvd #67 | 0.22mi | 2/1.0 | 784 (-8%) | 23mo | $72,000 | $92 | 58 |
Match score weights: distance 35% · size 25% · config 20% · recency 20%. Top-matched comps best support the ARV.
Projected returns pro-forma
-3.0% appreciation · 0.0% rent growth · sell at horizon
- IRR
- 58.3%
- Equity multiple
- 3.47×
- Total profit
- $46,902
- Equity at exit
- $10,124
- IRR
- 62.0%
- Equity multiple
- 6.34×
- Total profit
- $101,493
- Equity at exit
- $5,871
Cash invested: $19,012 (down + closing). Projections, not guarantees.
Landlord ↔ Tenant lean methodology
- Overall (STATE)
- 18 Strongly Tenant-Friendly
- State California
- 18 Strongly Tenant-Friendly · D+13
- County
- — inherits STATE
- City
- — inherits STATE
ZIP-level market 95826
- Rents YoY
- -0.3%
- Active inventory
- 123
- Price-to-rent
- 3.1×
Monthly cashflow live
- Estimated rent
- $1,852 high interval (Pro) →
- Mortgage (P&I)
- −$356
- Tax est. 1.5%
- −$85 /mo · $1,018/yr
- Insurance
- −$28
- HOA
- −$0
- Vacancy / Maint / Mgmt
- −$389
- Net cashflow
- $994
Break-even live
UW: 25.0% down · 7.5% · 30yr · 1.5% tax · 5.0% vac · 8.0% maint · 8.0% mgmt
Financing live
Cash to close
- Down payment
- $16,975
- Closing costs
- $2,037
- Reserves months
- —
- Total cash needed
- —
Loan-product check · same deal, 3 products live
Conventional
25% down · 7.5% · 30yr
- Down + closing
- —
- Monthly P&I
- —
- Monthly cashflow
- —
- DSCR
- —
- Eligible?
- —
Personal DTI + credit; lowest rate.
DSCR
20% down · 8.5% · 30yr
- Down + closing
- —
- Monthly P&I
- —
- Monthly cashflow
- —
- DSCR
- —
- Eligible?
- —
No personal income docs; deal must DSCR.
Hard money
10% down · 12.0% · 12mo
- Down + closing
- —
- Monthly P&I
- —
- Monthly cashflow
- —
- DSCR
- —
- Eligible?
- —
Short-term bridge; refi at stabilization.
Rent comps 12 comps
| Address | Beds | Baths | Sqft | Rent | $/sqft | DOM | Units | Dist |
|---|---|---|---|---|---|---|---|---|
| 200 Bicentennial Cir Sacramento, CA | 1.0–3.0 | 1.0–2.0 | 937 | $2,174 | $2.32 | 3d | 31 | 0.39mi |
| 3099 Great Falls Way Sacramento, CA | 1.0 | 1.0 | 600 | $1,275 | $2.12 | 2d | 1 | 0.40mi |
| 3130 Occidental Dr Sacramento, CA | 1.0–2.0 | 1.0 | 717 | $1,635 | $2.28 | 2d | 12 | 0.52mi |
| 7928 La Riviera Dr Sacramento, CA | 1.0 | 1.0 | 704 | $1,675 | $2.38 | 4d | 3 | 0.62mi |
| 7901 La Riviera Dr Sacramento, CA | 1.0–3.0 | 1.0–2.0 | 881 | $1,962 | $2.23 | 2d | 8 | 0.87mi |
| 2920 Ramona Ave Sacramento, CA | 1.0–4.0 | 1.0–4.0 | 1000 | $2,505 | $2.50 | 8d | 1 | 0.95mi |
| 1255 University Ave Sacramento, CA | 2.0 | 2.0 | 890 | $1,315 | $1.48 | 24d | 1 | 1.13mi |
| 7008 Maita Cir Sacramento, CA | 2.0 | 1.0 | 790 | $1,975 | $2.50 | 44d | 1 | 1.23mi |
| 2366 American River Dr Sacramento, CA | 1.0–2.0 | 1.0 | 825 | $2,175 | $2.64 | 44d | 1 | 1.37mi |
| 4051 69th St Sacramento, CA | 2.0 | 1.0 | 850 | $2,100 | $2.47 | 44d | 1 | 1.40mi |
| 100 Hartnell Pl Sacramento, CA | 2.0 | 1.0 | 1072 | $2,250 | $2.10 | 8d | 1 | 1.41mi |
| 1500 67th St Sacramento, CA | 1.0–5.0 | 1.0–5.0 | 1035 | $1,169 | $1.13 | 2d | 60 | 1.44mi |
Climate risk First Street
- Flood 1/10 Low FEMA zone X · 0% chance over 30 yrs
- Wildfire 2/10 Low
- Heat 7/10 Severe 7 d/yr ≥102°F today · 14 d/yr by 30 yrs out
- Wind 1/10 Low
- Air quality 10/10 Extreme 28 unhealthy d/yr today · 33 by 30 yrs out
Nearby sold comps map
Loading sold comps map…
Walkable amenities ~0.75 mi
Loading nearby amenities…
Taxation est. · year 1
- Rental income
- $22,226
- − Mortgage interest
- −$3,803
- − Property taxes
- −$1,018
- − Insurance
- −$340
- − Repairs & maintenance
- −$1,778
- − Management
- −$1,778
- − Depreciation
- −$1,975
- Taxable income
- $11,533
- Est. tax owed @ 24.0%
- −$2,768
- After-tax cash flow
- $9,159/yr
For passive investors: Depreciation is non-cash, so a rental often shows a tax loss while cash-flowing — sheltering income. Rental losses are passive: they offset passive income freely, and up to $25,000/yr can offset ordinary (W-2) income if you actively participate and your MAGI is under $100k (phasing out to $0 by $150k); unused losses carry forward. On sale, claimed depreciation is recaptured at up to 25%, and gains may owe capital-gains tax (a 1031 exchange can defer both). Figures are a year-1 estimate at your 24.0% rate — not tax advice; consult a CPA.
Schools (NCES district)
- District
- Sacramento City Unified
- NCES district ID
- 0633840
- Math proficiency
- 32% ▬ 0.00%
- Reading proficiency
- 43% ▲ 3.00%
- Median HH income
- $49,280
- Composite
- 34.86/100
- National rank
- #10000
- State rank
- #804 of 1400 in CA
Livability — Sacramento
- Score
- 71/100
- State rank
- #218
- US rank
- #6957
Category grades
Schools grade is shown separately in the Schools card above.
Census & demographics
- Census place
- Sacramento, CA
- County
- Sacramento County · 1,539,646 people
- City population
- 761,410
- Metro
- Sacramento-Roseville-Folsom, CA
- Population (ZIP)
- 40,165
- Household income
- $82,127
- Rent vs Own
- Severe rent burden
- 2433.0
Population outlook (Sacramento County) Hauer SSP2
- Today (2025)
- 1,660,763 people
- By 2030
- 1,732,990 · +4.3%
- By 2040
- 1,855,755 · +11.7%
- By 2050
- 1,941,335 · +16.9%
- By 2075
- 2,046,162 · +23.2%
- By 2100
- 1,961,444 · +18.1%
Race, ethnicity, and origin ACS 2023
- Neighborhood character
- Highly diverse neighborhood (Simpson 0.70)
- Race & ethnicity
- White 47% Hispanic / Latino 23% Two or more races 14% Black 11% Asian 11%
- Hispanic origin (detail)
- Mexican 18%
- Common ancestry
- Italian 3% Subsaharan African 2% Russian 2%
- Foreign-born
- 15% · Canada, South Korea, China
- Languages at home
- 75% English-only · Spanish 11% Other Indo-European 4% Russian/Polish/Slavic 2%
Political lean MEDSL · Sacramento
- 2024 margin
- D (+19.7) · D 58.1% · R 38.4% · Other 3.5%
- 2008→2024 swing
- +0.7pp no change · 2008: 19.0pp · 2024: 19.7pp
- All cycles
- 2024: D+19.7 2020: D+25.3 2016: D+23.7 2012: D+16.3 2008: D+19.0
Not yet ingested
- Civics
- —
Market trends
- HPI YoY
- ▼ -408.80%
- Current HPI
- 325.179
- Rent YoY
- ▼ -0.33%
- Metro
- Sacramento-Roseville-Folsom, CA
- State GDP YoY
- ▲ 3.21%
- F500 in state
- 116
Industry mix (Fortune 500 HQ in CA)
| Industry | F500 HQs | Revenue |
|---|---|---|
| Technology | 27 | $1,492B |
|
||
| Financial Services | 3 | $174B |
|
||
| Retail | 3 | $44B |
|
||
| Insurance | 3 | $26B |
|
||
| Media / Entertainment | 2 | $115B |
|
||
| Pharmaceuticals / Biotech | 2 | $62B |
|
||
Property tax history
+13.4%/yrLatest (2025): $131 · -2.8% YoY. Source: county tax records.
Cash-flow waterfall
monthlySold comps — $/sqft
last 12 mo · ≤1 miLoading sold comps…