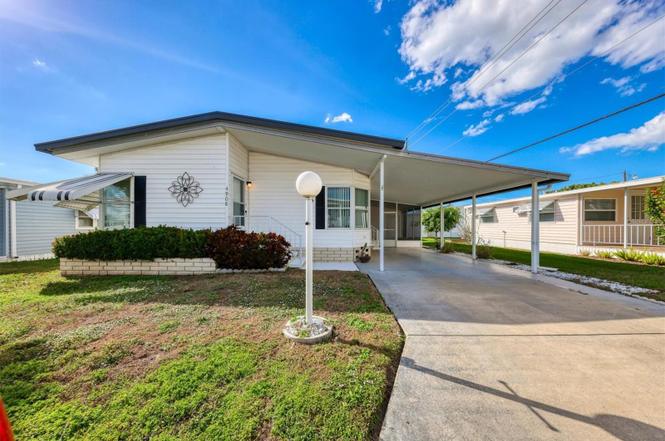
4908 6th B St E · South Bradenton, FL
Flood risk 1/10 · Minimal
- FEMA flood zone
- X (unshaded)
- Chance of flooding over 30 yrs
- 0.0%
- Est. flood insurance / yr
- $507 – $1,088
Fire risk 1/10 · Minimal
- Est. fire insurance / yr
- $947 – $1,759
Heat risk 10/10 · Severe
- Hot days now (above 107°F)
- 6 days/yr
- Hot days in 30 yrs
- 23 days/yr
Wind risk 10/10 · Severe
- Chance of severe wind over 30 yrs
- 99.0%
Air-quality risk 3/10 · Minor
- Unhealthy air days now
- 2 days/yr
- Unhealthy air days in 30 yrs
- 2 days/yr
Risk factors via First Street. Map © Google.
Why this score? — see what drove the C- grade
The composite is a weighted blend of 9 inputs, each scored 0–100. Each bar is that input's sub-score; the figure is the points it added to the 100-point composite (weight × sub-score).
- Cash flow +18.8/30.0
- ARV discount +7.5/15.0
- 1% rule +6.9/10.0
- DSCR +5.9/10.0
- Schools +4.4/10.0
- Livability +3.9/5.0
- Condition / age +2.5/5.0
- Rent growth +2.3/5.0
- Appreciation +0.0/10.0
$149,900
🖨 Deal sheet 📄 Offer letter ✓ Due diligence
Listing remarks
Under contract-accepting backup offers. Charming 2-Bedroom, 2-Bath Mobile Home in Gulf Lake Residence Co-op. Discover this move-in-ready oasis in the 55 and over Gulf Lake Residence Co-op in West Bradenton! This well-kept two-bedroom, two-bath home offers comfort and convenience, nestled in a vibrant, pet-free community. Enjoy fantastic amenities such as a sparkling pool, tennis courts, and shuffleboard. Plus, you’re just minutes away from beautiful beaches, parks, and shopping destinations. Don’t miss this wonderful opportunity to join a welcoming community!
Key facts
- Minutes from beaches
- Move-in-ready
- Tennis courts
Tags
Property features AI
Finance
- Other: Furnished; Lease restrictions apply
- Financial info: Monthly HOA approx. $311.67 (total monthly fees shown); Total annual fees listed
- HOA & community: Has HOA; buyer approval required; Quarterly association fee; HOA includes cable TV, pool, escrow reserves fund, internet, grounds maintenance, management, sewer, trash, and water; Community features: clubhouse, fitness center, golf carts allowed, pool, tennis courts; Senior community; Pets not allowed; Association approval required
Exterior
- Parking: Carport with 1 space
- Utilities: Public water; Public sewer; Cable available
- Home design: Manufactured double-wide home; Single-story (one level); Northwest facing
- Construction: Vinyl siding and frame construction; Membrane roof; Pillar/post/pier foundation; Built as a double wide manufactured home
- Exterior features: Awnings
Interior
- Kitchen: Dishwasher; Disposal; Microwave; Range; Refrigerator
- Bedrooms: 2 bedrooms
- Flooring: Carpet; Laminate; Linoleum
- Bathrooms: 2 full bathrooms
- Heating & cooling: Electric heating; Central air conditioning
- Interior features: Ceiling fans; Thermostat; Window treatments; 5 total rooms
- Laundry & utility: Laundry closet; Washer
Neighborhood map
What this means for you Summary
Snapshot
- This is a 2-bed/2.0-bath manufactured listed at $150k.
Deal economics
- At list price, monthly cash flow is $152 ($2k/yr) — positive.
- The deal already cash-flows at list — no discount required.
- Meets the 1% rule at list price ($2k rent vs $150k).
- Recommended offer: $132k (12.0% below list) — sets the bar for market timing.
- Cap rate 7.5% vs local median 4.1% in South Bradenton — top-decile yield for the area; either an underpriced asset or a hidden risk that comps aren't pricing in. Stress-test before assuming the spread holds.
Location & tenants
- Location reads 77/100 on livability (#195 in FL, #3,092 nationally) — a middle-class / working-renter tenant base. Strengths: cost of living A+, housing A+, health & safety A+; Watch: amenities C-, crime D+, commute F.
- Manatee (suburban): math 54% / reading 50% proficiency, ranked #26 of 73 in FL (top 36%) — acceptable for families but not a draw, mixed tenant base, ~2y average lease.
- Market conditions: Rents soft (-1.0%/yr); 384 active listings in the ZIP; 40 comparable units currently listed for rent nearby; rentals at typical pace (median 16d on market — plan ~3-4 weeks tenant-placement turnaround); 7,472 units permitted in Manatee County in 2024 (1,782 in 5+ unit buildings).
- This rent runs 30% of the median local income ($71k/yr) — at the standard rent-burdened threshold; future hikes will face affordability resistance.
Forward outlook
- Local home prices are declining (-3.0%/yr); year-one equity from $1k of loan paydown is wiped out by about $4k of value loss. Plan a longer hold.
- Manatee County population projected at +43% by 2050 — long-run rental-demand tailwind backs the buy-and-hold thesis.
Negotiation context
- It's been on market 125 days — a 12% lower offer ($132k) is reasonable based on typical stale-listing flexibility.
- Current owner paid $100k; 50% above their basis — modest negotiation headroom, anchor on the comps not their cost.
Risks & watch-outs
- Climate carrying-cost: severe wind risk, 99% chance of damaging wind over 30y; extreme-heat days projected 6→23/yr by 2055 (HVAC capex compounding) — expect insurance premiums to compound above CPI over the hold.
Questions for the listing agent
- It's been on market 125 days. Have you received any prior offers? Is the seller open to a 12% concession, seller financing, or rate buy-down credit?
- What does the HOA fee cover, when was the last increase, and are there any pending special assessments or reserve-fund shortfalls?
- Why hasn't it sold? Are there any deal-killer items the seller is aware of (foundation, flood, title, zoning, code violations)?
- Is there a deadline driving the sale (1031 exchange, divorce, estate, relocation)? That informs how much negotiation room exists.
- Schools are B-rated — typically a magnet for longer-tenancy family renters. What's the average tenant stay here, and is there a school-zone premium baked into asking?
- Crime grade is D in this area — have there been break-ins, vandalism, or insurance claims at this property in the last 3 years? What carrier currently insures it and at what premium?
- What's the average days-on-market for RENTAL listings here right now (not sales)? A rising rental-DOM trend means longer vacancies and softer asking-rent achievability than the comps imply.
- What's the recent tenant-quality profile in this submarket — average credit score on applications, eviction rate, late-payment / NSF rate, and stable-employment percentage? A property-management company in the area should have these aggregated.
- How much new for-sale + rental construction is in the pipeline within 1–3 miles? Heavy new supply typically softens prices + rents 12–24 months out; constrained supply supports both.
Investment metrics
- 1% rule
- 1.19% ✓
- Cap rate
- 7.51%
- Cash-on-cash
- 4.35%
- DSCR
- 1.19
- GRM
- 7.0
CMA / ARV
- ARV (on-the-fly)
- $150,059
- Comps found
- 12
Show comp detail 12 sales within ~0.75 mi
| Address | Dist | Beds/Ba | Sqft | Sold | Price | $/sf | Match |
|---|---|---|---|---|---|---|---|
| 4908 6th B St E | 0.00mi | 2/2.0 | 1,261 (0%) | 0mo | $130,000 | $103 | 100 |
| 4904 4th C St E | 0.10mi | 2/2.0 | 1,414 (+12%) | 4mo | $195,000 | $138 | 72 |
| 808 53rd Ave E #75 | 0.59mi | 2/2.0 | 1,266 (+0%) | 2mo | $149,000 | $118 | 70 |
| 209 E 52nd Avenue Plz E | 0.44mi | 2/2.0 | 1,152 (-9%) | 1mo | $165,500 | $144 | 64 |
| 5003 4th St W | 0.57mi | 2/2.0 | 1,320 (+5%) | 3mo | $120,000 | $91 | 63 |
| 808 53rd Ave E Unit 142K | 0.52mi | 2/2.0 | 1,344 (+7%) | 5mo | $160,000 | $119 | 61 |
| 205 52nd Avenue Ter E | 0.48mi | 2/2.0 | 1,124 (-11%) | 1mo | $180,000 | $160 | 59 |
| 306 49th Ave W | 0.48mi | 2/2.0 | 1,130 (-10%) | 3mo | $120,000 | $106 | 58 |
| 808 53rd Ave E #108 | 0.52mi | 2/2.0 | 1,152 (-9%) | 4mo | $135,000 | $117 | 58 |
| 808 53rd Ave E Unit 184J | 0.72mi | 2/2.0 | 1,324 (+5%) | 3mo | $110,000 | $83 | 56 |
| 4809 4th St W | 0.57mi | 2/2.0 | 1,104 (-12%) | 2mo | $132,500 | $120 | 51 |
| 808 53rd Ave E #117 | 0.74mi | 2/2.0 | 1,440 (+14%) | 1mo | $190,000 | $132 | 41 |
Match score weights: distance 35% · size 25% · config 20% · recency 20%. Top-matched comps best support the ARV.
Projected returns pro-forma
-3.0% appreciation · 0.0% rent growth · sell at horizon
- IRR
- -13.5%
- Equity multiple
- 0.53×
- Total profit
- $-19,667
- Equity at exit
- $22,351
- IRR
- -11.5%
- Equity multiple
- 0.42×
- Total profit
- $-24,177
- Equity at exit
- $12,961
Cash invested: $41,972 (down + closing). Projections, not guarantees.
Landlord ↔ Tenant lean methodology
- Overall (STATE)
- 87 Strongly Landlord-Friendly
- State Florida
- 87 Strongly Landlord-Friendly · R+3
- County
- — inherits STATE
- City
- — inherits STATE
ZIP-level market 34203
- Home prices YoY
- -24.5%
- Rents YoY
- -1.0%
- Active inventory
- 384
- Price-to-rent
- 7.0×
Monthly cashflow live
- Estimated rent
- $1,781 high interval (Pro) →
- Mortgage (P&I)
- −$786
- Tax from tax record
- −$96 /mo · $1,149/yr
- Insurance
- −$62
- HOA
- −$311
- Vacancy / Maint / Mgmt
- −$374
- Net cashflow
- $152
Break-even live
UW: 25.0% down · 7.5% · 30yr · 1.5% tax · 5.0% vac · 8.0% maint · 8.0% mgmt
Financing live
Cash to close
- Down payment
- $37,475
- Closing costs
- $4,497
- Reserves months
- —
- Total cash needed
- —
Loan-product check · same deal, 3 products live
Conventional
25% down · 7.5% · 30yr
- Down + closing
- —
- Monthly P&I
- —
- Monthly cashflow
- —
- DSCR
- —
- Eligible?
- —
Personal DTI + credit; lowest rate.
DSCR
20% down · 8.5% · 30yr
- Down + closing
- —
- Monthly P&I
- —
- Monthly cashflow
- —
- DSCR
- —
- Eligible?
- —
No personal income docs; deal must DSCR.
Hard money
10% down · 12.0% · 12mo
- Down + closing
- —
- Monthly P&I
- —
- Monthly cashflow
- —
- DSCR
- —
- Eligible?
- —
Short-term bridge; refi at stabilization.
Rent comps 40 comps
| Address | Beds | Baths | Sqft | Rent | $/sqft | DOM | Units | Dist |
|---|---|---|---|---|---|---|---|---|
| 202 46th Avenue Ter W #409 Bradenton, FL | 2.0 | 2.0 | 1086 | $1,995 | $1.84 | 23d | 1 | 0.50mi |
| 203 46th Avenue Ter W Bradenton, FL | 1.0 | 1.0 | 880 | $1,099 | $1.25 | 3d | 1 | 0.50mi |
| 503 51st Ave W Unit 503 Bradenton, FL | 3.0 | 2.0 | 882 | $1,275 | $1.45 | 23d | 1 | 0.59mi |
| 503 51st Ave W Bradenton, FL | 3.0 | 2.0 | 882 | $1,075 | $1.22 | 11d | 1 | 0.59mi |
| 5323 11th Street Cir E Bradenton, FL | 2.0 | 2.0 | 1303 | $1,900 | $1.46 | 23d | 1 | 0.60mi |
| 723 44th Ave E Unit 5 Bradenton, FL | 2.0 | 1.5 | 1350 | $1,650 | $1.22 | 15d | 1 | 0.62mi |
| 1345 301 Blvd E Bradenton, FL | 1.0–3.0 | 1.0–2.0 | 872 | $1,320 | $1.51 | 23d | 9 | 0.64mi |
| 4630 5th St W Ste 6 Bradenton, FL | 2.0 | 1.0 | 1000 | $1,600 | $1.60 | 11d | 1 | 0.64mi |
| 1167 42nd Ter E Bradenton, FL | 3.0 | 2.0 | 1274 | $2,025 | $1.59 | 19d | 1 | 0.81mi |
| 907 Fruitland Ave Bradenton, FL | 3.0 | 2.0 | 1677 | $2,450 | $1.46 | 23d | 1 | 0.82mi |
| 808 53rd Ave E #203 Bradenton, FL | 2.0 | 2.0 | 1208 | $1,450 | $1.20 | 15d | 1 | 0.88mi |
| 5613 8th St Ct E Bradenton, FL | 3.0 | 2.0 | 1000 | $1,700 | $1.70 | 23d | 1 | 0.89mi |
| 716 56th Avenue Dr E Bradenton, FL | 3.0 | 2.0 | 1000 | $1,700 | $1.70 | 3d | 1 | 0.94mi |
| 409 57th Avenue Dr E Bradenton, FL | 2.0 | 1.5 | 1209 | $1,375 | $1.14 | 10d | 1 | 0.96mi |
| 304 57th Avenue Dr E Bradenton, FL | 2.0 | 1.5 | 1209 | $1,445 | $1.20 | 23d | 3 | 1.00mi |
| 304 57th Avenue Dr E Bradenton, FL | 2.0 | 1.5 | 1209 | $1,362 | $1.13 | 3d | 5 | 1.00mi |
| 5502 8th Street Ct W Bradenton, FL | 2.0 | 2.0 | 896 | $1,595 | $1.78 | 23d | 1 | 1.01mi |
| 408 57th Avenue Dr E Unit A Bradenton, FL | 2.0 | 1.5 | 1209 | $1,350 | $1.12 | 10d | 1 | 1.01mi |
| 408 57th Avenue Dr E Apt E Bradenton, FL | 2.0 | 1.5 | 1209 | $1,375 | $1.14 | 11d | 1 | 1.01mi |
| 312 57th Avenue Dr E Unit B Bradenton, FL | 2.0 | 1.5 | 1209 | $1,350 | $1.12 | 2d | 1 | 1.01mi |
| 308 57th Avenue Dr E Unit B Bradenton, FL | 2.0 | 1.5 | 1209 | $1,350 | $1.12 | 3d | 1 | 1.02mi |
| 350 34th Avenue Dr E Bradenton, FL | 1.0–3.0 | 1.0–2.0 | 893 | $1,335 | $1.49 | 1d | 6 | 1.02mi |
| 5580 Fountain Lake Cir Bradenton, FL | 1.0–3.0 | 1.0–2.0 | 1052 | $1,908 | $1.81 | 1d | 38 | 1.04mi |
| 1011 57th Avenue Ter E Bradenton, FL | 3.0 | 3.0 | 1872 | $2,195 | $1.17 | 11d | 1 | 1.06mi |
| 5828 3rd St E Bradenton, FL | 3.0 | 2.0 | 1036 | $1,995 | $1.93 | 23d | 1 | 1.13mi |
| 5719 14th St E Bradenton, FL | 1.0 | 1.0 | 978 | $1,425 | $1.46 | 2d | 1 | 1.18mi |
| 390 301 Blvd W Bradenton, FL | 2.0 | 2.0 | 1125 | $1,495 | $1.33 | 23d | 1 | 1.28mi |
| 1007 57th Ave W Bradenton, FL | 2.0 | 1.5 | 967 | $1,495 | $1.55 | 10d | 1 | 1.28mi |
| 2129 49th Ave E Bradenton, FL | 3.0 | 2.0 | 1370 | $2,245 | $1.64 | 2d | 1 | 1.31mi |
| 1109 59th Avenue Cir E Unit 1109 Bradenton, FL | 3.0 | 2.0 | 945 | $1,795 | $1.90 | 23d | 1 | 1.33mi |
| 4916 18th St W Unit B Bradenton, FL | 2.0 | 2.0 | 1170 | $1,650 | $1.41 | 23d | 1 | 1.37mi |
| 505 30th Ave W Unit E406 Bradenton, FL | 2.0 | 2.0 | 1001 | $1,450 | $1.45 | 23d | 1 | 1.39mi |
| 305 30th Ave W Bradenton, FL | 1.0–2.0 | 1.5–2.0 | 987 | $1,400 | $1.42 | 23d | 2 | 1.40mi |
| 305 30th Ave W Unit A207 Bradenton, FL | 2.0 | 2.0 | 1050 | $1,400 | $1.33 | 14d | 1 | 1.40mi |
| 425 30th Ave W Unit C308 Bradenton, FL | 2.0 | 2.0 | 924 | $1,590 | $1.72 | 23d | 1 | 1.41mi |
| 907 34th Ave W Bradenton, FL | 3.0 | 1.0 | 985 | $1,599 | $1.62 | 19d | 1 | 1.41mi |
| 907 34th Ave W Unit B Bradenton, FL | 3.0 | 1.0 | 1000 | $1,795 | $1.79 | 23d | 1 | 1.41mi |
| 515 30th Ave W Bradenton, FL | 2.0 | 2.0 | 1001 | $1,375 | $1.37 | 15d | 2 | 1.43mi |
| 919 34th Ave W Bradenton, FL | 3.0 | 1.0 | 950 | $1,599 | $1.68 | 11d | 1 | 1.43mi |
| 2004 49th Ave W Unit 2002 Bradenton, FL | 2.0 | 2.0 | 1021 | $1,950 | $1.91 | 23d | 1 | 1.50mi |
HOA detail
- Monthly dues
- $311 · $3,732/yr
- Likely covers
- pool
Listing history 8 events
-
2026-05-23status Pending
-
2026-03-24price $149,900
-
2026-02-13price $174,900
-
2026-01-17$178,900 Active
-
2015-04-20soldstatus $100,000
-
1997-03-05soldstatus $69,000
-
1991-05-17soldstatus $20,000
-
1987-03-30soldstatus $14,000,000
ⓘ Source: listings_history table (triggers on properties + properties_extension) + one-shot
backfill from property_details.listing_events for pre-trigger history.
Tax reassessment forecast FL · Resets to sale price
- Current annual tax
- $1,149 · $96/mo
- Projected year-2 tax
- $1,244 · $104/mo
- Expected delta
- +$95/yr (+$8/mo · 8.3%)
ⓘ Screening estimate from a state-policy table — verify with the county assessor before closing.
Climate risk First Street
- Flood 1/10 Low FEMA zone X (unshaded) · 0% chance over 30 yrs
- Wildfire 1/10 Low
- Heat 10/10 Extreme 6 d/yr ≥107°F today · 23 d/yr by 30 yrs out
- Wind 10/10 Extreme 99% chance of damaging wind over 30 yrs
- Air quality 3/10 Moderate 2 unhealthy d/yr today · 2 by 30 yrs out
Nearby sold comps map
Loading sold comps map…
Walkable amenities ~0.75 mi
Loading nearby amenities…
Taxation est. · year 1
- Rental income
- $21,377
- − Mortgage interest
- −$8,397
- − Property taxes
- −$1,149
- − Insurance
- −$750
- − Repairs & maintenance
- −$1,710
- − Management
- −$1,710
- − HOA
- −$3,732
- − Depreciation
- −$4,361
- Taxable loss
- −$431
- Est. tax savings @ 24.0%
- +$103
- After-tax cash flow
- $1,928/yr
For passive investors: Depreciation is non-cash, so a rental often shows a tax loss while cash-flowing — sheltering income. Rental losses are passive: they offset passive income freely, and up to $25,000/yr can offset ordinary (W-2) income if you actively participate and your MAGI is under $100k (phasing out to $0 by $150k); unused losses carry forward. On sale, claimed depreciation is recaptured at up to 25%, and gains may owe capital-gains tax (a 1031 exchange can defer both). Figures are a year-1 estimate at your 24.0% rate — not tax advice; consult a CPA.
Schools (NCES district)
- District
- Manatee
- NCES district ID
- 1201230
- Math proficiency
- 54% ▼ -6.00%
- Reading proficiency
- 50% ▼ -2.00%
- Median HH income
- $49,607
- Composite
- 44.43/100
- National rank
- #2806
- State rank
- #26 of 73 in FL
Livability — South Bradenton
- Score
- 77/100
- State rank
- #195
- US rank
- #3092
Category grades
Schools grade is shown separately in the Schools card above.
Census & demographics
- County
- Manatee County · 416,364 people
- Metro
- North Port-Sarasota-Bradenton, FL
- Population (ZIP)
- 40,618
- Household income
- $70,761
- Rent vs Own
- Severe rent burden
- 1469.0
Population outlook (Manatee County) Hauer SSP2
- Today (2025)
- 447,342 people
- By 2030
- 488,911 · +9.3%
- By 2040
- 567,934 · +27.0%
- By 2050
- 637,995 · +42.6%
- By 2075
- 781,970 · +74.8%
- By 2100
- 848,272 · +89.6%
Race, ethnicity, and origin ACS 2023
- Neighborhood character
- Predominantly White (65%)
- Race & ethnicity
- White 65% Hispanic / Latino 19% Two or more races 12% Black 9% Asian 5%
- Hispanic origin (detail)
- Mexican 9% Puerto Rican 3% Cuban 2% Dominican 1%
- Common ancestry
- Lithuanian 3% Romanian 3% Slovak 2%
- Foreign-born
- 17% · Canada, Vietnam, Dominican Republic
- Languages at home
- 76% English-only · Spanish 16% Vietnamese 2% Other Indo-European 1%
Political lean MEDSL · Manatee
- 2024 margin
- Strong R (+23.5) · D 37.9% · R 61.4%
- 2008→2024 swing
- -16.5pp toward R · 2008: -7.0pp · 2024: -23.5pp
- All cycles
- 2024: R+23.5 2020: R+16.1 2016: R+17.1 2012: R+12.5 2008: R+7.0
Not yet ingested
- Civics
- —
Market trends
- HPI YoY
- ▼ -95.87%
- Current HPI
- 295.8871
- Rent YoY
- ▼ -0.97%
- Metro
- North Port-Sarasota-Bradenton, FL
- State GDP YoY
- ▲ 3.28%
- F500 in state
- 36
Industry mix (Fortune 500 HQ in FL)
| Industry | F500 HQs | Revenue |
|---|---|---|
| Industrial Technology | 2 | $29B |
|
||
| Insurance | 2 | $17B |
|
||
| Retail | 1 | $60B |
|
||
| Technology Distribution | 1 | $58B |
|
||
| Homebuilding | 1 | $35B |
|
||
| Technology Manufacturing | 1 | $35B |
|
||
Price history
-98.9% since first listed8 events — show timeline
- 2026-05-23 Pending — Stellar MLS as Distributed by MLS Grid
- 2026-03-24 Price Changed $149,900 Stellar MLS as Distributed by MLS Grid
- 2026-02-13 Price Changed $174,900 Stellar MLS as Distributed by MLS Grid
- 2026-01-17 Listed $178,900 Stellar MLS as Distributed by MLS Grid
- 2015-04-20 Sold (Public Records) $100,000 Public Records
- 1997-03-05 Sold (Public Records) $69,000 Public Records
- 1991-05-17 Sold (Public Records) $20,000 Public Records
- 1987-03-30 Sold (Public Records) $14,000,000 Public Records
Property tax history
-0.6%/yrLatest (2025): $1,149 · +4.7% YoY. Source: county tax records.
Cash-flow waterfall
monthlySold comps — $/sqft
last 12 mo · ≤1 miLoading sold comps…