 Duplex
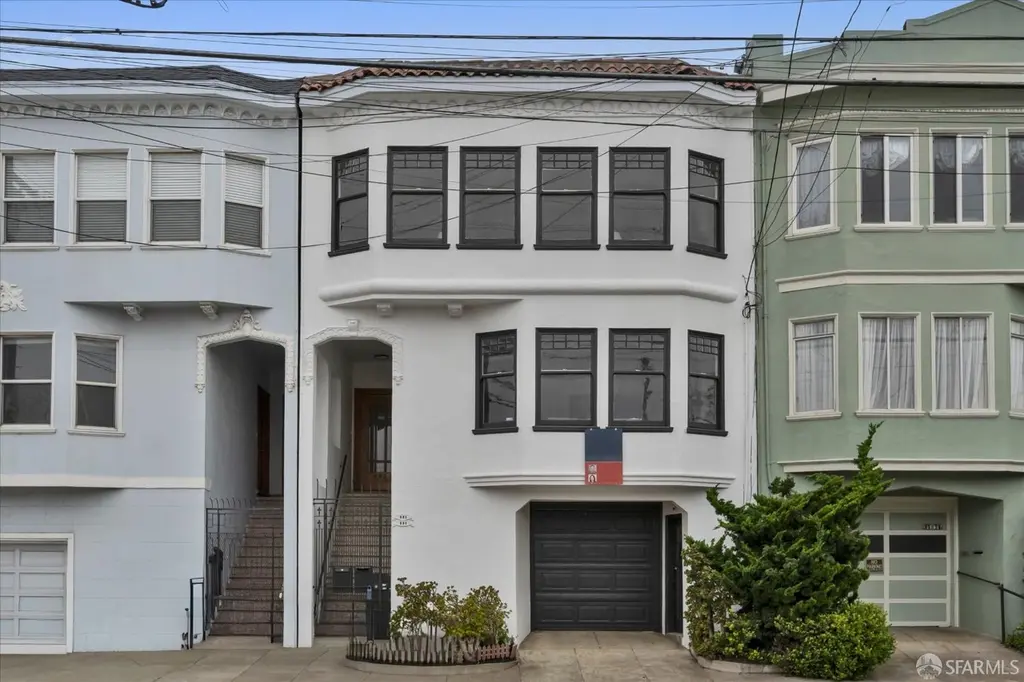
691-693 28th Ave · San Francisco, CA
Flood risk 1/10 · Minimal
- FEMA flood zone
- X (unshaded)
- Chance of flooding over 30 yrs
- 0.0%
- Est. flood insurance / yr
- $507 – $1,088
Fire risk 4/10 · Minor
- Est. fire insurance / yr
- $659 – $1,223
Heat risk 2/10 · Minimal
- Hot days now (above 77°F)
- 7 days/yr
- Hot days in 30 yrs
- 16 days/yr
Wind risk 1/10 · Minimal
- Chance of severe wind over 30 yrs
- —
Air-quality risk 7/10 · Major
- Unhealthy air days now
- 13 days/yr
- Unhealthy air days in 30 yrs
- 13 days/yr
Risk factors via First Street. Map © Google.
Why this score? — see what drove the C- grade
The composite is a weighted blend of 9 inputs, each scored 0–100. Each bar is that input's sub-score; the figure is the points it added to the 100-point composite (weight × sub-score).
- ARV discount +15.0/15.0
- Cash flow +14.2/30.0
- Rent growth +5.0/5.0
- Schools +5.0/10.0
- DSCR +4.3/10.0
- Livability +3.8/5.0
- 1% rule +3.0/10.0
- Condition / age +2.5/5.0
- Appreciation +0.0/10.0
$1,295,000
🖨 Deal sheet (PDF) 📄 Offer letter ✓ Due diligence
Multi-family units
County records classify this as Multi-Family (2-4 Unit). Listing-text estimate: 2 units. confirmed
Listing remarks
Rare vacant duplex opportunity in the desirable Central Richmond district, offering exceptional flexibility for owner-occupants, multigenerational living, or investment potential. Both flats are vacant and move-in ready, featuring very similar floor plans and spacious layouts filled with natural light. Each unit offer an east-facing living room with partial views of downtown SF from the top unit, a formal dining room ideal for entertaining, an updated kitchen with eat-in area, two comfortable bedrooms, and a full bath. Each unit has its in-unit washer & dryer. Original hardwood floors throughout the property have been newly refinished, complementing the fresh interior and exterior pai
Key facts
- Formal dining room
- In unit washer dryer
- Expansive garage
Tags
Property features AI
Finance
- Financial info: Two-unit building with both units currently vacant
- HOA & community: No association fee
Exterior
- Parking: Tandem garage; 2 covered parking spaces (2 total)
- Security: Carbon monoxide detectors; Smoke detectors; Security gate
- Utilities: Gas on separate meter; Electricity on separate meter; Public water; Public sewer
- Home design: Residential income duplex; Marina-style architecture; Three or more levels; Built in 1924; Asphalt roof
- Construction: Built in 1924
- Exterior features: Landscaped lot
Interior
- Kitchen: Dishwasher; Free‑standing gas oven; Free‑standing gas range; Free‑standing refrigerator
- Bedrooms: 4 bedrooms total; Unit 1 (top floor) — 693; Unit 2 (mid floor) — 691
- Flooring: Tile; Wood
- Bathrooms: 2 full bathrooms
- Heating & cooling: Central heating
- Interior features: Central heating; Full basement; Dual-pane partial windows
- Laundry & utility: Washer and dryer in unit
Neighborhood map
What this means for you Summary
Snapshot
- This is a 2 × 2-bed/1.0-bath units multifamily listed at $1.29M.
Deal economics
- At list price, monthly cash flow is $214 ($3k/yr) — positive. Per door: $107/mo.
- The deal already cash-flows at list — no discount required.
- To meet the 1% rule (rent ≥ 1% of price), the offer needs to be $1.04M (19.9% below list).
- Recommended offer: $1.04M (19.9% below list) — sets the bar for 1% rule.
- Cap rate 6.5% vs local median 2.1% in San Francisco — top-decile yield for the area; either an underpriced asset or a hidden risk that comps aren't pricing in. Stress-test before assuming the spread holds.
Location & tenants
- Location reads 76/100 on livability (#90 in CA, #3,143 nationally) — a middle-class / working-renter tenant base. Strengths: amenities A+, commute A+, employment A+; Watch: crime F, cost of living F.
- San Francisco Unified (urban): math 50% / reading 56% proficiency, ranked #322 of 1,400 in CA (top 23%) — acceptable for families but not a draw, mixed tenant base, ~2y average lease.
- Market conditions: Rents rising fast (+13.0%/yr); 74 active listings in the ZIP; 4 comparable units currently listed for rent nearby; rentals leasing fast (median 4d on market — plan ~1-2 weeks tenant-placement turnaround); high-income renter base; 750 units permitted in San Francisco County in 2024 (688 in 5+ unit buildings).
- At $10,379/mo this rent would consume 93% of the median local household income ($133k/yr) (locally 2072% of renters already pay >50% of income on rent) — very limited rent-growth headroom before tenants either downsize or default.
Forward outlook
- Local home prices are declining (-3.0%/yr); year-one equity from $9k of loan paydown is wiped out by about $39k of value loss. Plan a longer hold.
- San Francisco County population projected at +39% by 2050 — long-run rental-demand tailwind backs the buy-and-hold thesis.
Negotiation context
- Only 8 days on market — expect competitive offers; lowballing is unlikely to land.
Risks & watch-outs
- Watch-outs: built in 1924 — expect roof / HVAC / electrical / plumbing capex.
Questions for the listing agent
- Can we see the unit-by-unit rent roll, current vacancy, and any below-market leases? What's the average tenancy length?
- What capital expenditures (roof, boiler, parking lot, exteriors) have been made in the last 5 years, and what's planned in the next 2?
- Built in 1924 — when were the roof, HVAC, electrical panel, plumbing, and water heater last replaced?
- Is there a deadline driving the sale (1031 exchange, divorce, estate, relocation)? That informs how much negotiation room exists.
- Schools are B-rated — typically a magnet for longer-tenancy family renters. What's the average tenant stay here, and is there a school-zone premium baked into asking?
- Crime grade is F in this area — have there been break-ins, vandalism, or insurance claims at this property in the last 3 years? What carrier currently insures it and at what premium?
- What's the average days-on-market for RENTAL listings here right now (not sales)? A rising rental-DOM trend means longer vacancies and softer asking-rent achievability than the comps imply.
- What's the recent tenant-quality profile in this submarket — average credit score on applications, eviction rate, late-payment / NSF rate, and stable-employment percentage? A property-management company in the area should have these aggregated.
- How much new apartment / multifamily construction is in the pipeline within 1–3 miles? Heavy new supply (>2% of stock underway) typically softens rents 12–24 months out; light construction supports rent growth.
Investment metrics
- 1% rule
- 0.80% ✗
- Cap rate
- 6.49%
- Cash-on-cash
- 0.71%
- DSCR
- 1.03
- GRM
- 10.4
CMA / ARV
- ARV (median comp)
- $1,810,215
- List price
- $1,295,000
- Delta
- -28.46%
- Verdict
- UNDERPRICED
- Comps
- 20 within 1.0 mi
Show comp detail 12 sales within ~0.75 mi
| Address | Dist | Beds/Ba | Sqft | Sold | Price | $/sf | Match |
|---|---|---|---|---|---|---|---|
| 691-693 28th Ave | 0.00mi | 4/2.0 | 2,640 (0%) | 0mo | $1,800,000 | $682 | 100 |
| 2440-2442 Balboa St | 0.14mi | 4/— | 2,780 (+5%) | 12mo | $1,555,000 | $559 | 74 |
| 658-660 33rd Ave | 0.26mi | 4/1.0 | 2,550 (-3%) | 13mo | $1,300,000 | $510 | 67 |
| 531-533 23rd Ave | 0.30mi | 4/4.0 | 2,400 (-9%) | 3mo | $1,950,000 | $813 | 60 |
| 3009-3011 Balboa St | 0.18mi | 4/3.0 | 2,874 (+9%) | 17mo | $1,662,960 | $579 | 59 |
| 3331-3333A Cabrillo St | 0.40mi | 4/2.0 | 2,519 (-5%) | 20mo | $1,900,000 | $754 | 57 |
| 2433-2435 Cabrillo St | 0.22mi | 4/2.0 | 2,990 (+13%) | 15mo | $1,652,000 | $553 | 55 |
| 5828 California St | 0.69mi | 4/— | 2,760 (+4%) | 19mo | $1,415,000 | $513 | 45 |
| 600-602 39th Ave | 0.63mi | 5/— (+1) | 2,980 (+13%) | 1mo | $2,122,000 | $712 | 44 |
| 571 36th Ave | 0.49mi | 4/4.0 | 2,900 (+10%) | 15mo | $1,450,000 | $500 | 40 |
| 735-737 40th Ave | 0.71mi | 4/2.0 | 2,250 (-15%) | 10mo | $1,610,000 | $716 | 34 |
| 1721 Clement St | 0.68mi | 5/4.0 (+1) | 3,010 (+14%) | 2mo | $1,700,000 | $565 | 30 |
Match score weights: distance 35% · size 25% · config 20% · recency 20%. Top-matched comps best support the ARV.
Projected returns pro-forma
-3.0% appreciation · 8.0% rent growth · sell at horizon
- IRR
- -10.3%
- Equity multiple
- 0.61×
- Total profit
- $-141,796
- Equity at exit
- $193,089
- IRR
- 4.5%
- Equity multiple
- 1.39×
- Total profit
- $141,961
- Equity at exit
- $111,968
Cash invested: $362,600 (down + closing). Projections, not guarantees.
Landlord ↔ Tenant lean methodology
- Overall (CITY)
- 0 Strongly Tenant-Friendly
- State California
- 18 Strongly Tenant-Friendly · D+13
- County
- — inherits STATE
- City San Francisco
- 0 Strongly Tenant-Friendly · D+57
ZIP-level market 94121
- Rents YoY
- 13.0%
- Active inventory
- 74
- Price-to-rent
- 20.8×
Monthly cashflow live
- Estimated rent
- $10,379 high interval (Pro) →
- Mortgage (P&I)
- −$6,791
- Tax from tax record
- −$655 /mo · $7,855/yr
- Insurance
- −$540
- HOA
- −$0
- Vacancy / Maint / Mgmt
- −$2,180
- Net cashflow
- $214
Break-even live
Sensitivity live
| Price | -10% $947 | -5% $581 | +0% $214 | +5% $-152 | +10% $-519 |
|---|---|---|---|---|---|
| Rent | -10% $-606 | -5% $-196 | +0% $214 | +5% $624 | +10% $1,034 |
| Rate | -1.0pp $866 | -0.5pp $543 | base $214 | +0.5pp $-121 | +1.0pp $-463 |
2-unit breakdown (identical units grouped — click to expand)
| Units | Beds | Baths | Est. rent |
|---|---|---|---|
| 2× units | 2 | 1 | $10,378 |
| #1 | 2 | 1 | $5,189 |
| #2 | 2 | 1 | $5,189 |
| Total (2 units) | $10,379 | ||
UW: 25.0% down · 7.5% · 30yr · 1.5% tax · 5.0% vac · 8.0% maint · 8.0% mgmt
Financing live
Cash to close
- Down payment
- $323,750
- Closing costs
- $38,850
- Reserves months
- —
- Total cash needed
- —
Loan-product check · same deal, 3 products live
Conventional
25% down · 7.5% · 30yr
- Down + closing
- —
- Monthly P&I
- —
- Monthly cashflow
- —
- DSCR
- —
- Eligible?
- —
Personal DTI + credit; lowest rate.
DSCR
20% down · 8.5% · 30yr
- Down + closing
- —
- Monthly P&I
- —
- Monthly cashflow
- —
- DSCR
- —
- Eligible?
- —
No personal income docs; deal must DSCR.
Hard money
10% down · 12.0% · 12mo
- Down + closing
- —
- Monthly P&I
- —
- Monthly cashflow
- —
- DSCR
- —
- Eligible?
- —
Short-term bridge; refi at stabilization.
Rent comps 4 comps
| Address | Beds | Baths | Sqft | Rent | $/sqft | DOM | Units | Dist |
|---|---|---|---|---|---|---|---|---|
| 806 35th Ave San Francisco, CA | 5.0 | 3.0 | 2296 | $13,995 | $6.10 | 3d | 1 | 0.40mi |
| 479 35th Ave San Francisco, CA | 3.0 | 2.5 | 1750 | $6,200 | $3.54 | 13d | 1 | 0.51mi |
| 814 41st Ave San Francisco, CA | 4.0 | 3.5 | 1900 | $12,000 | $6.32 | 2d | 1 | 0.75mi |
| 1251 40th Ave San Francisco, CA | 4.0 | 3.0 | 2195 | $14,000 | $6.38 | 4d | 1 | 1.09mi |
Listing history 1 events
-
2026-05-13$1,295,000 Active 1306-char remark
ⓘ Source: listings_history table (triggers on properties + properties_extension) + one-shot
backfill from property_details.listing_events for pre-trigger history.
Tax reassessment forecast CA · Resets to sale price
- Current annual tax
- $7,855 · $655/mo
- Projected year-2 tax
- $9,842 · $820/mo
- Expected delta
- +$1,987/yr (+$166/mo · 25.3%)
ⓘ Screening estimate from a state-policy table — verify with the county assessor before closing.
Climate risk First Street
- Flood 1/10 Low FEMA zone X (unshaded) · 0% chance over 30 yrs
- Wildfire 4/10 Moderate
- Heat 2/10 Low 7 d/yr ≥77°F today · 16 d/yr by 30 yrs out
- Wind 1/10 Low
- Air quality 7/10 Severe 13 unhealthy d/yr today · 13 by 30 yrs out
Nearby sold comps map
Loading sold comps map…
Walkable amenities ~0.75 mi
Loading nearby amenities…
Taxation est. · year 1
- Rental income
- $124,548
- − Mortgage interest
- −$72,540
- − Property taxes
- −$7,855
- − Insurance
- −$6,475
- − Repairs & maintenance
- −$9,964
- − Management
- −$9,964
- − Depreciation
- −$37,673
- Taxable loss
- −$19,923
- Est. tax savings @ 24.0%
- +$4,782
- After-tax cash flow
- $7,351/yr
For passive investors: Depreciation is non-cash, so a rental often shows a tax loss while cash-flowing — sheltering income. Rental losses are passive: they offset passive income freely, and up to $25,000/yr can offset ordinary (W-2) income if you actively participate and your MAGI is under $100k (phasing out to $0 by $150k); unused losses carry forward. On sale, claimed depreciation is recaptured at up to 25%, and gains may owe capital-gains tax (a 1031 exchange can defer both). Figures are a year-1 estimate at your 24.0% rate — not tax advice; consult a CPA.
Schools (NCES district)
- District
- San Francisco Unified
- NCES district ID
- 0634410
- Math proficiency
- 50% ▬ 0.00%
- Reading proficiency
- 56% ▲ 1.00%
- Median HH income
- $81,249
- Composite
- 50.14/100
- National rank
- #4088
- State rank
- #322 of 1400 in CA
Livability — San Francisco
- Score
- 76/100
- State rank
- #90
- US rank
- #3143
Category grades
Schools grade is shown separately in the Schools card above.
Census & demographics
- Census place
- San Francisco, CA
- County
- San Francisco County · 827,552 people
- City population
- 827,552
- Metro
- San Francisco-Oakland-Berkeley, CA
- Population (ZIP)
- 41,995
- Household income
- $133,358
- Rent vs Own
- Severe rent burden
- 2072.0
Population outlook (San Francisco County) Hauer SSP2
- Today (2025)
- 1,030,936 people
- By 2030
- 1,110,409 · +7.7%
- By 2040
- 1,270,010 · +23.2%
- By 2050
- 1,435,001 · +39.2%
- By 2075
- 1,779,074 · +72.6%
- By 2100
- 1,966,767 · +90.8%
Race, ethnicity, and origin ACS 2023
- Neighborhood character
- Diverse neighborhood (Simpson 0.65)
- Race & ethnicity
- Asian 42% White 41% Two or more races 10% Hispanic / Latino 8% Black 2%
- Hispanic origin (detail)
- Mexican 4%
- Common ancestry
- Scotch-Irish 3% Lithuanian 2% Romanian 2%
- Foreign-born
- 35% · China, Canada, Vietnam
- Languages at home
- 59% English-only · Chinese 22% Russian/Polish/Slavic 4% Spanish 4%
Political lean MEDSL · San Francisco
- 2024 margin
- Solid D (+64.8) · D 80.3% · R 15.5% · Other 4.1%
- 2008→2024 swing
- -5.7pp toward R · 2008: 70.5pp · 2024: 64.8pp
- All cycles
- 2024: D+64.8 2020: D+72.5 2016: D+76.1 2012: D+70.2 2008: D+70.5
Not yet ingested
- Civics
- —
Market trends
- HPI YoY
- ▼ -1078.57%
- Current HPI
- 266.5786
- Rent YoY
- ▲ 13.03%
- Metro
- San Francisco-Oakland-Berkeley, CA
- State GDP YoY
- ▲ 3.21%
- F500 in state
- 116
Industry mix (Fortune 500 HQ in CA)
| Industry | F500 HQs | Revenue |
|---|---|---|
| Technology | 27 | $1,492B |
|
||
| Financial Services | 3 | $174B |
|
||
| Retail | 3 | $44B |
|
||
| Insurance | 3 | $26B |
|
||
| Media / Entertainment | 2 | $115B |
|
||
| Pharmaceuticals / Biotech | 2 | $62B |
|
||
Price history
+39.0% since first listed3 events — show timeline
- 2026-06-11 Sold (MLS) $1,800,000 San Francisco MLS
- 2026-05-22 Pending — San Francisco MLS
- 2026-05-13 Listed $1,295,000 San Francisco MLS
Property tax history
+2.1%/yrLatest (2025): $7,855 · +2.9% YoY. Source: county tax records.
Cash-flow waterfall
monthlySold comps — $/sqft
last 12 mo · ≤1 miLoading sold comps…