 🏷️ Likely Rental
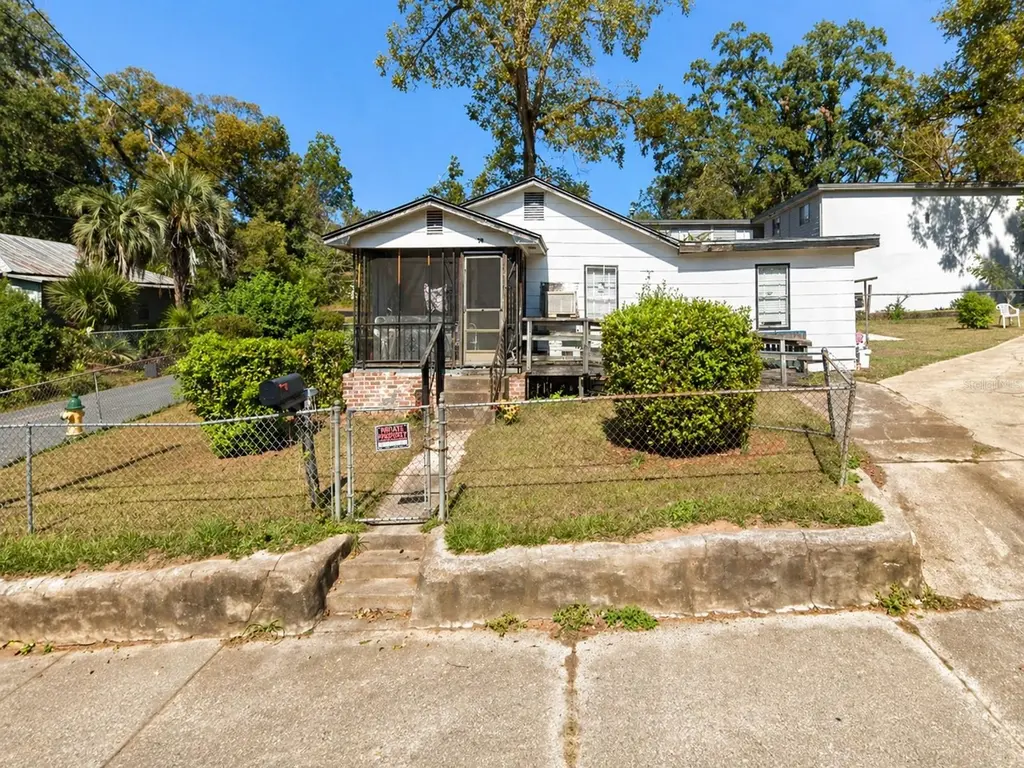
1124 Alabama St · Tallahassee, FL
Flood risk 1/10 · Minimal
- FEMA flood zone
- X (unshaded)
- Chance of flooding over 30 yrs
- 0.0%
- Est. flood insurance / yr
- $507 – $1,088
Fire risk 1/10 · Minimal
- Est. fire insurance / yr
- $947 – $1,759
Heat risk 8/10 · Major
- Hot days now (above 108°F)
- 7 days/yr
- Hot days in 30 yrs
- 20 days/yr
Wind risk 9/10 · Severe
- Chance of severe wind over 30 yrs
- 99.0%
Air-quality risk 5/10 · Moderate
- Unhealthy air days now
- 7 days/yr
- Unhealthy air days in 30 yrs
- 7 days/yr
Risk factors via First Street. Map © Google.
Why this score? — see what drove the B+ grade
The composite is a weighted blend of 9 inputs, each scored 0–100. Each bar is that input's sub-score; the figure is the points it added to the 100-point composite (weight × sub-score).
- Cash flow +30.0/30.0
- ARV discount +15.0/15.0
- 1% rule +10.0/10.0
- DSCR +10.0/10.0
- Schools +4.3/10.0
- Livability +4.3/5.0
- Rent growth +3.7/5.0
- Condition / age +2.5/5.0
- Appreciation +0.0/10.0
$75,500
🖨 Deal sheet 📄 Offer letter ✓ Due diligence
Listing remarks
Great investment opportunity in the heart of Tallahassee! This single-family home offers approximately 1,044 sq ft of living space and sits on a spacious lot just under 7,000 sq ft. Built in 1958, the property features a functional layout with 3 bedrooms and 1 bathroom, making it ideal for rental income or a value-add renovation project. Located in the established Griffin Heights neighborhood, the home is conveniently positioned near schools, shopping, and major roadways, with close proximity to Florida State University and downtown Tallahassee. The area shows consistent rental demand, with estimated rents around $1,500/month, offering solid cash flow potential for investors. Property inclu
Key facts
- Large yard
- Functional layout
- 6,969 sq ft lot
Tags
Property features AI
Finance
- Other: Property type: Residential, Single Family Residence; Zoning: UNPLATTED
- Financial info: Lease restrictions: none reported
- HOA & community: No HOA/association
Exterior
- Parking: No parking details provided
- Security: No security features listed
- Utilities: Public water; Public sewer; Cable connected; Electricity available; Other utilities available
- Home design: Single family residence; One story; Northeast facing
- Construction: Vinyl siding; Shingle roof; Block foundation; Built area about 1,210 sq ft
- Exterior features: Concrete road access; Lot about 0.16 acres
Interior
- Kitchen: Microwave; Range; Electric water heater
- Bedrooms: 3 bedrooms
- Flooring: Other flooring
- Bathrooms: 1 full bathroom
- Heating & cooling: Central heating; Central air conditioning
- Interior features: No specific interior features listed
- Laundry & utility: No laundry hookups/features listed; Dryer
Neighborhood map
What this means for you Summary
Snapshot
- This is a 3-bed/1.0-bath single-family listed at $76k.
Deal economics
- At list price, monthly cash flow is $719 ($9k/yr) — positive.
- The deal already cash-flows at list — no discount required.
- Meets the 1% rule at list price ($2k rent vs $76k).
- Recommended offer: $74k (1.5% below list) — sets the bar for market timing.
- Cap rate 17.7% vs local median 4.2% in Tallahassee — top-decile yield for the area; either an underpriced asset or a hidden risk that comps aren't pricing in. Stress-test before assuming the spread holds.
Location & tenants
- Location reads 86/100 on livability (#19 in FL, #429 nationally) — a professional / high-income tenant draw. Strengths: amenities A+, commute A+, health & safety A+; Watch: employment D.
- Leon (urban): math 48% / reading 53% proficiency, ranked #33 of 73 in FL (top 45%) — acceptable for families but not a draw, mixed tenant base, ~2y average lease.
- Market conditions: Rents rising fast (+4.7%/yr); 142 active listings in the ZIP; 40 comparable units currently listed for rent nearby; rentals at typical pace (median 21d on market — plan ~3-4 weeks tenant-placement turnaround); lower-income renter base — watch delinquency; 1,765 units permitted in Leon County in 2024 (975 in 5+ unit buildings).
- At $1,638/mo this rent would consume 61% of the median local household income ($32k/yr) (locally 6995% of renters already pay >50% of income on rent) — very limited rent-growth headroom before tenants either downsize or default.
Forward outlook
- Local home prices are declining (-3.0%/yr); year-one equity from $522 of loan paydown is wiped out by about $2k of value loss. Plan a longer hold.
- Leon County population projected at +23% by 2050 — long-run rental-demand tailwind backs the buy-and-hold thesis.
- At projected returns (-3.0% appreciation + 4.7% rent growth), your $21k cash investment doubles in ~3 years — after that, you're playing with house money.
Negotiation context
- It's been on market 27 days — a 2% lower offer ($74k) is reasonable based on typical stale-listing flexibility.
- 2 sale attempts with the ask held roughly flat each time — persistent listings suggest the price (not the market) is what's stuck; bring a comps-based counter.
Risks & watch-outs
- Watch-outs: built in 1958 — expect roof / HVAC / electrical / plumbing capex.
- Climate carrying-cost: severe wind risk, 99% chance of damaging wind over 30y; extreme-heat days projected 7→20/yr by 2055 (HVAC capex compounding) — expect insurance premiums to compound above CPI over the hold.
Questions for the listing agent
- Built in 1958 — when were the roof, HVAC, electrical panel, plumbing, and water heater last replaced?
- Is there a deadline driving the sale (1031 exchange, divorce, estate, relocation)? That informs how much negotiation room exists.
- Schools are B-rated — typically a magnet for longer-tenancy family renters. What's the average tenant stay here, and is there a school-zone premium baked into asking?
- What's the average days-on-market for RENTAL listings here right now (not sales)? A rising rental-DOM trend means longer vacancies and softer asking-rent achievability than the comps imply.
- What's the recent tenant-quality profile in this submarket — average credit score on applications, eviction rate, late-payment / NSF rate, and stable-employment percentage? A property-management company in the area should have these aggregated.
- How much new for-sale + rental construction is in the pipeline within 1–3 miles? Heavy new supply typically softens prices + rents 12–24 months out; constrained supply supports both.
Investment metrics
- 1% rule
- 2.17% ✓
- Cap rate
- 17.72%
- Cash-on-cash
- 40.81%
- DSCR
- 2.82
- GRM
- 3.8
CMA / ARV
- ARV (on-the-fly)
- $147,204
- Comps found
- 12
Show comp detail 12 sales within ~0.75 mi
| Address | Dist | Beds/Ba | Sqft | Sold | Price | $/sf | Match |
|---|---|---|---|---|---|---|---|
| 1053 Delaware St | 0.30mi | 3/2.0 | 1,036 (-1%) | 6mo | $159,000 | $153 | 75 |
| 1433 Alabama St | 0.41mi | 3/2.0 | 1,025 (-2%) | 6mo | $171,000 | $167 | 69 |
| 651 W 8th Ave | 0.58mi | 3/1.0 | 1,054 (+1%) | 6mo | $264,000 | $250 | 67 |
| 1010 Calloway St | 0.36mi | 3/1.0 | 1,112 (+6%) | 8mo | $98,000 | $88 | 66 |
| 1336 Gibbs Dr | 0.54mi | 3/1.0 | 1,008 (-3%) | 10mo | $140,000 | $139 | 61 |
| 643 W 8th Ave | 0.60mi | 3/1.0 | 1,083 (+4%) | 7mo | $75,000 | $69 | 60 |
| 1101 Colorado St | 0.44mi | 3/2.0 | 1,152 (+10%) | 1mo | $170,000 | $148 | 58 |
| 1426 Alabama St | 0.36mi | 3/2.0 | 1,167 (+12%) | 3mo | $165,000 | $141 | 58 |
| 1015 Richmond St | 0.24mi | 3/2.0 | 1,186 (+14%) | 7mo | $82,500 | $70 | 56 |
| 1530 Yancey St | 0.62mi | 3/2.0 | 1,022 (-2%) | 10mo | $118,000 | $115 | 55 |
| 715 Caliark St | 0.67mi | 3/2.0 | 970 (-7%) | 11mo | $275,000 | $284 | 44 |
| 532 W 4th Ave | 0.73mi | 2/1.0 (-1) | 920 (-12%) | 8mo | $55,000 | $60 | 34 |
Match score weights: distance 35% · size 25% · config 20% · recency 20%. Top-matched comps best support the ARV.
Projected returns pro-forma
-3.0% appreciation · 4.69% rent growth · sell at horizon
- IRR
- 39.3%
- Equity multiple
- 2.72×
- Total profit
- $36,443
- Equity at exit
- $11,257
- IRR
- 46.6%
- Equity multiple
- 5.87×
- Total profit
- $102,954
- Equity at exit
- $6,528
Cash invested: $21,140 (down + closing). Projections, not guarantees.
Landlord ↔ Tenant lean methodology
- Overall (STATE)
- 87 Strongly Landlord-Friendly
- State Florida
- 87 Strongly Landlord-Friendly · R+3
- County
- — inherits STATE
- City
- — inherits STATE
ZIP-level market 32304
- Home prices YoY
- -21.2%
- Rents YoY
- 4.7%
- Active inventory
- 142
- Price-to-rent
- 3.8×
Monthly cashflow live
- Estimated rent
- $1,638 high interval (Pro) →
- Mortgage (P&I)
- −$396
- Tax from tax record
- −$148 /mo · $1,771/yr
- Insurance
- −$31
- HOA
- −$0
- Vacancy / Maint / Mgmt
- −$344
- Net cashflow
- $719
Break-even live
UW: 25.0% down · 7.5% · 30yr · 1.5% tax · 5.0% vac · 8.0% maint · 8.0% mgmt
Financing live
Cash to close
- Down payment
- $18,875
- Closing costs
- $2,265
- Reserves months
- —
- Total cash needed
- —
Loan-product check · same deal, 3 products live
Conventional
25% down · 7.5% · 30yr
- Down + closing
- —
- Monthly P&I
- —
- Monthly cashflow
- —
- DSCR
- —
- Eligible?
- —
Personal DTI + credit; lowest rate.
DSCR
20% down · 8.5% · 30yr
- Down + closing
- —
- Monthly P&I
- —
- Monthly cashflow
- —
- DSCR
- —
- Eligible?
- —
No personal income docs; deal must DSCR.
Hard money
10% down · 12.0% · 12mo
- Down + closing
- —
- Monthly P&I
- —
- Monthly cashflow
- —
- DSCR
- —
- Eligible?
- —
Short-term bridge; refi at stabilization.
Rent comps 40 comps
| Address | Beds | Baths | Sqft | Rent | $/sqft | DOM | Units | Dist |
|---|---|---|---|---|---|---|---|---|
| 1004 Volusia St Tallahassee, FL | 4.0 | 2.0 | 1360 | $1,800 | $1.32 | 13d | 1 | 0.19mi |
| 916 N Woodward Ave #1 Tallahassee, FL | 2.0 | 1.0 | 794 | $1,000 | $1.26 | 13d | 1 | 0.29mi |
| 1107 Basin St Unit A Tallahassee, FL | 3.0 | 2.0 | 1215 | $2,400 | $1.98 | 21d | 1 | 0.32mi |
| 1329 Nylic St #1 Tallahassee, FL | 3.0 | 3.0 | 1275 | $1,800 | $1.41 | 21d | 1 | 0.39mi |
| 859 W Brevard St Tallahassee, FL | 4.0 | 4.0 | 1500 | $1,900 | $1.27 | 13d | 1 | 0.53mi |
| 1325 W Tharpe St Tallahassee, FL | 1.0–3.0 | 1.0–4.0 | 937 | $1,676 | $1.79 | 13d | 21 | 0.53mi |
| 832 Arkansas St Tallahassee, FL | 3.0 | 1.0 | 1296 | $1,400 | $1.08 | 21d | 1 | 0.59mi |
| 847 W Georgia St Tallahassee, FL | 4.0 | 4.0 | 1500 | $1,900 | $1.27 | 13d | 1 | 0.59mi |
| 1525 W Tennessee St #307 Tallahassee, FL | 2.0 | 1.0 | 1200 | $1,600 | $1.33 | 21d | 1 | 0.63mi |
| 1108 Greentree Ct Tallahassee, FL | 2.0 | 2.0 | 888 | $1,275 | $1.44 | 21d | 1 | 0.65mi |
| 1111 High Rd Tallahassee, FL | 2.0–3.0 | 2.0 | 1000 | $1,594 | $1.59 | 13d | 11 | 0.71mi |
| 2020 Continental Ave Tallahassee, FL | 1.0–2.0 | 1.0–1.5 | 850 | $1,300 | $1.53 | 21d | 3 | 0.80mi |
| 322 Conradi St Tallahassee, FL | 3.0 | 2.0 | 1100 | $1,950 | $1.77 | 21d | 4 | 0.83mi |
| 1916 Nannette Dr Unit 1916 Tallahassee, FL | 2.0 | 1.0 | 1000 | $1,100 | $1.10 | 13d | 1 | 0.91mi |
| 1001 Ocala Rd Tallahassee, FL | 4.0 | 1.0–2.0 | 899 | $642 | $0.71 | 21d | 6 | 0.92mi |
| 2060 Continental Ave Tallahassee, FL | 1.0–3.0 | 1.0–2.5 | 1121 | $1,185 | $1.06 | 13d | 26 | 0.95mi |
| 1935 Dawsey St Unit 1935-2 Tallahassee, FL | 2.0 | 1.0 | 875 | $975 | $1.11 | 13d | 1 | 0.99mi |
| 1303 Ocala Rd Tallahassee, FL | 1.0–4.0 | 1.0–2.0 | 1121 | $1,445 | $1.29 | 13d | 48 | 0.99mi |
| 412 W Brevard St Unit 412 Tallahassee, FL | 3.0 | 2.0 | 900 | $800 | $0.89 | 21d | 1 | 1.01mi |
| 1350 Ocala Rd Unit C Tallahassee, FL | 4.0 | 3.0 | 1142 | $1,550 | $1.36 | 21d | 1 | 1.04mi |
| 1360 Ocala Rd Tallahassee, FL | 2.0 | 1.0 | 800 | $1,000 | $1.25 | 21d | 1 | 1.06mi |
| 718 N Bronough St Tallahassee, FL | 2.0 | 1.0 | 798 | $1,100 | $1.38 | 21d | 1 | 1.07mi |
| 828 N Duval St Tallahassee, FL | 3.0 | 2.5 | 1498 | $2,600 | $1.74 | 21d | 1 | 1.11mi |
| 2301 Old Bainbridge Rd Tallahassee, FL | 2.0–3.0 | 1.0–2.0 | 1084 | $1,600 | $1.48 | 21d | 1 | 1.24mi |
| 1612 Overstreet St Tallahassee, FL | 3.0 | 3.0 | 1500 | $3,300 | $2.20 | 21d | 1 | 1.27mi |
| 808 Saint Augustine St Tallahassee, FL | 2.0 | 2.5 | 1500 | $2,095 | $1.40 | 21d | 1 | 1.28mi |
| 220 Atkinson Dr Unit D Tallahassee, FL | 2.0 | 1.0 | 928 | $1,100 | $1.19 | 21d | 1 | 1.31mi |
| 2309 Old Bainbridge Rd Tallahassee, FL | 1.0–2.0 | 1.0–2.0 | 798 | $1,420 | $1.78 | 13d | 10 | 1.34mi |
| 440 N Monroe St Tallahassee, FL | 3.0 | 1.0–3.0 | 1311 | $3,850 | $2.94 | 13d | 15 | 1.35mi |
| 1210 Stone Rd Tallahassee, FL | 2.0 | 2.0 | 1008 | $1,200 | $1.19 | 21d | 1 | 1.42mi |
| 1447 Stone Rd Tallahassee, FL | 1.0–3.0 | 1.0–2.0 | 890 | $1,545 | $1.74 | 21d | 1 | 1.42mi |
| 2182 Timberwood Cir S Unit 1 Tallahassee, FL | 3.0 | 2.5 | 1280 | $1,599 | $1.25 | 21d | 1 | 1.43mi |
| 1571 Stone Rd Unit 5B Tallahassee, FL | 2.0 | 2.5 | 1216 | $1,795 | $1.48 | 21d | 1 | 1.43mi |
| 1854 Belle Vue Way Tallahassee, FL | 2.0–4.0 | 1.0–2.0 | 1100 | $1,768 | $1.61 | 21d | 1 | 1.43mi |
| 833 W Gaines St Tallahassee, FL | 2.0 | 2.0 | 1080 | $2,350 | $2.18 | 13d | 2 | 1.44mi |
| 1560 San Luis Rd Tallahassee, FL | 3.0 | 3.5 | 1500 | $774 | $0.52 | 21d | 22 | 1.45mi |
| 215 W College Ave Unit 706B Tallahassee, FL | 2.0 | 1.0 | 823 | $2,600 | $3.16 | 21d | 1 | 1.47mi |
| 301 S Lipona Rd #24 Tallahassee, FL | 2.0 | 1.5 | 896 | $1,350 | $1.51 | 21d | 1 | 1.49mi |
| 1801 Lenora Dr Tallahassee, FL | 3.0 | 1.0 | 1150 | $1,800 | $1.57 | 21d | 1 | 1.49mi |
| 2400 Fred Smith Rd #201 Tallahassee, FL | 3.0 | 3.0 | 1353 | $1,650 | $1.22 | 21d | 1 | 1.49mi |
Listing history 6 events
-
2026-06-18days on market $75,500 Active 27 DOM
-
2026-06-17days on market $75,500 Active 26 DOM
-
2026-06-16days on market $75,500 Active 25 DOM
-
2026-06-15days on market $75,500 Active 24 DOM
-
2026-06-14remarks 699-char remark
-
2026-06-14$75,500 Active 22 DOM
ⓘ Source: listings_history table (triggers on properties + properties_extension) + one-shot
backfill from property_details.listing_events for pre-trigger history.
Tax reassessment forecast FL · Resets to sale price
- Current annual tax
- $1,771 · $148/mo
- Projected year-2 tax
- $1,771 · $148/mo
- Expected delta
- $0/yr ($0/mo · 0.0%)
ⓘ Screening estimate from a state-policy table — verify with the county assessor before closing.
Climate risk First Street
- Flood 1/10 Low FEMA zone X (unshaded) · 0% chance over 30 yrs
- Wildfire 1/10 Low
- Heat 8/10 Severe 7 d/yr ≥108°F today · 20 d/yr by 30 yrs out
- Wind 9/10 Extreme 99% chance of damaging wind over 30 yrs
- Air quality 5/10 Major 7 unhealthy d/yr today · 7 by 30 yrs out
Nearby sold comps map
Loading sold comps map…
Walkable amenities ~0.75 mi
Loading nearby amenities…
Taxation est. · year 1
- Rental income
- $19,653
- − Mortgage interest
- −$4,229
- − Property taxes
- −$1,771
- − Insurance
- −$378
- − Repairs & maintenance
- −$1,572
- − Management
- −$1,572
- − Depreciation
- −$2,196
- Taxable income
- $7,935
- Est. tax owed @ 24.0%
- −$1,904
- After-tax cash flow
- $6,722/yr
For passive investors: Depreciation is non-cash, so a rental often shows a tax loss while cash-flowing — sheltering income. Rental losses are passive: they offset passive income freely, and up to $25,000/yr can offset ordinary (W-2) income if you actively participate and your MAGI is under $100k (phasing out to $0 by $150k); unused losses carry forward. On sale, claimed depreciation is recaptured at up to 25%, and gains may owe capital-gains tax (a 1031 exchange can defer both). Figures are a year-1 estimate at your 24.0% rate — not tax advice; consult a CPA.
Schools (NCES district)
- District
- Leon
- NCES district ID
- 1201110
- Math proficiency
- 48% ▼ -13.00%
- Reading proficiency
- 53% ▼ -5.00%
- Median HH income
- $46,339
- Composite
- 42.84/100
- National rank
- #3131
- State rank
- #33 of 73 in FL
Livability — Tallahassee
- Score
- 86/100
- State rank
- #19
- US rank
- #429
Category grades
Schools grade is shown separately in the Schools card above.
Census & demographics
- Census place
- Tallahassee, FL
- County
- Leon County · 294,472 people
- City population
- 294,472
- Metro
- Tallahassee, FL
- Population (ZIP)
- 51,673
- Household income
- $32,348
- Rent vs Own
- Severe rent burden
- 6995.0
Population outlook (Leon County) Hauer SSP2
- Today (2025)
- 315,507 people
- By 2030
- 330,677 · +4.8%
- By 2040
- 358,465 · +13.6%
- By 2050
- 386,804 · +22.6%
- By 2075
- 465,480 · +47.5%
- By 2100
- 519,959 · +64.8%
Race, ethnicity, and origin ACS 2023
- Neighborhood character
- Diverse neighborhood (Simpson 0.65)
- Race & ethnicity
- White 45% Black 36% Hispanic / Latino 10% Two or more races 7% Asian 4%
- Hispanic origin (detail)
- Mexican 2% Puerto Rican 2% Cuban 2%
- Common ancestry
- Romanian 2% Lithuanian 1% Italian 1%
- Foreign-born
- 8% · Canada, China
- Languages at home
- 86% English-only · Spanish 7% Other Indo-European 2% French/Haitian/Cajun 1%
Political lean MEDSL · Leon
- 2024 margin
- Strong D (+21.8) · D 60.3% · R 38.5% · Other 1.2%
- 2008→2024 swing
- -2.5pp toward R · 2008: 24.3pp · 2024: 21.8pp
- All cycles
- 2024: D+21.8 2020: D+28.3 2016: D+25.1 2012: D+23.6 2008: D+24.3
Not yet ingested
- Civics
- —
Market trends
- HPI YoY
- ▼ -72.04%
- Current HPI
- 267.8426
- Rent YoY
- ▲ 4.69%
- Metro
- Tallahassee, FL
- State GDP YoY
- ▲ 3.28%
- F500 in state
- 36
Industry mix (Fortune 500 HQ in FL)
| Industry | F500 HQs | Revenue |
|---|---|---|
| Industrial Technology | 2 | $29B |
|
||
| Insurance | 2 | $17B |
|
||
| Retail | 1 | $60B |
|
||
| Technology Distribution | 1 | $58B |
|
||
| Homebuilding | 1 | $35B |
|
||
| Technology Manufacturing | 1 | $35B |
|
||
Price history
2 events — show timeline
- 2026-06-12 Relisted — Stellar MLS as Distributed by MLS Grid
- 2026-04-28 Listed $75,500 Stellar MLS as Distributed by MLS Grid
Property tax history
+20.7%/yrLatest (2025): $1,771 · +9.7% YoY. Source: county tax records.
Cash-flow waterfall
monthlySold comps — $/sqft
last 12 mo · ≤1 miLoading sold comps…