2308 Perdido Bay Ln · Sealy, TX
Flood risk 1/10 · Minimal
- FEMA flood zone
- X (unshaded)
- Chance of flooding over 30 yrs
- 0.0%
- Est. flood insurance / yr
- $507 – $1,088
Fire risk 5/10 · Moderate
- Est. fire insurance / yr
- $1,222 – $2,270
Heat risk 9/10 · Severe
- Hot days now (above 112°F)
- 7 days/yr
- Hot days in 30 yrs
- 22 days/yr
Wind risk 9/10 · Severe
- Chance of severe wind over 30 yrs
- 99.0%
Air-quality risk 1/10 · Minimal
- Unhealthy air days now
- 0 days/yr
- Unhealthy air days in 30 yrs
- 0 days/yr
Risk factors via First Street. Map © Google.
Why this score? — see what drove the D- grade
The composite is a weighted blend of 9 inputs, each scored 0–100. Each bar is that input's sub-score; the figure is the points it added to the 100-point composite (weight × sub-score).
- Cash flow +11.5/30.0
- ARV discount +8.9/15.0
- Livability +3.5/5.0
- DSCR +3.4/10.0
- Schools +3.4/10.0
- 1% rule +3.3/10.0
- Rent growth +2.5/5.0
- Condition / age +2.0/5.0
- Appreciation +0.0/10.0
$287,990
🖨 Deal sheet 📄 Offer letter ✓ Due diligence
Listing remarks
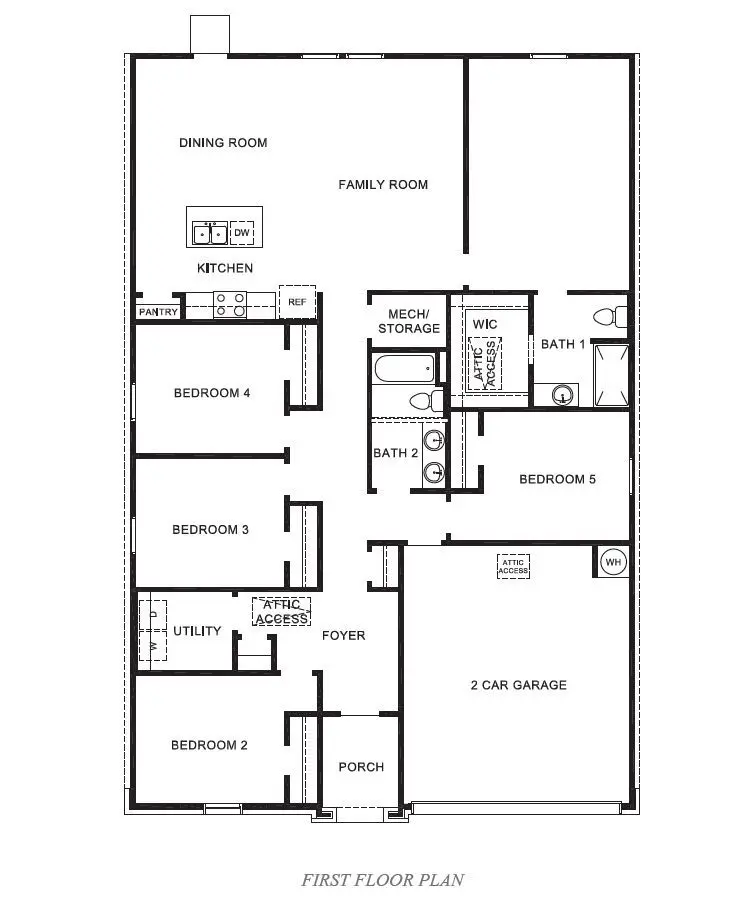
The Bailey is a thoughtfully designed 1,882 sq. ft. single-story home, offering generous space and a warm, welcoming layout. The home opens through a charming, covered porch into a central foyer, leading to a spacious family room that connects to the dining area and kitchen. The kitchen is beautifully appointed with stainless steel appliances, premium countertops, and sleek cabinetry, along with a convenient pantry that enhances everyday functionality.
Key facts
- Covered porch
- Central foyer
- Kitchen
Tags
Property features AI
Finance
- Other: Address: 2308 Perdido Bay Ln, Sealy TX 77474; Status: Active; Last modified: 2026-06-05
- Financial info: List price $287,990
Exterior
- Parking: 2 garage spaces; 2 parking spaces (total)
- Home design: Spec inventory, Bailey plan
Interior
- Bedrooms: 5 bedrooms
- Bathrooms: 2 full bathrooms
- Interior features: Living area of 1882
Neighborhood map
What this means for you Summary
Snapshot
- This is a 5-bed/2.0-bath single-family listed at $288k. Condition is rated fair.
Deal economics
- At list price, monthly cash flow is $-94 ($-1k/yr) — negative.
- To cash-flow at today's rent, offer at most $274k (4.7% below list).
- To meet the 1% rule (rent ≥ 1% of price), the offer needs to be $240k (16.7% below list).
- Recommended offer: $240k (16.7% below list) — sets the bar for 1% rule.
- Cap rate 5.9% vs local median 2.6% in Sealy — top-decile yield for the area; either an underpriced asset or a hidden risk that comps aren't pricing in. Stress-test before assuming the spread holds.
Location & tenants
- Location reads 70/100 on livability (#342 in TX) — a middle-class / working-renter tenant base. Strengths: cost of living A+, housing A+, crime A; Watch: schools D, amenities F, commute F.
- Sealy ISD (rural): math 39% / reading 39% proficiency, ranked #405 of 826 in TX (top 49%) — families likely to look elsewhere, expect single-tenant / working-renter base with shorter leases.
- Market conditions: 310 active listings in the ZIP; 1 comparable units currently listed for rent nearby; 410 units permitted in Austin County in 2024 (0 in 5+ unit buildings).
Forward outlook
- Local home prices are declining (-3.0%/yr); year-one equity from $2k of loan paydown is wiped out by about $9k of value loss. Plan a longer hold.
- Austin County population projected at +18% by 2050 — long-run rental-demand tailwind backs the buy-and-hold thesis.
Negotiation context
- Only 13 days on market — expect competitive offers; lowballing is unlikely to land.
Risks & watch-outs
- Climate carrying-cost: severe wind risk, 99% chance of damaging wind over 30y; moderate wildfire risk; extreme-heat days projected 7→22/yr by 2055 (HVAC capex compounding) — expect insurance premiums to compound above CPI over the hold.
Questions for the listing agent
- What do current leases actually rent for vs. the listed asking? Can we see a recent rent roll and the last 12 months of T-12 income?
- Have any recent inspections been done? Can we get a copy of the seller's disclosures and any deferred-maintenance estimates?
- Is there a deadline driving the sale (1031 exchange, divorce, estate, relocation)? That informs how much negotiation room exists.
- Schools are D-rated, which usually means shorter tenancies and higher turnover. Who's the typical renter profile here, and what's been the actual vacancy rate?
- The area grade is low — what's the realistic commute time and amenity access for the typical tenant pool here? Any planned neighborhood developments (good or bad) we should know about?
- What's the average days-on-market for RENTAL listings here right now (not sales)? A rising rental-DOM trend means longer vacancies and softer asking-rent achievability than the comps imply.
- What's the recent tenant-quality profile in this submarket — average credit score on applications, eviction rate, late-payment / NSF rate, and stable-employment percentage? A property-management company in the area should have these aggregated.
- How much new for-sale + rental construction is in the pipeline within 1–3 miles? Heavy new supply typically softens prices + rents 12–24 months out; constrained supply supports both.
Investment metrics
- 1% rule
- 0.83% ✗
- Cap rate
- 5.90%
- Cash-on-cash
- -1.40%
- DSCR
- 0.94
- GRM
- 10.0
CMA / ARV
- ARV (on-the-fly)
- $297,356
- Comps found
- 12
Show comp detail 12 sales within ~0.75 mi
| Address | Dist | Beds/Ba | Sqft | Sold | Price | $/sf | Match |
|---|---|---|---|---|---|---|---|
| 1108 Sundown Prairie Dr | 0.12mi | 4/2.5 (-1) | 1,817 (-4%) | 9mo | $305,000 | $168 | 74 |
| 1147 Buffalograss Trl | 0.24mi | 4/2.5 (-1) | 1,817 (-4%) | 3mo | $289,000 | $159 | 73 |
| 1259 Waterside Trce | 0.32mi | 4/2.5 (-1) | 1,831 (-3%) | 6mo | $289,000 | $158 | 69 |
| 1123 Sundown Prairie Dr | 0.11mi | 4/2.0 (-1) | 2,030 (+8%) | 10mo | $233,000 | $115 | 69 |
| 1105 Sundown Prairie Dr | 0.11mi | 4/2.0 (-1) | 1,778 (-6%) | 16mo | $276,990 | $156 | 67 |
| 2007 Woodlark Way | 0.21mi | 4/2.5 (-1) | 1,831 (-3%) | 15mo | $251,990 | $138 | 66 |
| 1281 Thornbird Trl | 0.42mi | 4/2.0 (-1) | 1,778 (-6%) | 1mo | $295,000 | $166 | 65 |
| 2227 Laurel Bloom Ln | 0.31mi | 4/2.5 (-1) | 1,831 (-3%) | 16mo | $254,990 | $139 | 61 |
| 2021 Woodlark Way | 0.27mi | 4/2.0 (-1) | 1,778 (-6%) | 15mo | $249,990 | $141 | 60 |
| 2205 Laurel Bloom Ln | 0.43mi | 4/2.0 (-1) | 1,778 (-6%) | 12mo | $278,990 | $157 | 56 |
| 1084 Westfork Dr | 0.64mi | 4/2.0 (-1) | 1,910 (+2%) | 13mo | $517,188 | $271 | 52 |
| 214 White Wing Ln | 0.66mi | 4/2.0 (-1) | 1,845 (-2%) | 15mo | $325,000 | $176 | 49 |
Match score weights: distance 35% · size 25% · config 20% · recency 20%. Top-matched comps best support the ARV.
Projected returns pro-forma
-3.0% appreciation · 3.0% rent growth · sell at horizon
- IRR
- -18.6%
- Equity multiple
- 0.35×
- Total profit
- $-52,632
- Equity at exit
- $42,940
- IRR
- -11.0%
- Equity multiple
- 0.34×
- Total profit
- $-53,412
- Equity at exit
- $24,900
Cash invested: $80,637 (down + closing). Projections, not guarantees.
Landlord ↔ Tenant lean methodology
- Overall (STATE)
- 87 Strongly Landlord-Friendly
- State Texas
- 87 Strongly Landlord-Friendly · R+5
- County
- — inherits STATE
- City
- — inherits STATE
ZIP-level market 77474
- Active inventory
- 310
- Price-to-rent
- 10.0×
Monthly cashflow live
- Estimated rent
- $2,400 medium interval (Pro) →
- Mortgage (P&I)
- −$1,510
- Tax est. 1.5%
- −$360 /mo · $4,320/yr
- Insurance
- −$120
- HOA
- −$0
- Vacancy / Maint / Mgmt
- −$504
- Net cashflow
- $-94
Break-even live
UW: 25.0% down · 7.5% · 30yr · 1.5% tax · 5.0% vac · 8.0% maint · 8.0% mgmt
Financing live
Cash to close
- Down payment
- $71,998
- Closing costs
- $8,640
- Reserves months
- —
- Total cash needed
- —
Loan-product check · same deal, 3 products live
Conventional
25% down · 7.5% · 30yr
- Down + closing
- —
- Monthly P&I
- —
- Monthly cashflow
- —
- DSCR
- —
- Eligible?
- —
Personal DTI + credit; lowest rate.
DSCR
20% down · 8.5% · 30yr
- Down + closing
- —
- Monthly P&I
- —
- Monthly cashflow
- —
- DSCR
- —
- Eligible?
- —
No personal income docs; deal must DSCR.
Hard money
10% down · 12.0% · 12mo
- Down + closing
- —
- Monthly P&I
- —
- Monthly cashflow
- —
- DSCR
- —
- Eligible?
- —
Short-term bridge; refi at stabilization.
Rent comps 1 comps
| Address | Beds | Baths | Sqft | Rent | $/sqft | DOM | Units | Dist |
|---|---|---|---|---|---|---|---|---|
| 305 Morning Dove Trl Sealy, TX | 4.0 | 2.0 | 1845 | $2,400 | $1.30 | 1d | 1 | 0.76mi |
Listing history 9 events
-
2026-06-18days on market $287,990 Active 13 DOM
-
2026-06-17days on market $287,990 Active 12 DOM
-
2026-06-16days on market $287,990 Active 11 DOM
-
2026-06-15days on market $287,990 Active 10 DOM
-
2026-06-13days on market $287,990 Active 8 DOM
-
2026-06-09days on market $287,990 Active 4 DOM
-
2026-06-08days on market $287,990 Active 3 DOM
-
2026-06-07remarks 456-char remark
-
2026-06-07$287,990 Active 2 DOM
ⓘ Source: listings_history table (triggers on properties + properties_extension) + one-shot
backfill from property_details.listing_events for pre-trigger history.
Climate risk First Street
- Flood 1/10 Low FEMA zone X (unshaded) · 0% chance over 30 yrs
- Wildfire 5/10 Major
- Heat 9/10 Extreme 7 d/yr ≥112°F today · 22 d/yr by 30 yrs out
- Wind 9/10 Extreme 99% chance of damaging wind over 30 yrs
- Air quality 1/10 Low 0 unhealthy d/yr today · 0 by 30 yrs out
Nearby sold comps map
Loading sold comps map…
Walkable amenities ~0.75 mi
Loading nearby amenities…
Taxation est. · year 1
- Rental income
- $28,800
- − Mortgage interest
- −$16,132
- − Property taxes
- −$4,320
- − Insurance
- −$1,440
- − Repairs & maintenance
- −$2,304
- − Management
- −$2,304
- − Depreciation
- −$8,378
- Taxable loss
- −$6,078
- Est. tax savings @ 24.0%
- +$1,459
- After-tax cash flow
- $328/yr
For passive investors: Depreciation is non-cash, so a rental often shows a tax loss while cash-flowing — sheltering income. Rental losses are passive: they offset passive income freely, and up to $25,000/yr can offset ordinary (W-2) income if you actively participate and your MAGI is under $100k (phasing out to $0 by $150k); unused losses carry forward. On sale, claimed depreciation is recaptured at up to 25%, and gains may owe capital-gains tax (a 1031 exchange can defer both). Figures are a year-1 estimate at your 24.0% rate — not tax advice; consult a CPA.
Condition & rehab AI · 0 photos
The home has a fair condition with some minor repairs and maintenance needed, particularly to the exterior siding and interior walls. Painting and landscaping improvements can significantly enhance its value.
Repairs flagged
- Minor Exterior siding — Some discoloration is visible on the exterior siding.
- Minor Interior walls — The paint quality is not clear, but it may need touch-ups.
- Minor Landscaping — Minimal landscaping may need improvement.
Value-add opportunities
- Both Painting the interior walls — Fresh paint can improve the home's appearance and value.
- Both Landscaping improvements — Enhanced landscaping can boost curb appeal and property value.
Renovation cost estimate screening
| Repair item | Severity | Est. cost |
|---|---|---|
| Exterior siding · Some discoloration is visible on the exterior siding. | Minor | $500–3,000 |
| Interior walls · The paint quality is not clear, but it may need touch-ups. | Minor | $500–3,000 |
| Landscaping · Minimal landscaping may need improvement. | Minor | $500–3,000 |
| Total estimated repair cost · 3 items | $1,500–9,000 |
Value-add ROI direction
- Both Painting the interior walls — Fresh paint can improve the home's appearance and value. ↑
- Both Landscaping improvements — Enhanced landscaping can boost curb appeal and property value. ↑
ⓘ Cost ranges are severity-bucket heuristics (US national rule-of-thumb). Get contractor quotes + a written scope before underwriting a rehab budget.
Schools (NCES district)
- District
- Sealy ISD
- NCES district ID
- 4839630
- Math proficiency
- 39% ▼ -6.00%
- Reading proficiency
- 39% ▼ -2.00%
- Median HH income
- $57,842
- Composite
- 34.42/100
- National rank
- #5200
- State rank
- #405 of 826 in TX
Livability — Sealy
- Score
- 70/100
- State rank
- #342
- US rank
- #7463
Category grades
Schools grade is shown separately in the Schools card above.
Census & demographics
- Census place
- Sealy, TX
- Population (ZIP)
- 14,846
Population outlook (Austin County) Hauer SSP2
- Today (2025)
- 32,206 people
- By 2030
- 33,459 · +3.9%
- By 2040
- 35,809 · +11.2%
- By 2050
- 37,933 · +17.8%
- By 2075
- 44,179 · +37.2%
- By 2100
- 47,870 · +48.6%
Race, ethnicity, and origin ACS 2023
- Neighborhood character
- Diverse neighborhood (Simpson 0.58)
- Race & ethnicity
- White 56% Hispanic / Latino 32% Black 9% Two or more races 8% Asian 1%
- Hispanic origin (detail)
- Mexican 28%
- Common ancestry
- Romanian 2% Lithuanian 1% Serbian 1%
- Foreign-born
- 12% · Canada
- Languages at home
- 73% English-only · Spanish 24% Russian/Polish/Slavic 1% Other Indo-European 1%
Political lean MEDSL · Austin
- 2024 margin
- Solid R (+62.7) · D 18.3% · R 81.0%
- 2008→2024 swing
- -11.8pp toward R · 2008: -50.9pp · 2024: -62.7pp
- All cycles
- 2024: R+62.7 2020: R+58.4 2016: R+59.7 2012: R+60.3 2008: R+50.9
Not yet ingested
- Civics
- —
Market trends
- HPI YoY
- ▼ -130.57%
- Current HPI
- 195.9491
- Rent YoY
- —
- Metro
- —
- State GDP YoY
- ▲ 3.95%
- F500 in state
- 110
Industry mix (Fortune 500 HQ in TX)
| Industry | F500 HQs | Revenue |
|---|---|---|
| Energy | 16 | $1,198B |
|
||
| Technology | 5 | $198B |
|
||
| Engineering / Construction | 4 | $72B |
|
||
| Energy Services | 3 | $60B |
|
||
| Utilities | 3 | $41B |
|
||
| Healthcare | 2 | $330B |
|
||
Cash-flow waterfall
monthlySold comps — $/sqft
last 12 mo · ≤1 miLoading sold comps…