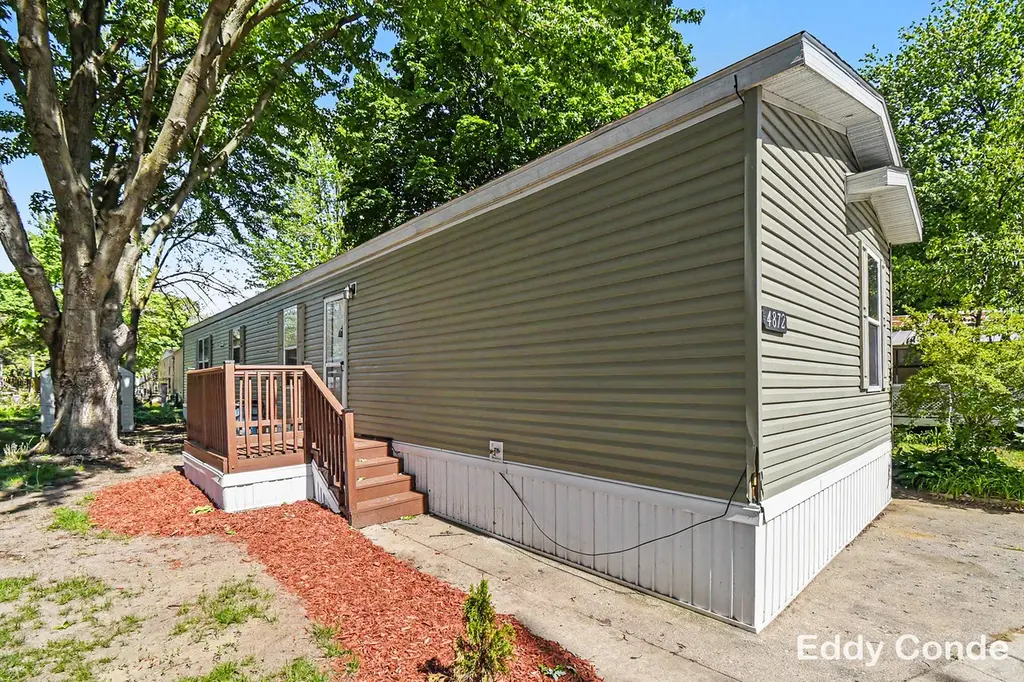
4872 Pamela Ave SE · Kentwood, MI
Flood risk No data
- FEMA flood zone
- —
- Chance of flooding over 30 yrs
- —
- Est. flood insurance / yr
- —
Fire risk No data
- Est. fire insurance / yr
- —
Heat risk No data
- Hot days now (above threshold)
- —
- Hot days in 30 yrs
- —
Wind risk No data
- Chance of severe wind over 30 yrs
- —
Air-quality risk No data
- Unhealthy air days now
- —
- Unhealthy air days in 30 yrs
- —
Risk factors via First Street. Map © Google.
Why this score? — see what drove the B- grade
The composite is a weighted blend of 9 inputs, each scored 0–100. Each bar is that input's sub-score; the figure is the points it added to the 100-point composite (weight × sub-score).
- Cash flow +30.0/30.0
- 1% rule +10.0/10.0
- DSCR +10.0/10.0
- ARV discount +7.5/15.0
- Livability +3.7/5.0
- Rent growth +2.5/5.0
- Condition / age +2.5/5.0
- Schools +1.7/10.0
- Appreciation +0.0/10.0
$69,900
🖨 Deal sheet 📄 Offer letter ✓ Due diligence
Listing remarks MLS
Beautifully maintained manufactured ranch-style home located in the desirable Windmill Pointe Community. Built in 2016, this spacious home features 3 bedrooms and 2 full bathrooms with a functional open-concept layout perfect for comfortable everyday living. The home offers a completely brand-new kitchen with modern cabinetry, countertops, and new appliances, making it truly move-in ready. Centrally located close to shopping, dining, schools, and major highways, this property combines convenience with affordability. Enjoy the spacious lot and peaceful community setting while still being near everything you need. New interior doors are on order.
Key facts
- Modern cabinetry
- Spacious lot
- New appliances
Tags
Property features AI
Finance
- HOA & community: Monthly association fee of $525 (includes trash)
Exterior
- Utilities: Public water; Natural gas available and connected; Electricity available; Cable connected; High-speed internet; Natural gas water heater
- Home design: Ranch style; Built in 2016
- Construction: Vinyl siding; Composition roof; Crawl space basement
- Exterior features: Sidewalk
Interior
- Kitchen: Oven; Range; Refrigerator
- Bedrooms: 3 total rooms
- Bathrooms: 2 full bathrooms
- Heating & cooling: Forced air heating; Wall unit cooling
- Interior features: Eat-in kitchen; Replacement windows
Neighborhood map
What this means for you Summary
Snapshot
- This is a 3-bed/2.0-bath other listed at $70k.
Deal economics
- At list price, monthly cash flow is $270 ($3k/yr) — positive.
- The deal already cash-flows at list — no discount required.
- Meets the 1% rule at list price ($2k rent vs $70k).
- Recommended offer: $69k (1.5% below list) — sets the bar for market timing.
- Cap rate 10.9% vs local median 3.7% in Kentwood — top-decile yield for the area; either an underpriced asset or a hidden risk that comps aren't pricing in. Stress-test before assuming the spread holds.
Location & tenants
- Location reads 74/100 on livability (#191 in MI, #4,892 nationally) — a middle-class / working-renter tenant base. Strengths: cost of living A+, housing A+, schools A-; Watch: commute C-, crime D, amenities F.
- Kelloggsville Public Schools (suburban): math 9% / reading 32% proficiency, ranked #465 of 540 in MI (top 86%) — low school quality limits family demand, transient renter base, plan for 1-2y turnover; 70% free/reduced lunch — lower-income household profile, screen leases tightly.
- Market conditions: 109 active listings in the ZIP; 5 comparable units currently listed for rent nearby; rentals at typical pace (median 15d on market — plan ~3-4 weeks tenant-placement turnaround); 40% of comp listings sitting > 30 days — soft ceiling on asking rent; 2,253 units permitted in Kent County in 2024 (969 in 5+ unit buildings).
- This rent runs 31% of the median local income ($62k/yr) — at the standard rent-burdened threshold; future hikes will face affordability resistance.
Forward outlook
- Local home prices are declining (-3.0%/yr); year-one equity from $483 of loan paydown is wiped out by about $2k of value loss. Plan a longer hold.
- Kent County population projected at +22% by 2050 — long-run rental-demand tailwind backs the buy-and-hold thesis.
- At projected returns (-3.0% appreciation + 3.0% rent growth), your $20k cash investment doubles in ~8 years — after that, you're playing with house money.
Negotiation context
- It's been on market 19 days — a 2% lower offer ($69k) is reasonable based on typical stale-listing flexibility.
- 3 sale attempts with the ask held roughly flat each time — persistent listings suggest the price (not the market) is what's stuck; bring a comps-based counter.
Risks & watch-outs
- Watch-outs: HOA is 32% of rent.
Questions for the listing agent
- What does the HOA fee cover, when was the last increase, and are there any pending special assessments or reserve-fund shortfalls?
- Is there a deadline driving the sale (1031 exchange, divorce, estate, relocation)? That informs how much negotiation room exists.
- Schools are A-rated — typically a magnet for longer-tenancy family renters. What's the average tenant stay here, and is there a school-zone premium baked into asking?
- Crime grade is D in this area — have there been break-ins, vandalism, or insurance claims at this property in the last 3 years? What carrier currently insures it and at what premium?
- What's the average days-on-market for RENTAL listings here right now (not sales)? A rising rental-DOM trend means longer vacancies and softer asking-rent achievability than the comps imply.
- What's the recent tenant-quality profile in this submarket — average credit score on applications, eviction rate, late-payment / NSF rate, and stable-employment percentage? A property-management company in the area should have these aggregated.
- How much new for-sale + rental construction is in the pipeline within 1–3 miles? Heavy new supply typically softens prices + rents 12–24 months out; constrained supply supports both.
Investment metrics
- 1% rule
- 2.31% ✓
- Cap rate
- 10.93%
- Cash-on-cash
- 16.55%
- DSCR
- 1.74
- GRM
- 3.6
CMA / ARV
No comps found within radius.
Projected returns pro-forma
-3.0% appreciation · 3.0% rent growth · sell at horizon
- IRR
- 8.1%
- Equity multiple
- 1.32×
- Total profit
- $6,213
- Equity at exit
- $10,422
- IRR
- 17.6%
- Equity multiple
- 2.48×
- Total profit
- $28,959
- Equity at exit
- $6,044
Cash invested: $19,572 (down + closing). Projections, not guarantees.
Landlord ↔ Tenant lean methodology
- Overall (STATE)
- 62 Landlord-Friendly
- State Michigan
- 62 Landlord-Friendly · EVEN
- County
- — inherits STATE
- City
- — inherits STATE
ZIP-level market 49548
- Active inventory
- 109
- Price-to-rent
- 3.6×
Monthly cashflow live
- Estimated rent
- $1,618 high interval (Pro) →
- Mortgage (P&I)
- −$367
- Tax est. 1.5%
- −$87 /mo · $1,048/yr
- Insurance
- −$29
- HOA
- −$525
- Vacancy / Maint / Mgmt
- −$340
- Net cashflow
- $270
Break-even live
UW: 25.0% down · 7.5% · 30yr · 1.5% tax · 5.0% vac · 8.0% maint · 8.0% mgmt
Financing live
Cash to close
- Down payment
- $17,475
- Closing costs
- $2,097
- Reserves months
- —
- Total cash needed
- —
Loan-product check · same deal, 3 products live
Conventional
25% down · 7.5% · 30yr
- Down + closing
- —
- Monthly P&I
- —
- Monthly cashflow
- —
- DSCR
- —
- Eligible?
- —
Personal DTI + credit; lowest rate.
DSCR
20% down · 8.5% · 30yr
- Down + closing
- —
- Monthly P&I
- —
- Monthly cashflow
- —
- DSCR
- —
- Eligible?
- —
No personal income docs; deal must DSCR.
Hard money
10% down · 12.0% · 12mo
- Down + closing
- —
- Monthly P&I
- —
- Monthly cashflow
- —
- DSCR
- —
- Eligible?
- —
Short-term bridge; refi at stabilization.
Rent comps 5 comps
| Address | Beds | Baths | Sqft | Rent | $/sqft | DOM | Units | Dist |
|---|---|---|---|---|---|---|---|---|
| 4742 Eastern Ave SE Unit 205 Kentwood, MI | 2.0 | 1.5 | 1100 | $1,295 | $1.18 | 44d | 1 | 0.46mi |
| 5790 Madison Ave SE Unit 5790 Grand Rapids, MI | 3.0 | 1.0 | 1300 | $1,795 | $1.38 | 10d | 1 | 1.12mi |
| 1244 Katrina Dr SE Grand Rapids, MI | 3.0 | 1.5 | 1144 | $1,885 | $1.65 | 14d | 1 | 1.35mi |
| 4065 Pointe O Woods St SE Grand Rapids, MI | 1.0–2.0 | 1.0 | 850 | $1,549 | $1.82 | 2d | 18 | 1.46mi |
| 4179 Oak Park Dr SE Grand Rapids, MI | 2.0 | 1.0 | 850 | $1,200 | $1.41 | 43d | 1 | 1.46mi |
HOA detail
- Monthly dues
- $525 · $6,300/yr
Listing history 12 events
-
2026-06-14status $69,900 Pending 19 DOM
-
2026-06-10days on market $69,900 Active 19 DOM
-
2026-06-09days on market $69,900 Active 18 DOM
-
2026-06-08days on market $69,900 Active 17 DOM
-
2026-06-07days on market $69,900 Active 16 DOM
-
2026-06-03days on market $69,900 Active 12 DOM
-
2026-06-03days on market $69,900 Active 11 DOM
-
2026-06-01days on market $69,900 Active 10 DOM
-
2026-05-31days on market $69,900 Active 9 DOM
-
2026-05-22$69,900 Active
Show marketing remark (652 chars)
Beautifully maintained manufactured ranch-style home located in the desirable Windmill Pointe Community. Built in 2016, this spacious home features 3 bedrooms and 2 full bathrooms with a functional open-concept layout perfect for comfortable everyday living. The home offers a completely brand-new kitchen with modern cabinetry, countertops, and new appliances, making it truly move-in ready. Centrally located close to shopping, dining, schools, and major highways, this property combines convenience with affordability. Enjoy the spacious lot and peaceful community setting while still being near everything you need. New interior doors are on order.
-
2026-05-22$69,900 Active 652-char remark
Show marketing remark (652 chars)
Beautifully maintained manufactured ranch-style home located in the desirable Windmill Pointe Community. Built in 2016, this spacious home features 3 bedrooms and 2 full bathrooms with a functional open-concept layout perfect for comfortable everyday living. The home offers a completely brand-new kitchen with modern cabinetry, countertops, and new appliances, making it truly move-in ready. Centrally located close to shopping, dining, schools, and major highways, this property combines convenience with affordability. Enjoy the spacious lot and peaceful community setting while still being near everything you need. New interior doors are on order.
ⓘ Source: listings_history table (triggers on properties + properties_extension) + one-shot
backfill from property_details.listing_events for pre-trigger history.
Nearby sold comps map
Loading sold comps map…
Walkable amenities ~0.75 mi
Loading nearby amenities…
Taxation est. · year 1
- Rental income
- $19,413
- − Mortgage interest
- −$3,915
- − Property taxes
- −$1,048
- − Insurance
- −$350
- − Repairs & maintenance
- −$1,553
- − Management
- −$1,553
- − HOA
- −$6,300
- − Depreciation
- −$2,033
- Taxable income
- $2,660
- Est. tax owed @ 24.0%
- −$638
- After-tax cash flow
- $2,601/yr
For passive investors: Depreciation is non-cash, so a rental often shows a tax loss while cash-flowing — sheltering income. Rental losses are passive: they offset passive income freely, and up to $25,000/yr can offset ordinary (W-2) income if you actively participate and your MAGI is under $100k (phasing out to $0 by $150k); unused losses carry forward. On sale, claimed depreciation is recaptured at up to 25%, and gains may owe capital-gains tax (a 1031 exchange can defer both). Figures are a year-1 estimate at your 24.0% rate — not tax advice; consult a CPA.
Schools (NCES district)
- District
- Kelloggsville Public Schools
- NCES district ID
- 2620160
- Math proficiency
- 9% ▼ -6.00%
- Reading proficiency
- 32% ▲ 7.00%
- Median HH income
- $40,414
- Composite
- 17.32/100
- National rank
- #9082
- State rank
- #465 of 540 in MI
Livability — Kentwood
- Score
- 74/100
- State rank
- #191
- US rank
- #4892
Category grades
Schools grade is shown separately in the Schools card above.
Census & demographics
- Census place
- Kentwood, MI
- County
- Kent County · 533,805 people
- City population
- 130,591
- Metro
- Grand Rapids-Kentwood, MI
- Population (ZIP)
- 34,777
- Household income
- $61,636
- Rent vs Own
- Severe rent burden
- 781.0
Population outlook (Kent County) Hauer SSP2
- Today (2025)
- 712,484 people
- By 2030
- 748,618 · +5.1%
- By 2040
- 814,777 · +14.4%
- By 2050
- 868,556 · +21.9%
- By 2075
- 966,487 · +35.7%
- By 2100
- 967,975 · +35.9%
Race, ethnicity, and origin ACS 2023
- Neighborhood character
- Diverse neighborhood (Simpson 0.68)
- Race & ethnicity
- White 49% Hispanic / Latino 22% Two or more races 16% Black 15% Asian 6% Native American 1%
- Hispanic origin (detail)
- Mexican 15% Puerto Rican 4%
- Common ancestry
- Iranian 10% Romanian 4% Lithuanian 2%
- Foreign-born
- 13% · Canada, Vietnam, China
- Languages at home
- 78% English-only · Spanish 14% Vietnamese 2% French/Haitian/Cajun 1%
Political lean MEDSL · Kent
- 2024 margin
- Lean D (+5.4) · D 51.8% · R 46.5% · Other 1.7%
- 2008→2024 swing
- +4.8pp toward D · 2008: 0.5pp · 2024: 5.4pp
- All cycles
- 2024: D+5.4 2020: D+6.1 2016: R+3.1 2012: R+7.9 2008: D+0.5
Not yet ingested
- Civics
- —
Market trends
- HPI YoY
- ▼ -208.41%
- Current HPI
- 325.8096
- Rent YoY
- —
- Metro
- Grand Rapids-Kentwood, MI
- State GDP YoY
- ▲ 1.37%
- F500 in state
- 28
Industry mix (Fortune 500 HQ in MI)
| Industry | F500 HQs | Revenue |
|---|---|---|
| Automotive Parts | 3 | $48B |
|
||
| Automotive | 2 | $372B |
|
||
| Chemicals | 1 | $45B |
|
||
| Automotive Retail | 1 | $29B |
|
||
| Healthcare / Medical Devices | 1 | $23B |
|
||
| Automotive Technology | 1 | $20B |
|
||
Price history
+0.0% since first listed3 events — show timeline
- 2026-05-22 Listed $69,900 MiRealSource-MiMLS
- 2026-05-22 Listed $69,900 REALCOMP
- 2026-05-22 Listed $69,900 SW Michigan MLS
Property tax history
-1.6%/yrLatest (2025): $31 · -30.7% YoY. Source: county tax records.
Cash-flow waterfall
monthlySold comps — $/sqft
last 12 mo · ≤1 miLoading sold comps…