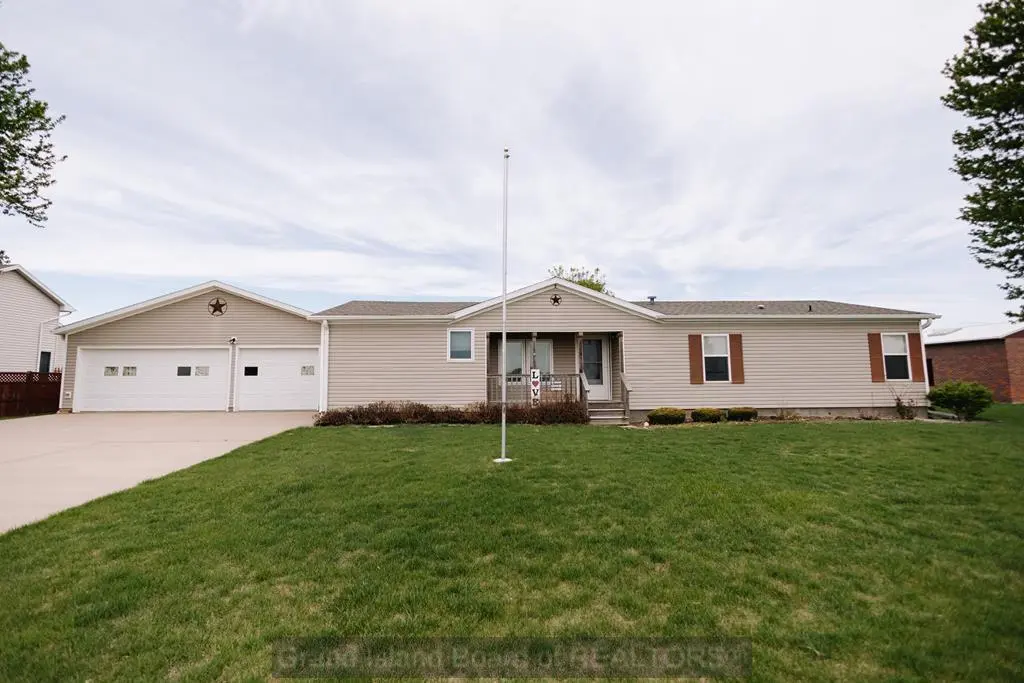
703 B St · Hampton, NE
Flood risk 1/10 · Minimal
- FEMA flood zone
- X (unshaded)
- Chance of flooding over 30 yrs
- 0.0%
- Est. flood insurance / yr
- $507 – $1,088
Fire risk 1/10 · Minimal
- Est. fire insurance / yr
- $1,161 – $2,155
Heat risk 3/10 · Minor
- Hot days now (above 103°F)
- 7 days/yr
- Hot days in 30 yrs
- 15 days/yr
Wind risk 2/10 · Minimal
- Chance of severe wind over 30 yrs
- —
Air-quality risk 1/10 · Minimal
- Unhealthy air days now
- 0 days/yr
- Unhealthy air days in 30 yrs
- 0 days/yr
Risk factors via First Street. Map © Google.
Why this score? — see what drove the D- grade
The composite is a weighted blend of 9 inputs, each scored 0–100. Each bar is that input's sub-score; the figure is the points it added to the 100-point composite (weight × sub-score).
- ARV discount +12.4/15.0
- Cash flow +6.9/30.0
- Schools +5.9/10.0
- Appreciation +4.4/10.0
- Livability +3.6/5.0
- Rent growth +2.5/5.0
- Condition / age +2.5/5.0
- DSCR +1.1/10.0
- 1% rule +0.6/10.0
$215,000
🖨 Deal sheet 📄 Offer letter ✓ Due diligence
Listing remarks
Located in a desirable and developing area, this 3 bedroom, 2 bathroom home is full of potential and ready for its next chapter. Offering great bones, generous living space, and room for modern updates, this property is a fantastic opportunity whether you're a first-time homebuyer looking to build equity or an investor searching for your next project. Outside, you'll find a large shed in the backyard providing plenty of extra storage or workspace possibilities. A great opportunity in an up-and-coming neighborhood with tons of potential!
Key facts
- Extra storage
- Large shed
- Developing area
Tags
Property features AI
Exterior
- Parking: 3-car garage with garage door opener
- Utilities: Natural gas available
- Home design: Manufactured single-family home
- Construction: Asphalt roof
- Exterior features: Patio; Shed(s)
Interior
- Kitchen: Disposal; Electric water heater; Water softener
- Bedrooms: 3 main level bedrooms
- Bathrooms: 2 full bathrooms
- Heating & cooling: Forced air heating; Central air conditioning
- Interior features: Window coverings; Smoke detectors; Crawl space basement
- Laundry & utility: Laundry on main level
Neighborhood map
What this means for you Summary
Snapshot
- This is a 3-bed/2.0-bath single-family listed at $215k.
Deal economics
- At list price, monthly cash flow is $-329 ($-4k/yr) — negative.
- To cash-flow at today's rent, offer at most $157k (27.0% below list).
- To meet the 1% rule (rent ≥ 1% of price), the offer needs to be $120k (44.0% below list).
- Recommended offer: $120k (44.0% below list) — sets the bar for 1% rule.
Location & tenants
- Location reads 71/100 on livability (#202 in NE) — a middle-class / working-renter tenant base. Strengths: cost of living A+, housing A+; Watch: health & safety C-, amenities F, commute F.
- Hampton Public School (rural): math 70% / reading 65% proficiency, ranked #21 of 245 in NE (top 9%) — acceptable for families but not a draw, mixed tenant base, ~2y average lease; only 19% free/reduced lunch — higher-income household profile.
- Zoned schools: Hampton Elementary School (math 54% / reading 54%, grade C, #161 of 502 statewide, top 38%, 110 students, 26% FRL); Hampton High School (math 54% / reading 54%, grade C-, #80 of 261 statewide, top 37%, 81 students, 31% FRL).
- Zoned-school proficiency averages 54% at this address vs 68% district-wide (-13 pts) — the specific schools serving this property underperform the Hampton Public School average; the district grade overstates school quality for this exact location.
- Market conditions: 17 active listings in the ZIP; 47 units permitted in Hamilton County in 2024 (8 in 5+ unit buildings).
Forward outlook
- Local home prices are declining (-1.3%/yr); year-one equity from $1k of loan paydown is wiped out by about $3k of value loss. Plan a longer hold.
Negotiation context
- It's been on market 38 days — a 3% lower offer ($209k) is reasonable based on typical stale-listing flexibility.
- Current owner paid $89k; list at $215k implies a 142% gain — meaningful room to come down on a strong offer.
Questions for the listing agent
- What do current leases actually rent for vs. the listed asking? Can we see a recent rent roll and the last 12 months of T-12 income?
- It's been on market 38 days. Have you received any prior offers? Is the seller open to a 44% concession, seller financing, or rate buy-down credit?
- Is there a deadline driving the sale (1031 exchange, divorce, estate, relocation)? That informs how much negotiation room exists.
- Schools are A-rated — typically a magnet for longer-tenancy family renters. What's the average tenant stay here, and is there a school-zone premium baked into asking?
- The area grade is low — what's the realistic commute time and amenity access for the typical tenant pool here? Any planned neighborhood developments (good or bad) we should know about?
- What's the average days-on-market for RENTAL listings here right now (not sales)? A rising rental-DOM trend means longer vacancies and softer asking-rent achievability than the comps imply.
- What's the recent tenant-quality profile in this submarket — average credit score on applications, eviction rate, late-payment / NSF rate, and stable-employment percentage? A property-management company in the area should have these aggregated.
- How much new for-sale + rental construction is in the pipeline within 1–3 miles? Heavy new supply typically softens prices + rents 12–24 months out; constrained supply supports both.
Investment metrics
- 1% rule
- 0.56% ✗
- Cap rate
- 4.46%
- Cash-on-cash
- -6.56%
- DSCR
- 0.71
- GRM
- 14.9
CMA / ARV
- ARV (median comp)
- $241,524
- List price
- $215,000
- Delta
- -10.98%
- Verdict
- UNDERPRICED
- Comps
- 2 within 1.0 mi
Projected returns pro-forma
-1.29% appreciation · 3.0% rent growth · sell at horizon
- IRR
- -16.0%
- Equity multiple
- 0.33×
- Total profit
- $-40,049
- Equity at exit
- $48,915
- IRR
- -9.3%
- Equity multiple
- 0.21×
- Total profit
- $-47,627
- Equity at exit
- $48,864
Cash invested: $60,200 (down + closing). Projections, not guarantees.
Landlord ↔ Tenant lean methodology
- Overall (STATE)
- 83 Strongly Landlord-Friendly
- State Nebraska
- 83 Strongly Landlord-Friendly · R+13
- County
- — inherits STATE
- City
- — inherits STATE
ZIP-level market 68843
- Home prices YoY
- -0.6%
- Active inventory
- 17
- Price-to-rent
- 14.9×
Monthly cashflow live
- Estimated rent
- $1,204 medium interval (Pro) →
- Mortgage (P&I)
- −$1,127
- Tax from tax record
- −$63 /mo · $759/yr
- Insurance
- −$90
- HOA
- −$0
- Vacancy / Maint / Mgmt
- −$253
- Net cashflow
- $-329
Break-even live
UW: 25.0% down · 7.5% · 30yr · 1.5% tax · 5.0% vac · 8.0% maint · 8.0% mgmt
Financing live
Cash to close
- Down payment
- $53,750
- Closing costs
- $6,450
- Reserves months
- —
- Total cash needed
- —
Loan-product check · same deal, 3 products live
Conventional
25% down · 7.5% · 30yr
- Down + closing
- —
- Monthly P&I
- —
- Monthly cashflow
- —
- DSCR
- —
- Eligible?
- —
Personal DTI + credit; lowest rate.
DSCR
20% down · 8.5% · 30yr
- Down + closing
- —
- Monthly P&I
- —
- Monthly cashflow
- —
- DSCR
- —
- Eligible?
- —
No personal income docs; deal must DSCR.
Hard money
10% down · 12.0% · 12mo
- Down + closing
- —
- Monthly P&I
- —
- Monthly cashflow
- —
- DSCR
- —
- Eligible?
- —
Short-term bridge; refi at stabilization.
Listing history 14 events
-
2026-06-16status $215,000 Pending 38 DOM
-
2026-06-15days on market $215,000 Active 38 DOM
-
2026-06-13days on market $215,000 Active 36 DOM
-
2026-06-12days on market $215,000 Active 35 DOM
-
2026-06-09days on market $215,000 Active 32 DOM
-
2026-06-08days on market $215,000 Active 31 DOM
-
2026-06-07days on market $215,000 Active 30 DOM
-
2026-06-05days on market $215,000 Active 28 DOM
-
2026-06-04days on market $215,000 Active 26 DOM
-
2026-06-02days on market $215,000 Active 25 DOM
-
2026-06-01days on market $215,000 Active 24 DOM
-
2026-05-31days on market $215,000 Active 23 DOM
-
2026-05-08$215,000 Active 542-char remark
-
2007-09-08soldstatus $89,000
ⓘ Source: listings_history table (triggers on properties + properties_extension) + one-shot
backfill from property_details.listing_events for pre-trigger history.
Tax reassessment forecast NE · Resets to sale price
- Current annual tax
- $759 · $63/mo
- Projected year-2 tax
- $3,720 · $310/mo
- Expected delta
- +$2,961/yr (+$247/mo · 390.3%)
ⓘ Screening estimate from a state-policy table — verify with the county assessor before closing.
Climate risk First Street
- Flood 1/10 Low FEMA zone X (unshaded) · 0% chance over 30 yrs
- Wildfire 1/10 Low
- Heat 3/10 Moderate 7 d/yr ≥103°F today · 15 d/yr by 30 yrs out
- Wind 2/10 Low
- Air quality 1/10 Low 0 unhealthy d/yr today · 0 by 30 yrs out
Nearby sold comps map
Loading sold comps map…
Walkable amenities ~0.75 mi
Loading nearby amenities…
Taxation est. · year 1
- Rental income
- $14,451
- − Mortgage interest
- −$12,043
- − Property taxes
- −$759
- − Insurance
- −$1,075
- − Repairs & maintenance
- −$1,156
- − Management
- −$1,156
- − Depreciation
- −$6,255
- Taxable loss
- −$7,992
- Est. tax savings @ 24.0%
- +$1,918
- After-tax cash flow
- $-2,029/yr
For passive investors: Depreciation is non-cash, so a rental often shows a tax loss while cash-flowing — sheltering income. Rental losses are passive: they offset passive income freely, and up to $25,000/yr can offset ordinary (W-2) income if you actively participate and your MAGI is under $100k (phasing out to $0 by $150k); unused losses carry forward. On sale, claimed depreciation is recaptured at up to 25%, and gains may owe capital-gains tax (a 1031 exchange can defer both). Figures are a year-1 estimate at your 24.0% rate — not tax advice; consult a CPA.
Schools (NCES district)
- District
- Hampton Public School
- NCES district ID
- 3171370
- Math proficiency
- 70% ▲ 5.00%
- Reading proficiency
- 65% ▲ 10.00%
- Median HH income
- $54,302
- Composite
- 59.02/100
- National rank
- #1957
- State rank
- #21 of 245 in NE
Livability — Hampton
- Score
- 71/100
- State rank
- #202
- US rank
- #7210
Category grades
Schools grade is shown separately in the Schools card above.
Census & demographics
- Census place
- Hampton, NE
- Population (ZIP)
- 875
Population outlook (Hamilton County) Hauer SSP2
- Today (2025)
- 9,378 people
- By 2030
- 9,448 · +0.7%
- By 2040
- 9,536 · +1.7%
- By 2050
- 9,575 · +2.1%
- By 2075
- 10,358 · +10.4%
- By 2100
- 10,504 · +12.0%
Race, ethnicity, and origin ACS 2023
- Neighborhood character
- Predominantly White (93%)
- Race & ethnicity
- White 93% Two or more races 6% Hispanic / Latino 3%
- Common ancestry
- Romanian 5% Iranian 2% Portuguese 1%
- Foreign-born
- 0%
- Languages at home
- 99% English-only · Spanish 1%
Political lean MEDSL · Hamilton
- 2024 margin
- Solid R (+60.4) · D 19.2% · R 79.6% · Other 1.1%
- 2008→2024 swing
- -17.5pp toward R · 2008: -42.9pp · 2024: -60.4pp
- All cycles
- 2024: R+60.4 2020: R+57.3 2016: R+59.0 2012: R+50.7 2008: R+42.9
Not yet ingested
- Civics
- —
Market trends
- HPI YoY
- ▼ -1.29%
- Current HPI
- 223.3443
- Rent YoY
- —
- Metro
- —
- State GDP YoY
- ▲ 0.68%
- F500 in state
- 2
Industry mix (Fortune 500 HQ in NE)
| Industry | F500 HQs | Revenue |
|---|---|---|
| Conglomerate | 1 | $371B |
|
||
Price history
+141.6% since first listed3 events — show timeline
- 2026-06-15 Pending — GIBOR
- 2026-05-08 Listed $215,000 GIBOR
- 2007-09-08 Sold (Public Records) $89,000 Public Records
Property tax history
-3.9%/yrLatest (2025): $759 · +149.1% YoY. Source: county tax records.
Cash-flow waterfall
monthlySold comps — $/sqft
last 12 mo · ≤1 miLoading sold comps…