 Duplex
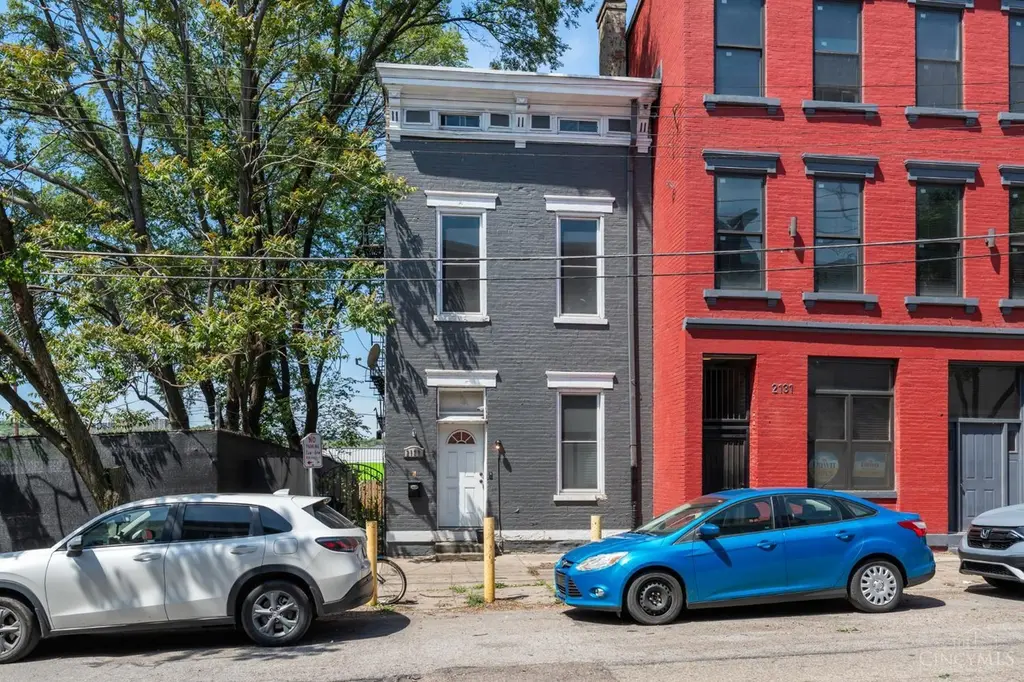
2129 Colerain Ave · Cincinnati, OH
Flood risk 1/10 · Minimal
- FEMA flood zone
- X (unshaded)
- Chance of flooding over 30 yrs
- 0.0%
- Est. flood insurance / yr
- $473 – $860
Fire risk 1/10 · Minimal
- Est. fire insurance / yr
- $713 – $1,323
Heat risk 5/10 · Moderate
- Hot days now (above 103°F)
- 7 days/yr
- Hot days in 30 yrs
- 21 days/yr
Wind risk 2/10 · Minimal
- Chance of severe wind over 30 yrs
- 1.0%
Air-quality risk 3/10 · Minor
- Unhealthy air days now
- 2 days/yr
- Unhealthy air days in 30 yrs
- 3 days/yr
Risk factors via First Street. Map © Google.
Why this score? — see what drove the A grade
The composite is a weighted blend of 9 inputs, each scored 0–100. Each bar is that input's sub-score; the figure is the points it added to the 100-point composite (weight × sub-score).
- Cash flow +30.0/30.0
- ARV discount +15.0/15.0
- 1% rule +10.0/10.0
- DSCR +10.0/10.0
- Appreciation +10.0/10.0
- Rent growth +4.5/5.0
- Livability +4.0/5.0
- Schools +2.5/10.0
- Condition / age +2.5/5.0
$241,000
🖨 Deal sheet 📄 Offer letter ✓ Due diligence
Multi-family units
County records classify this as Multi-Family (2-4 Unit). Listing-text estimate: 2 units. confirmed
Listing remarks MLS
Incredible opportunity to own this duplex in the West End! Seller has spent years bring this 19th century home back to life and now it's ready for its next owner. From the updated units and mechanicals to the charming original touches, this property is move in ready and offers a lot of flexibility for your imagination. With one unit vacant and the second rented, this could be a great option for an owner-occupied, short term or long term rental. Schedule a showing and take advantage of this property and all that the West End and Downtown have to offer!
Key facts
- Updated units
- Original touches
- West end
Tags
Property features AI
Finance
- Financial info: Two total units: one 1-bedroom rented at $785 and one 3+ bedroom rented at $1,800
Exterior
- Parking: On-street parking
- Utilities: Public water; Public sewer; Natural gas
- Home design: Duplex; Three-or-more levels; Stone foundation
- Construction: Brick construction; Membrane roof
- Exterior features: Vinyl insulated windows; Inoperable fireplace
Interior
- Bedrooms: One 1-bedroom unit; One 3+ bedroom unit
- Bathrooms: Each unit has one full bathroom
- Heating & cooling: Forced-air gas heating; Central air conditioning
- Interior features: Full basement
Neighborhood map
What this means for you Summary
Snapshot
- This is a 2 × 2-bed/1.0-bath units multifamily listed at $241k.
Deal economics
- At list price, monthly cash flow is $1k ($15k/yr) — positive. Per door: $644/mo.
- The deal already cash-flows at list — no discount required.
- Meets the 1% rule at list price ($4k rent vs $241k).
- Recommended offer: $234k (3.0% below list) — sets the bar for market timing.
- Cap rate 12.7% vs local median 3.9% in Cincinnati — top-decile yield for the area; either an underpriced asset or a hidden risk that comps aren't pricing in. Stress-test before assuming the spread holds.
Location & tenants
- Location reads 80/100 on livability (#130 in OH, #1,856 nationally) — a professional / high-income tenant draw. Strengths: amenities A+, commute A+, cost of living A+; Watch: employment D, crime F.
- Cincinnati Public Schools (urban): math 25% / reading 36% proficiency, ranked #581 of 656 in OH (top 89%) — families likely to look elsewhere, expect single-tenant / working-renter base with shorter leases; 70% free/reduced lunch — lower-income household profile, screen leases tightly.
- Market conditions: Rents rising fast (+8.1%/yr); 67 active listings in the ZIP; 7 comparable units currently listed for rent nearby; rentals leasing fast (median 13d on market — plan ~1-2 weeks tenant-placement turnaround); lower-income renter base — watch delinquency; 801 units permitted in Hamilton County in 2024 (190 in 5+ unit buildings).
- At $3,734/mo this rent would consume 161% of the median local household income ($28k/yr) (locally 857% of renters already pay >50% of income on rent) — very limited rent-growth headroom before tenants either downsize or default.
Forward outlook
- In year one you build about $26k of equity ($2k loan paydown + $24k appreciation (10.0% local appreciation)).
- At projected returns (10.0% appreciation + 8.0% rent growth), your $67k cash investment doubles in ~2 years — after that, you're playing with house money.
- By year 2, paydown + projected appreciation supports a ~$41k cash-out refi (75% LTV) — recoverable capital for the next deal without selling this one.
Negotiation context
- It's been on market 41 days — a 3% lower offer ($234k) is reasonable based on typical stale-listing flexibility.
- 4 sale attempts since 8y ago; this cycle's ask has dropped $14k (5%) from the opening price — seller is motivated, your offer sets the floor, not the list.
- Current owner paid $58k; list at $241k implies a 316% gain — meaningful room to come down on a strong offer.
Risks & watch-outs
- Watch-outs: built in 1890 — expect roof / HVAC / electrical / plumbing capex.
- Climate carrying-cost: extreme-heat days projected 7→21/yr by 2055 (HVAC capex compounding) — expect insurance premiums to compound above CPI over the hold.
Questions for the listing agent
- It's been on market 41 days. Have you received any prior offers? Is the seller open to a 3% concession, seller financing, or rate buy-down credit?
- Can we see the unit-by-unit rent roll, current vacancy, and any below-market leases? What's the average tenancy length?
- What capital expenditures (roof, boiler, parking lot, exteriors) have been made in the last 5 years, and what's planned in the next 2?
- Built in 1890 — when were the roof, HVAC, electrical panel, plumbing, and water heater last replaced?
- Is there a deadline driving the sale (1031 exchange, divorce, estate, relocation)? That informs how much negotiation room exists.
- Schools are B-rated — typically a magnet for longer-tenancy family renters. What's the average tenant stay here, and is there a school-zone premium baked into asking?
- Crime grade is F in this area — have there been break-ins, vandalism, or insurance claims at this property in the last 3 years? What carrier currently insures it and at what premium?
- What's the average days-on-market for RENTAL listings here right now (not sales)? A rising rental-DOM trend means longer vacancies and softer asking-rent achievability than the comps imply.
- What's the recent tenant-quality profile in this submarket — average credit score on applications, eviction rate, late-payment / NSF rate, and stable-employment percentage? A property-management company in the area should have these aggregated.
- How much new apartment / multifamily construction is in the pipeline within 1–3 miles? Heavy new supply (>2% of stock underway) typically softens rents 12–24 months out; light construction supports rent growth.
Investment metrics
- 1% rule
- 1.55% ✓
- Cap rate
- 12.70%
- Cash-on-cash
- 22.89%
- DSCR
- 2.02
- GRM
- 5.4
CMA / ARV
- ARV (on-the-fly)
- $301,716
- Comps found
- 5
Show comp detail 5 sales within ~0.75 mi
| Address | Dist | Beds/Ba | Sqft | Sold | Price | $/sf | Match |
|---|---|---|---|---|---|---|---|
| 305 Warner St | 0.59mi | 6/4.0 | 3,012 (+2%) | 5mo | $430,000 | $143 | 57 |
| 650 W Mcmicken Ave | 0.20mi | 6/4.0 | 3,294 (+11%) | 11mo | $175,000 | $53 | 54 |
| 2232 Flora St | 0.51mi | 5/3.0 (-1) | 2,844 (-4%) | 13mo | $290,000 | $102 | 50 |
| 1826 Logan St | 0.71mi | 6/3.0 | 3,132 (+6%) | 6mo | $430,000 | $137 | 48 |
| 1900 State Ave | 0.72mi | 5/2.0 (-1) | 3,186 (+8%) | 2mo | $190,000 | $60 | 47 |
Match score weights: distance 35% · size 25% · config 20% · recency 20%. Top-matched comps best support the ARV.
Projected returns pro-forma
10.0% appreciation · 8.0% rent growth · sell at horizon
- IRR
- 44.3%
- Equity multiple
- 4.45×
- Total profit
- $233,038
- Equity at exit
- $217,112
- IRR
- 40.4%
- Equity multiple
- 10.94×
- Total profit
- $670,774
- Equity at exit
- $468,210
Cash invested: $67,480 (down + closing). Projections, not guarantees.
Landlord ↔ Tenant lean methodology
- Overall (STATE)
- 73 Landlord-Friendly
- State Ohio
- 73 Landlord-Friendly · R+6
- County
- — inherits STATE
- City
- — inherits STATE
ZIP-level market 45214
- Home prices YoY
- 3.6%
- Rents YoY
- 8.1%
- Active inventory
- 67
- Price-to-rent
- 10.8×
Monthly cashflow live
- Estimated rent
- $3,734 high interval (Pro) →
- Mortgage (P&I)
- −$1,264
- Tax from tax record
- −$298 /mo · $3,578/yr
- Insurance
- −$100
- HOA
- −$0
- Vacancy / Maint / Mgmt
- −$784
- Net cashflow
- $1,287
Break-even live
2-unit breakdown (identical units grouped — click to expand)
| Units | Beds | Baths | Est. rent |
|---|---|---|---|
| 2× units | 2 | 1 | $3,734 |
| #1 | 2 | 1 | $1,867 |
| #2 | 2 | 1 | $1,867 |
| Total (2 units) | $3,734 | ||
UW: 25.0% down · 7.5% · 30yr · 1.5% tax · 5.0% vac · 8.0% maint · 8.0% mgmt
Financing live
Cash to close
- Down payment
- $60,250
- Closing costs
- $7,230
- Reserves months
- —
- Total cash needed
- —
Loan-product check · same deal, 3 products live
Conventional
25% down · 7.5% · 30yr
- Down + closing
- —
- Monthly P&I
- —
- Monthly cashflow
- —
- DSCR
- —
- Eligible?
- —
Personal DTI + credit; lowest rate.
DSCR
20% down · 8.5% · 30yr
- Down + closing
- —
- Monthly P&I
- —
- Monthly cashflow
- —
- DSCR
- —
- Eligible?
- —
No personal income docs; deal must DSCR.
Hard money
10% down · 12.0% · 12mo
- Down + closing
- —
- Monthly P&I
- —
- Monthly cashflow
- —
- DSCR
- —
- Eligible?
- —
Short-term bridge; refi at stabilization.
Rent comps 7 comps
| Address | Beds | Baths | Sqft | Rent | $/sqft | DOM | Units | Dist |
|---|---|---|---|---|---|---|---|---|
| 2421 Fairview Ave Cincinnati, OH | 5.0 | 2.0 | 2400 | $3,300 | $1.38 | 23d | 1 | 0.55mi |
| 2017 Elm St Unit 1056145P Cincinnati, OH | 5.0 | 2.0 | 3939 | $7,694 | $1.95 | 12d | 1 | 0.67mi |
| 2317 Chickasaw St Cincinnati, OH | 5.0 | 2.0 | 2826 | $2,750 | $0.97 | 14d | 1 | 0.68mi |
| 122 W Elder St Unit 1056110P Cincinnati, OH | 5.0 | 3.0 | 3444 | $7,875 | $2.29 | 1d | 1 | 0.80mi |
| 126 E 13th St Unit 1056025P Cincinnati, OH | 5.0 | 4.0 | 2960 | $5,339 | $1.80 | 3d | 1 | 1.32mi |
| 258 Dorchester Ave Unit 1056079P Cincinnati, OH | 6.0 | 3.0 | 3498 | $7,661 | $2.19 | 14d | 1 | 1.44mi |
| 1304 Broadway Unit 1056130P Cincinnati, OH | 1.0–5.0 | 1.0–4.0 | 2072 | $8,495 | $4.10 | 10d | 2 | 1.47mi |
Listing history 29 events
-
2026-06-18days on market $241,000 Active 41 DOM
-
2026-06-17price $241,000 Active 40 DOM
-
2026-06-17days on market $248,000 Active 40 DOM
-
2026-06-16days on market $248,000 Active 39 DOM
-
2026-06-15days on market $248,000 Active 38 DOM
-
2026-06-13days on market $248,000 Active 36 DOM
-
2026-06-13pricedays on market $248,000 Active 35 DOM
-
2026-06-09days on market $249,000 Active 32 DOM
-
2026-06-08days on market $249,000 Active 31 DOM
-
2026-06-07days on market $249,000 Active 30 DOM
-
2026-06-03days on market $249,000 Active 26 DOM
-
2026-06-02days on market $249,000 Active 25 DOM
-
2026-06-01days on market $249,000 Active 24 DOM
-
2026-05-31days on market $249,000 Active 23 DOM
-
2026-05-19price $250,000
-
2026-05-08$255,000 Active
-
2026-05-04historical 558-char remark
Show marketing remark (558 chars)
Incredible opportunity to own this duplex in the West End! Seller has spent years bring this 19th century home back to life and now it's ready for its next owner. From the updated units and mechanicals to the charming original touches, this property is move in ready and offers a lot of flexibility for your imagination. With one unit vacant and the second rented, this could be a great option for an owner-occupied, short term or long term rental. Schedule a showing and take advantage of this property and all that the West End and Downtown have to offer!
-
2026-04-23$260,000 Active 558-char remark
Show marketing remark (558 chars)
Incredible opportunity to own this duplex in the West End! Seller has spent years bring this 19th century home back to life and now it's ready for its next owner. From the updated units and mechanicals to the charming original touches, this property is move in ready and offers a lot of flexibility for your imagination. With one unit vacant and the second rented, this could be a great option for an owner-occupied, short term or long term rental. Schedule a showing and take advantage of this property and all that the West End and Downtown have to offer!
-
2019-03-04soldstatus $58,000 Sold 304-char remark
Show marketing remark (304 chars)
Motivated seller for this property that has so much potential! This centrally located 2 unit building is ready to be brought back to life. Newly painted and completely cleaned out on the inside. Walk to Findlay Market and the new FC Cincinnati stadium. Great opportunity, don't let this one get away!
-
2019-01-18historical Accept Backup Offers 304-char remark
Show marketing remark (304 chars)
Motivated seller for this property that has so much potential! This centrally located 2 unit building is ready to be brought back to life. Newly painted and completely cleaned out on the inside. Walk to Findlay Market and the new FC Cincinnati stadium. Great opportunity, don't let this one get away!
-
2018-12-18price $64,900 304-char remark
Show marketing remark (304 chars)
Motivated seller for this property that has so much potential! This centrally located 2 unit building is ready to be brought back to life. Newly painted and completely cleaned out on the inside. Walk to Findlay Market and the new FC Cincinnati stadium. Great opportunity, don't let this one get away!
-
2018-11-05price $74,900 304-char remark
Show marketing remark (304 chars)
Motivated seller for this property that has so much potential! This centrally located 2 unit building is ready to be brought back to life. Newly painted and completely cleaned out on the inside. Walk to Findlay Market and the new FC Cincinnati stadium. Great opportunity, don't let this one get away!
-
2018-10-23price $80,000 304-char remark
Show marketing remark (304 chars)
Motivated seller for this property that has so much potential! This centrally located 2 unit building is ready to be brought back to life. Newly painted and completely cleaned out on the inside. Walk to Findlay Market and the new FC Cincinnati stadium. Great opportunity, don't let this one get away!
-
2018-09-30price $85,000 304-char remark
Show marketing remark (304 chars)
Motivated seller for this property that has so much potential! This centrally located 2 unit building is ready to be brought back to life. Newly painted and completely cleaned out on the inside. Walk to Findlay Market and the new FC Cincinnati stadium. Great opportunity, don't let this one get away!
-
2018-09-04$90,000 Active 304-char remark
Show marketing remark (304 chars)
Motivated seller for this property that has so much potential! This centrally located 2 unit building is ready to be brought back to life. Newly painted and completely cleaned out on the inside. Walk to Findlay Market and the new FC Cincinnati stadium. Great opportunity, don't let this one get away!
-
2018-05-03soldstatus $25,000
-
2018-04-27soldstatus $25,000 Sold
-
2018-04-23historical Accept Backup Offers
-
2018-04-16$40,000 Active
ⓘ Source: listings_history table (triggers on properties + properties_extension) + one-shot
backfill from property_details.listing_events for pre-trigger history.
Tax reassessment forecast OH · Partial reset (capped growth)
- Current annual tax
- $3,578 · $298/mo
- Projected year-2 tax
- $3,669 · $306/mo
- Expected delta
- +$91/yr (+$8/mo · 2.5%)
ⓘ Screening estimate from a state-policy table — verify with the county assessor before closing.
Climate risk First Street
- Flood 1/10 Low FEMA zone X (unshaded) · 0% chance over 30 yrs
- Wildfire 1/10 Low
- Heat 5/10 Major 7 d/yr ≥103°F today · 21 d/yr by 30 yrs out
- Wind 2/10 Low 100% chance of damaging wind over 30 yrs
- Air quality 3/10 Moderate 2 unhealthy d/yr today · 3 by 30 yrs out
Nearby sold comps map
Loading sold comps map…
Walkable amenities ~0.75 mi
Loading nearby amenities…
Taxation est. · year 1
- Rental income
- $44,808
- − Mortgage interest
- −$13,500
- − Property taxes
- −$3,578
- − Insurance
- −$1,205
- − Repairs & maintenance
- −$3,585
- − Management
- −$3,585
- − Depreciation
- −$7,011
- Taxable income
- $12,345
- Est. tax owed @ 24.0%
- −$2,963
- After-tax cash flow
- $12,486/yr
For passive investors: Depreciation is non-cash, so a rental often shows a tax loss while cash-flowing — sheltering income. Rental losses are passive: they offset passive income freely, and up to $25,000/yr can offset ordinary (W-2) income if you actively participate and your MAGI is under $100k (phasing out to $0 by $150k); unused losses carry forward. On sale, claimed depreciation is recaptured at up to 25%, and gains may owe capital-gains tax (a 1031 exchange can defer both). Figures are a year-1 estimate at your 24.0% rate — not tax advice; consult a CPA.
Schools (NCES district)
- District
- Cincinnati Public Schools
- NCES district ID
- 3904375
- Math proficiency
- 25% ▼ -19.00%
- Reading proficiency
- 36% ▼ -14.00%
- Median HH income
- $35,743
- Composite
- 25.21/100
- National rank
- #7508
- State rank
- #581 of 656 in OH
Livability — Cincinnati
- Score
- 80/100
- State rank
- #130
- US rank
- #1856
Category grades
Schools grade is shown separately in the Schools card above.
Census & demographics
- Census place
- Cincinnati, OH
- County
- Hamilton County · 701,295 people
- City population
- 505,555
- Metro
- Cincinnati, OH-KY-IN
- Population (ZIP)
- 8,630
- Household income
- $27,852
- Rent vs Own
- Severe rent burden
- 857.0
Population outlook (Hamilton County) Hauer SSP2
- Today (2025)
- 826,054 people
- By 2030
- 830,947 · +0.6%
- By 2040
- 832,319 · +0.8%
- By 2050
- 822,428 · -0.4%
- By 2075
- 788,688 · -4.5%
- By 2100
- 710,674 · -14.0%
Race, ethnicity, and origin ACS 2023
- Neighborhood character
- Majority Black (63%)
- Race & ethnicity
- Black 63% White 27% Two or more races 7% Hispanic / Latino 3%
- Common ancestry
- Romanian 1%
- Foreign-born
- 2% · Canada
- Languages at home
- 97% English-only · Spanish 1% Other Indo-European 1%
Political lean MEDSL · Hamilton
- 2024 margin
- D (+14.9) · D 57.0% · R 42.1%
- 2008→2024 swing
- +7.9pp toward D · 2008: 7.0pp · 2024: 14.9pp
- All cycles
- 2024: D+14.9 2020: D+15.9 2016: D+9.5 2012: D+4.9 2008: D+7.0
Not yet ingested
- Civics
- —
Market trends
- HPI YoY
- ▲ 15.01%
- Current HPI
- 433.2346
- Rent YoY
- ▲ 8.09%
- Metro
- Cincinnati, OH-KY-IN
- State GDP YoY
- ▲ 1.98%
- F500 in state
- 48
Industry mix (Fortune 500 HQ in OH)
| Industry | F500 HQs | Revenue |
|---|---|---|
| Insurance | 3 | $145B |
|
||
| Industrial Machinery | 3 | $49B |
|
||
| Financial Services | 3 | $24B |
|
||
| Consumer Goods | 2 | $93B |
|
||
| Aerospace / Defense | 2 | $47B |
|
||
| Utilities | 2 | $33B |
|
||
Price history
+525.0% since first listed15 events — show timeline
- 2026-05-19 Price Changed $250,000 Cincy MLS
- 2026-05-08 Listed $255,000 Cincy MLS
- 2026-05-04 Listing Removed — Cincy MLS
- 2026-04-23 Listed $260,000 Cincy MLS
- 2019-03-04 Sold (MLS) $58,000 Cincy MLS
- 2019-01-18 Contingent — Cincy MLS
- 2018-12-18 Price Changed $64,900 Cincy MLS
- 2018-11-05 Price Changed $74,900 Cincy MLS
- 2018-10-23 Price Changed $80,000 Cincy MLS
- 2018-09-30 Price Changed $85,000 Cincy MLS
- 2018-09-04 Listed $90,000 Cincy MLS
- 2018-05-03 Sold (Public Records) $25,000 Public Records
- 2018-04-27 Sold (MLS) $25,000 Cincy MLS
- 2018-04-23 Contingent — Cincy MLS
- 2018-04-16 Listed $40,000 Cincy MLS
Property tax history
+23.9%/yrLatest (2025): $3,578 · +1.7% YoY. Source: county tax records.
Cash-flow waterfall
monthlySold comps — $/sqft
last 12 mo · ≤1 miLoading sold comps…