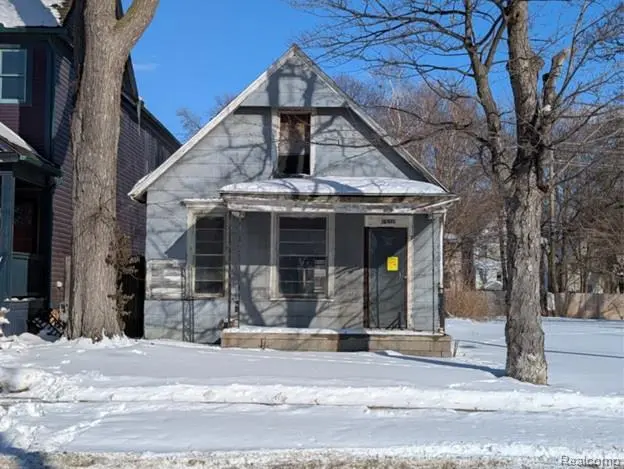
1532 Van Dyke St · Detroit, MI
Flood risk 1/10 · Minimal
- FEMA flood zone
- X (unshaded)
- Chance of flooding over 30 yrs
- 0.0%
- Est. flood insurance / yr
- $473 – $860
Fire risk 1/10 · Minimal
- Est. fire insurance / yr
- $784 – $1,456
Heat risk 3/10 · Minor
- Hot days now (above 96°F)
- 7 days/yr
- Hot days in 30 yrs
- 15 days/yr
Wind risk 2/10 · Minimal
- Chance of severe wind over 30 yrs
- —
Air-quality risk 3/10 · Minor
- Unhealthy air days now
- 2 days/yr
- Unhealthy air days in 30 yrs
- 5 days/yr
Risk factors via First Street. Map © Google.
Why this score? — see what drove the D grade
The composite is a weighted blend of 9 inputs, each scored 0–100. Each bar is that input's sub-score; the figure is the points it added to the 100-point composite (weight × sub-score).
- Cash flow +15.0/30.0
- ARV discount +7.5/15.0
- 1% rule +5.0/10.0
- DSCR +5.0/10.0
- Livability +3.7/5.0
- Rent growth +2.5/5.0
- Condition / age +2.5/5.0
- Schools +1.3/10.0
- Appreciation +0.0/10.0
$1
🖨 Deal sheet (PDF) 📄 Offer letter ✓ Due diligence
Listing remarks MLS
* * * Please Read All The Remarks To Ensure Your Full Understanding of What's Being Offered * * * A rare opportunity to rescue a late nineteenth century West Village cottage and give it a second life. This modest wood framed home dates to the late 1800s and is currently vacant. City historic staff have identified the structure as salvageable. Notable features include distinctive horizontally divided wood sash and remaining traditional trim details. The structure is one story and does not have a basement. These offerings are for the historic structure only. No land is included. The structure is being made available at no cost to a qualified recipient who is willing and able to fund all expenses associated with preservation, deconstruction, lifting, loading, transportation, permits, site safety, insurance, and any required restoration of the origin site. The structure is conveyed as is, where is, with all faults, and with no representations or warranties. Interior access, room count, bathroom count, square footage, and all structural conditions are not represented and must be independently verified by the recipient. Brokers and prospective purchasers should not rely on the listing for accurate information. Broker to confirm all data. A waiver must be fully executed before any tours. This listing is offered in conjunction with MLS Listing # 20261008638.
Key facts
- 4,792 sq ft lot
- Built 1890
- Listed 127 days
Neighborhood map
What this means for you Summary
Snapshot
- This is a 1-bed/1.0-bath single-family listed at $1.
Deal economics
- At list price, monthly cash flow is $973 ($12k/yr) — positive.
- The deal already cash-flows at list — no discount required.
- Meets the 1% rule at list price ($1k rent vs $1).
- Cap rate 1167479.0% vs local median 10.2% in Detroit — top-decile yield for the area; either an underpriced asset or a hidden risk that comps aren't pricing in. Stress-test before assuming the spread holds.
Location & tenants
- Location reads 73/100 on livability (#218 in MI) — a middle-class / working-renter tenant base. Strengths: amenities A+, commute A+, cost of living A+; Watch: schools F, crime F, employment F.
- Detroit Public Schools Community District (urban): math 10% / reading 24% proficiency, ranked #499 of 540 in MI (top 92%) — low school quality limits family demand, transient renter base, plan for 1-2y turnover; 90% free/reduced lunch — lower-income household profile, screen leases tightly.
- Market conditions: 298 active listings in the ZIP; 40 comparable units currently listed for rent nearby; rentals at typical pace (median 25d on market — plan ~3-4 weeks tenant-placement turnaround); 42% of comp listings sitting > 30 days — soft ceiling on asking rent; lower-income renter base — watch delinquency; 2,639 units permitted in Wayne County in 2024 (1,216 in 5+ unit buildings).
- This rent runs 44% of the median local income ($34k/yr) — at the standard rent-burdened threshold; future hikes will face affordability resistance.
Forward outlook
- Local home prices are declining (-3.0%/yr); year-one equity from $0 of loan paydown is wiped out by about $0 of value loss. Plan a longer hold.
- Wayne County population projected at -17% by 2050 — secular population decline; favor cash flow + early exit over multi-decade hold.
- At projected returns (-3.0% appreciation + 3.0% rent growth), your $0 cash investment doubles in ~1 year — after that, you're playing with house money.
Negotiation context
- It's been on market 128 days — a 12% lower offer ($0) is reasonable based on typical stale-listing flexibility.
- 6 sale attempts since 8y ago with the ask held roughly flat each time — persistent listings suggest the price (not the market) is what's stuck; bring a comps-based counter.
Risks & watch-outs
- Watch-outs: built in 1890 — expect roof / HVAC / electrical / plumbing capex.
Questions for the listing agent
- It's been on market 128 days. Have you received any prior offers? Is the seller open to a 5% concession, seller financing, or rate buy-down credit?
- Built in 1890 — when were the roof, HVAC, electrical panel, plumbing, and water heater last replaced?
- Why hasn't it sold? Are there any deal-killer items the seller is aware of (foundation, flood, title, zoning, code violations)?
- Is there a deadline driving the sale (1031 exchange, divorce, estate, relocation)? That informs how much negotiation room exists.
- Schools are F-rated, which usually means shorter tenancies and higher turnover. Who's the typical renter profile here, and what's been the actual vacancy rate?
- Crime grade is F in this area — have there been break-ins, vandalism, or insurance claims at this property in the last 3 years? What carrier currently insures it and at what premium?
- The area grade is low — what's the realistic commute time and amenity access for the typical tenant pool here? Any planned neighborhood developments (good or bad) we should know about?
- What's the average days-on-market for RENTAL listings here right now (not sales)? A rising rental-DOM trend means longer vacancies and softer asking-rent achievability than the comps imply.
- What's the recent tenant-quality profile in this submarket — average credit score on applications, eviction rate, late-payment / NSF rate, and stable-employment percentage? A property-management company in the area should have these aggregated.
- How much new for-sale + rental construction is in the pipeline within 1–3 miles? Heavy new supply typically softens prices + rents 12–24 months out; constrained supply supports both.
Investment metrics
- 1% rule
- 123152.00% ✓
- Cap rate
- 1167478.96%
- Cash-on-cash
- 4169545.24%
- DSCR
- 185522.30
- GRM
- 0.0
CMA / ARV
- ARV (median comp)
- $191,835
- List price
- $1
- Delta
- -100.00%
- Verdict
- UNDERPRICED
- Comps
- 2 within 1.0 mi
Show comp detail 1 sale within ~0.75 mi
| Address | Dist | Beds/Ba | Sqft | Sold | Price | $/sf | Match |
|---|---|---|---|---|---|---|---|
| 2552 Beals St | 0.47mi | 2/1.0 (+1) | 805 (-3%) | 1mo | $184,999 | $230 | 68 |
Match score weights: distance 35% · size 25% · config 20% · recency 20%. Top-matched comps best support the ARV.
Projected returns pro-forma
-3.0% appreciation · 3.0% rent growth · sell at horizon
- IRR
- —
- Equity multiple
- 221367.24×
- Total profit
- $61,983
- Equity at exit
- $0
- IRR
- —
- Equity multiple
- 477992.13×
- Total profit
- $133,838
- Equity at exit
- $0
Cash invested: $0 (down + closing). Projections, not guarantees.
Landlord ↔ Tenant lean methodology
- Overall (STATE)
- 62 Landlord-Friendly
- State Michigan
- 62 Landlord-Friendly · EVEN
- County
- — inherits STATE
- City
- — inherits STATE
ZIP-level market 48214
- Active inventory
- 298
Monthly cashflow live
- Estimated rent
- $1,232 high interval (Pro) →
- Mortgage (P&I)
- −$0
- Tax est. 1.5%
- −$0 /mo · $0/yr
- Insurance
- −$0
- HOA
- −$0
- Vacancy / Maint / Mgmt
- −$259
- Net cashflow
- $973
Break-even live
Sensitivity live
| Price | -10% $973 | -5% $973 | +0% $973 | +5% $973 | +10% $973 |
|---|---|---|---|---|---|
| Rent | -10% $876 | -5% $924 | +0% $973 | +5% $1,022 | +10% $1,070 |
| Rate | -1.0pp $973 | -0.5pp $973 | base $973 | +0.5pp $973 | +1.0pp $973 |
UW: 25.0% down · 7.5% · 30yr · 1.5% tax · 5.0% vac · 8.0% maint · 8.0% mgmt
Financing live
Cash to close
- Down payment
- $0
- Closing costs
- $0
- Reserves months
- —
- Total cash needed
- —
Loan-product check · same deal, 3 products live
Conventional
25% down · 7.5% · 30yr
- Down + closing
- —
- Monthly P&I
- —
- Monthly cashflow
- —
- DSCR
- —
- Eligible?
- —
Personal DTI + credit; lowest rate.
DSCR
20% down · 8.5% · 30yr
- Down + closing
- —
- Monthly P&I
- —
- Monthly cashflow
- —
- DSCR
- —
- Eligible?
- —
No personal income docs; deal must DSCR.
Hard money
10% down · 12.0% · 12mo
- Down + closing
- —
- Monthly P&I
- —
- Monthly cashflow
- —
- DSCR
- —
- Eligible?
- —
Short-term bridge; refi at stabilization.
Rent comps 40 comps
| Address | Beds | Baths | Sqft | Rent | $/sqft | DOM | Units | Dist |
|---|---|---|---|---|---|---|---|---|
| 8001 Kercheval Ave Detroit, MI | 1.0–2.0 | 1.0–2.0 | 984 | $1,320 | $1.34 | 0d | 3 | 0.16mi |
| 1000 Van Dyke St Unit 602 Detroit, MI | 1.0 | 1.0 | 631 | $1,295 | $2.05 | 18d | 1 | 0.26mi |
| 1000 Van Dyke St Unit B02 Detroit, MI | 2.0 | 1.0 | 871 | $1,295 | $1.49 | 25d | 1 | 0.26mi |
| 1000 Van Dyke St Unit 205 Detroit, MI | 2.0 | 1.0 | 863 | $1,495 | $1.73 | 15d | 1 | 0.26mi |
| 1000 Van Dyke St Unit 402 Detroit, MI | 1.0 | 1.0 | 690 | $1,295 | $1.88 | 25d | 1 | 0.26mi |
| 1000 Van Dyke St Detroit, MI | 1.0–2.0 | 1.0 | 751 | $1,195 | $1.59 | 44d | 4 | 0.26mi |
| 7410 Kercheval Ave Unit 212 Detroit, MI | 2.0 | 2.0 | 1017 | $1,950 | $1.92 | 44d | 1 | 0.32mi |
| 666 Parker St Detroit, MI | 1.0 | 1.0 | 562 | $1,150 | $2.04 | 5d | 8 | 0.33mi |
| 7631 E Lafayette St Unit 16 Detroit, MI | 1.0 | 1.0 | 550 | $1,180 | $2.15 | 44d | 1 | 0.35mi |
| 1341 Crane St Detroit, MI | 1.0 | 1.0 | 750 | $995 | $1.33 | 2d | 1 | 0.44mi |
| 320 E Grand Blvd Detroit, MI | 1.0–2.0 | 1.0 | 534 | $850 | $1.59 | 44d | 4 | 0.46mi |
| 8100 E Jefferson Ave Detroit, MI | 3.0 | 1.0–3.0 | 1089 | $1,213 | $1.11 | 20d | 20 | 0.49mi |
| 7700 E Jefferson Ave Detroit, MI | 2.0 | 1.0 | 877 | $1,397 | $1.59 | 44d | 1 | 0.52mi |
| 7800 E Jefferson Ave Detroit, MI | 1.0–2.0 | 1.0 | 625 | $829 | $1.33 | 18d | 1 | 0.53mi |
| 8845 E Jefferson Apt 208 Detroit, MI | 2.0 | 1.5 | 992 | $1,635 | $1.65 | 44d | 1 | 0.54mi |
| 8845 E Jefferson Ave Unit 102 Detroit, MI | 1.0 | 1.5 | 800 | $1,350 | $1.69 | 44d | 1 | 0.55mi |
| 8845 E Jefferson Ave Unit 302 Detroit, MI | 2.0 | 2.0 | 885 | $1,460 | $1.65 | 44d | 1 | 0.55mi |
| 8845 E Jefferson Ave Unit 205 Detroit, MI | 2.0 | 1.5 | 960 | $1,425 | $1.48 | 44d | 1 | 0.55mi |
| 8845 E Jefferson Ave Unit 203 Detroit, MI | 2.0 | 1.5 | 1024 | $1,515 | $1.48 | 44d | 1 | 0.55mi |
| 8925 E Jefferson Ave Detroit, MI | 1.0–2.0 | 1.0–2.0 | 1050 | $900 | $0.86 | 44d | 9 | 0.57mi |
| 1130 Holcomb St Detroit, MI | 2.0 | 1.0 | 550 | $912 | $1.66 | 2d | 18 | 0.60mi |
| 2282 Belvidere St Unit 102 Detroit, MI | 2.0 | 2.0 | 1000 | $1,250 | $1.25 | 44d | 1 | 0.69mi |
| 3460 Field St Detroit, MI | 2.0 | 1.0 | 1000 | $1,260 | $1.26 | 5d | 1 | 0.80mi |
| 6533 E Jefferson Ave Detroit, MI | 2.0 | 1.0–2.0 | 1094 | $1,500 | $1.37 | 18d | 2 | 0.90mi |
| 6533 E Jefferson Ave Detroit, MI | 2.0 | 1.0–2.0 | 1181 | $1,500 | $1.27 | 25d | 3 | 0.90mi |
| 6533 E Jefferson Ave #421 Detroit, MI | 2.0 | 1.0 | 1063 | $2,200 | $2.07 | 15d | 1 | 0.90mi |
| 2544 Cadillac Blvd Unit 2 Detroit, MI | 2.0 | 1.0 | 973 | $825 | $0.85 | 24d | 1 | 0.95mi |
| 3511 Concord Ave Detroit, MI | 2.0 | 1.0 | 750 | $1,100 | $1.47 | 44d | 1 | 0.99mi |
| 3032 Hurlbut St Unit 1 Detroit, MI | 2.0 | 1.0 | 950 | $900 | $0.95 | 4d | 1 | 1.11mi |
| 200 Mount Elliott St Detroit, MI | 1.0 | 1.0 | 1050 | $2,000 | $1.90 | 44d | 1 | 1.13mi |
| 450 Marquette Dr Detroit, MI | 2.0 | 1.0 | 972 | $1,200 | $1.23 | 21d | 1 | 1.17mi |
| 3980 Helen St Detroit, MI | 2.0 | 1.0 | 800 | $845 | $1.06 | 17d | 1 | 1.18mi |
| 3495 Garland St Detroit, MI | 2.0 | 1.0 | 1100 | $900 | $0.82 | 44d | 1 | 1.29mi |
| 3501 Garland St Detroit, MI | 2.0 | 1.0 | 1000 | $900 | $0.90 | 25d | 1 | 1.29mi |
| 3500 E Jefferson Detroit, MI | 1.0–2.0 | 1.0–2.0 | 1012 | $1,840 | $1.82 | 2d | 5 | 1.31mi |
| 3320 Spinnaker Ln Detroit, MI | 1.0 | 1.0 | 740 | $1,550 | $2.09 | 44d | 1 | 1.38mi |
| 3049 Montclair St Unit 1 Detroit, MI | 2.0 | 1.0 | 850 | $950 | $1.12 | 44d | 1 | 1.41mi |
| 3755 Ellery St Unit 1 Detroit, MI | 2.0 | 1.0 | 915 | $1,200 | $1.31 | 25d | 1 | 1.43mi |
| 4190 Hurlbut St Unit 2 Detroit, MI | 2.0 | 1.0 | 900 | $945 | $1.05 | 15d | 1 | 1.45mi |
| 4735 Rohns St Unit 6A Detroit, MI | 2.0 | 1.0 | 850 | $1,100 | $1.29 | 2d | 1 | 1.46mi |
Listing history 25 events
-
2026-06-18days on market $1 Active 128 DOM
-
2026-06-17days on market $1 Active 127 DOM
-
2026-06-15days on market $1 Active 125 DOM
-
2026-06-13days on market $1 Active 123 DOM
-
2026-06-13days on market $1 Active 122 DOM
-
2026-06-09days on market $1 Active 119 DOM
-
2026-06-08days on market $1 Active 118 DOM
-
2026-06-07days on market $1 Active 117 DOM
-
2026-06-04days on market $1 Active 114 DOM
-
2026-06-03days on market $1 Active 113 DOM
-
2026-06-01days on market $1 Active 111 DOM
-
2026-05-31days on market $1 Active 110 DOM
-
2026-02-11$1 Active 1377-char remark
Show marketing remark (1377 chars)
* * * Please Read All The Remarks To Ensure Your Full Understanding of What's Being Offered * * * A rare opportunity to rescue a late nineteenth century West Village cottage and give it a second life. This modest wood framed home dates to the late 1800s and is currently vacant. City historic staff have identified the structure as salvageable. Notable features include distinctive horizontally divided wood sash and remaining traditional trim details. The structure is one story and does not have a basement. These offerings are for the historic structure only. No land is included. The structure is being made available at no cost to a qualified recipient who is willing and able to fund all expenses associated with preservation, deconstruction, lifting, loading, transportation, permits, site safety, insurance, and any required restoration of the origin site. The structure is conveyed as is, where is, with all faults, and with no representations or warranties. Interior access, room count, bathroom count, square footage, and all structural conditions are not represented and must be independently verified by the recipient. Brokers and prospective purchasers should not rely on the listing for accurate information. Broker to confirm all data. A waiver must be fully executed before any tours. This listing is offered in conjunction with MLS Listing # 20261008638.
-
2026-02-11$1 Active 1378-char remark
Show marketing remark (1377 chars)
* * * Please Read All The Remarks To Ensure Your Full Understanding of What's Being Offered * * * A rare opportunity to rescue a late nineteenth century West Village cottage and give it a second life. This modest wood framed home dates to the late 1800s and is currently vacant. City historic staff have identified the structure as salvageable. Notable features include distinctive horizontally divided wood sash and remaining traditional trim details. The structure is one story and does not have a basement. These offerings are for the historic structure only. No land is included. The structure is being made available at no cost to a qualified recipient who is willing and able to fund all expenses associated with preservation, deconstruction, lifting, loading, transportation, permits, site safety, insurance, and any required restoration of the origin site. The structure is conveyed as is, where is, with all faults, and with no representations or warranties. Interior access, room count, bathroom count, square footage, and all structural conditions are not represented and must be independently verified by the recipient. Brokers and prospective purchasers should not rely on the listing for accurate information. Broker to confirm all data. A waiver must be fully executed before any tours. This listing is offered in conjunction with MLS Listing # 20261008638.
-
2026-02-11historical $1 1377-char remark
Show marketing remark (1377 chars)
* * * Please Read All The Remarks To Ensure Your Full Understanding of What's Being Offered * * * A rare opportunity to rescue a late nineteenth century West Village cottage and give it a second life. This modest wood framed home dates to the late 1800s and is currently vacant. City historic staff have identified the structure as salvageable. Notable features include distinctive horizontally divided wood sash and remaining traditional trim details. The structure is one story and does not have a basement. These offerings are for the historic structure only. No land is included. The structure is being made available at no cost to a qualified recipient who is willing and able to fund all expenses associated with preservation, deconstruction, lifting, loading, transportation, permits, site safety, insurance, and any required restoration of the origin site. The structure is conveyed as is, where is, with all faults, and with no representations or warranties. Interior access, room count, bathroom count, square footage, and all structural conditions are not represented and must be independently verified by the recipient. Brokers and prospective purchasers should not rely on the listing for accurate information. Broker to confirm all data. A waiver must be fully executed before any tours. This listing is offered in conjunction with MLS Listing # 20261008638.
-
2022-09-25soldstatus $60,000 Sold
-
2022-09-25soldstatus $60,000 Closed
-
2018-12-14status Pending
-
2018-12-14status Pending
-
2018-11-06historical
-
2018-11-06historical
-
2018-11-05$60,000 Active
-
2018-11-05$60,000 Active
-
2018-11-05$60,000 Active
-
2018-11-05$60,000 Active
ⓘ Source: listings_history table (triggers on properties + properties_extension) + one-shot
backfill from property_details.listing_events for pre-trigger history.
Climate risk First Street
- Flood 1/10 Low FEMA zone X (unshaded) · 0% chance over 30 yrs
- Wildfire 1/10 Low
- Heat 3/10 Moderate 7 d/yr ≥96°F today · 15 d/yr by 30 yrs out
- Wind 2/10 Low
- Air quality 3/10 Moderate 2 unhealthy d/yr today · 5 by 30 yrs out
Nearby sold comps map
Loading sold comps map…
Walkable amenities ~0.75 mi
Loading nearby amenities…
Taxation est. · year 1
- Rental income
- $14,778
- − Mortgage interest
- −$0
- − Property taxes
- −$0
- − Insurance
- −$0
- − Repairs & maintenance
- −$1,182
- − Management
- −$1,182
- − Depreciation
- −$0
- Taxable income
- $12,414
- Est. tax owed @ 24.0%
- −$2,979
- After-tax cash flow
- $8,695/yr
For passive investors: Depreciation is non-cash, so a rental often shows a tax loss while cash-flowing — sheltering income. Rental losses are passive: they offset passive income freely, and up to $25,000/yr can offset ordinary (W-2) income if you actively participate and your MAGI is under $100k (phasing out to $0 by $150k); unused losses carry forward. On sale, claimed depreciation is recaptured at up to 25%, and gains may owe capital-gains tax (a 1031 exchange can defer both). Figures are a year-1 estimate at your 24.0% rate — not tax advice; consult a CPA.
Schools (NCES district)
- District
- Detroit Public Schools Community District
- NCES district ID
- 2601103
- Math proficiency
- 10% ▼ -2.00%
- Reading proficiency
- 24% ▲ 6.00%
- Median HH income
- $25,815
- Composite
- 13.06/100
- National rank
- #9564
- State rank
- #499 of 540 in MI
Livability — Detroit
- Score
- 73/100
- State rank
- #218
- US rank
- #5427
Category grades
Schools grade is shown separately in the Schools card above.
Census & demographics
- Census place
- Detroit, MI
- County
- Wayne County · 1,562,939 people
- City population
- 572,865
- Metro
- Detroit-Warren-Dearborn, MI
- Population (ZIP)
- 18,595
- Household income
- $33,544
- Rent vs Own
- Severe rent burden
- 1364.0
Population outlook (Wayne County) Hauer SSP2
- Today (2025)
- 1,675,273 people
- By 2030
- 1,620,300 · -3.3%
- By 2040
- 1,502,341 · -10.3%
- By 2050
- 1,384,039 · -17.4%
- By 2075
- 1,124,592 · -32.9%
- By 2100
- 881,193 · -47.4%
Race, ethnicity, and origin ACS 2023
- Neighborhood character
- Predominantly Black (79%)
- Race & ethnicity
- Black 79% White 16% Two or more races 4%
- Common ancestry
- Romanian 1% Iranian 1% Lithuanian 1%
- Foreign-born
- 3% · Canada, Jamaica
- Languages at home
- 98% English-only · Spanish 1%
Political lean MEDSL · Wayne
- 2024 margin
- Strong D (+29.0) · D 62.7% · R 33.7% · Other 3.6%
- 2008→2024 swing
- -20.5pp toward R · 2008: 49.5pp · 2024: 29.0pp
- All cycles
- 2024: D+29.0 2020: D+38.1 2016: D+37.3 2012: D+46.9 2008: D+49.5
Not yet ingested
- Civics
- —
Market trends
- HPI YoY
- ▼ -367.43%
- Current HPI
- 102.0969
- Rent YoY
- —
- Metro
- Detroit-Warren-Dearborn, MI
- State GDP YoY
- ▲ 1.37%
- F500 in state
- 28
Industry mix (Fortune 500 HQ in MI)
| Industry | F500 HQs | Revenue |
|---|---|---|
| Automotive Parts | 3 | $48B |
|
||
| Automotive | 2 | $372B |
|
||
| Chemicals | 1 | $45B |
|
||
| Automotive Retail | 1 | $29B |
|
||
| Healthcare / Medical Devices | 1 | $23B |
|
||
| Automotive Technology | 1 | $20B |
|
||
Price history
+0.0% since first listed13 events — show timeline
- 2026-02-11 Listed $1 MiRealSource-MiMLS
- 2026-02-11 Listed $1 REALCOMP
- 2026-02-11 Coming Soon $1 MiRealSource-MiMLS
- 2022-09-25 Sold (MLS) $60,000 MiRealSource-MiMLS
- 2022-09-25 Sold (MLS) $60,000 REALCOMP
- 2018-12-14 Pending — MiRealSource-MiMLS
- 2018-12-14 Pending — REALCOMP
- 2018-11-06 Listing Removed — REALCOMP
- 2018-11-06 Listing Removed — MiRealSource-MiMLS
- 2018-11-05 Listed $60,000 MiRealSource-MiMLS
- 2018-11-05 Listed $60,000 MiRealSource-MiMLS
- 2018-11-05 Listed $60,000 REALCOMP
- 2018-11-05 Listed $60,000 REALCOMP
Property tax history
+13.5%/yrLatest (2025): $964 · -53.7% YoY. Source: county tax records.
Cash-flow waterfall
monthlySold comps — $/sqft
last 12 mo · ≤1 miLoading sold comps…