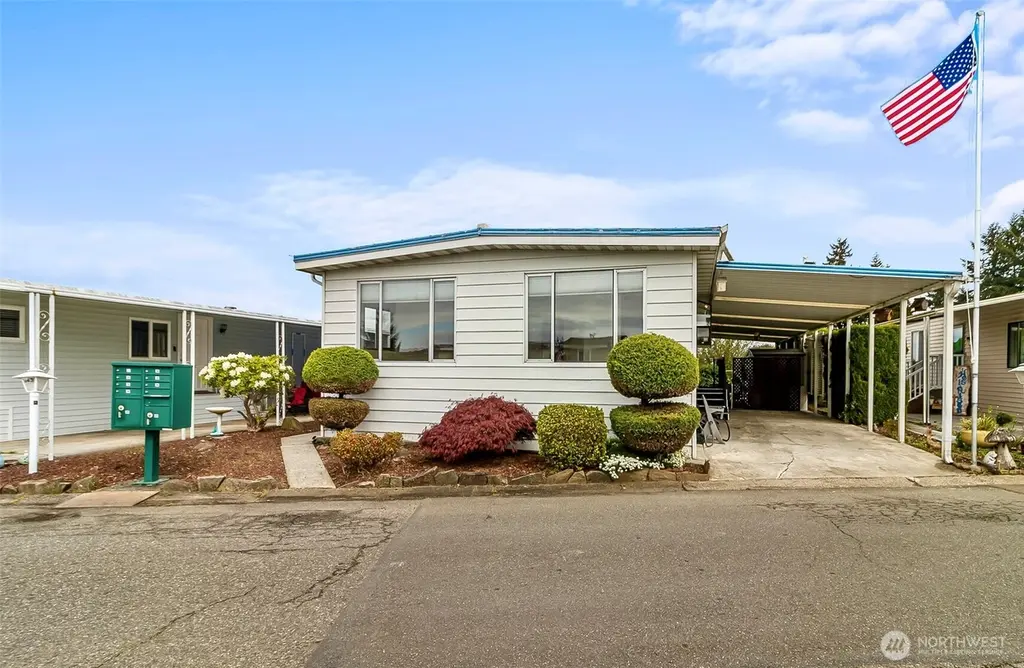
1415 84th St SE #143 · Everett, WA
Flood risk No data
- FEMA flood zone
- —
- Chance of flooding over 30 yrs
- —
- Est. flood insurance / yr
- —
Fire risk No data
- Est. fire insurance / yr
- —
Heat risk No data
- Hot days now (above threshold)
- —
- Hot days in 30 yrs
- —
Wind risk No data
- Chance of severe wind over 30 yrs
- —
Air-quality risk No data
- Unhealthy air days now
- —
- Unhealthy air days in 30 yrs
- —
Risk factors via First Street. Map © Google.
Why this score? — see what drove the B+ grade
The composite is a weighted blend of 9 inputs, each scored 0–100. Each bar is that input's sub-score; the figure is the points it added to the 100-point composite (weight × sub-score).
- Cash flow +30.0/30.0
- ARV discount +14.2/15.0
- 1% rule +10.0/10.0
- DSCR +10.0/10.0
- Schools +5.9/10.0
- Livability +3.7/5.0
- Condition / age +2.5/5.0
- Rent growth +1.7/5.0
- Appreciation +0.0/10.0
$109,000
🖨 Deal sheet 📄 Offer letter ✓ Due diligence
Listing remarks
Welcome to desirable Mobile Country Club, a family owned, well-maintained 55+ community featuring a fantastic clubhouse with 3 pool tables, weekly activities, including a gym, nice size pool & 2 bay car wash. This home offers 2 bedrooms & 2 bathrooms, with fresh paint throughout & newer flooring. The kitchen shines with granite countertops, 2 sky-lights & ample workspace. Enjoy year-round comfort with forced air heating, a heat pump / A/C. The spacious primary bedroom includes a generous closet, additional linen & coat storage, & a private en-suite bath. Two storage sheds provide plenty of space for hobbies, projects, or extra storage. On site RV parking
Key facts
- Two storage sheds
- On site rv parking
- Ample guest parking
Tags
Property features AI
Finance
- Other: Land lease amount applies; Park name: Mobile Country Club Park
- Financial info: Listing terms: Cash
- HOA & community: Senior community; Park approved for sale; Approximately 213 homes in the park; Land lease charged (monthly)
Exterior
- Parking: Carport; RV parking in the park
- Utilities: Public water (water service included in park lease); Public sewer (included in park lease); Power via PUD; Cable: Xfinity; Internet: Xfinity
- Home design: Manufactured double-wide home (one level); Style: Manufactured double wide; Skirting: metal and vinyl; Mobile home remains
- Construction: Metal/vinyl construction materials; Torch down roof; Pillar/post/pier foundation; Make: GoldW; Structure type: Manufactured house; Built as a double wide
- Exterior features: Metal/vinyl exterior; Curbs and paved access; Has a view; Park amenities include clubhouse, common area, exercise room, pool, RV parking
Interior
- Kitchen: Dishwasher; Microwave; Refrigerator; Stove/Range
- Bedrooms: 2 bedrooms
- Flooring: Laminate; Vinyl; Carpet
- Bathrooms: 2 full bathrooms (2 tubs, 2 showers); Primary bathroom with adjacent bath (Bath off primary)
- Heating & cooling: Forced air heating; Heat pump; Forced air cooling; Has heating and cooling
- Interior features: Water heater (gas) with exterior closet
- Laundry & utility: Community laundry available in park
Neighborhood map
What this means for you Summary
Snapshot
- This is a 3-bed/2.0-bath manufactured listed at $109k.
Deal economics
- At list price, monthly cash flow is $1k ($15k/yr) — positive.
- The deal already cash-flows at list — no discount required.
- Meets the 1% rule at list price ($2k rent vs $109k).
- Recommended offer: $106k (3.0% below list) — sets the bar for market timing.
- Cap rate 19.9% vs local median 2.5% in Everett — top-decile yield for the area; either an underpriced asset or a hidden risk that comps aren't pricing in. Stress-test before assuming the spread holds.
Location & tenants
- Location reads 73/100 on livability (#199 in WA) — a middle-class / working-renter tenant base. Strengths: commute A+, housing A, health & safety A; Watch: schools C-, crime D+, amenities F.
- Everett School District (urban): math 60% / reading 72% proficiency, ranked #26 of 291 in WA (top 9%) — acceptable for families but not a draw, mixed tenant base, ~2y average lease.
- Market conditions: Rents falling (-3.2%/yr); 275 active listings in the ZIP; 28 comparable units currently listed for rent nearby; rentals leasing fast (median 10d on market — plan ~1-2 weeks tenant-placement turnaround); solid renter incomes; 3,982 units permitted in Snohomish County in 2024 (1,492 in 5+ unit buildings).
Forward outlook
- Local home prices are declining (-3.0%/yr); year-one equity from $754 of loan paydown is wiped out by about $3k of value loss. Plan a longer hold.
- Snohomish County population projected at +30% by 2050 — long-run rental-demand tailwind backs the buy-and-hold thesis.
- At projected returns (-3.0% appreciation + 0.0% rent growth), your $31k cash investment doubles in ~3 years — after that, you're playing with house money.
Negotiation context
- It's been on market 44 days — a 3% lower offer ($106k) is reasonable based on typical stale-listing flexibility.
Questions for the listing agent
- It's been on market 44 days. Have you received any prior offers? Is the seller open to a 3% concession, seller financing, or rate buy-down credit?
- Built in 1971 — when were the roof, HVAC, electrical panel, plumbing, and water heater last replaced?
- Is there a deadline driving the sale (1031 exchange, divorce, estate, relocation)? That informs how much negotiation room exists.
- Crime grade is D in this area — have there been break-ins, vandalism, or insurance claims at this property in the last 3 years? What carrier currently insures it and at what premium?
- What's the average days-on-market for RENTAL listings here right now (not sales)? A rising rental-DOM trend means longer vacancies and softer asking-rent achievability than the comps imply.
- What's the recent tenant-quality profile in this submarket — average credit score on applications, eviction rate, late-payment / NSF rate, and stable-employment percentage? A property-management company in the area should have these aggregated.
- How much new for-sale + rental construction is in the pipeline within 1–3 miles? Heavy new supply typically softens prices + rents 12–24 months out; constrained supply supports both.
Investment metrics
- 1% rule
- 2.24% ✓
- Cap rate
- 19.94%
- Cash-on-cash
- 48.73%
- DSCR
- 3.17
- GRM
- 3.7
CMA / ARV
- ARV (median comp)
- $128,000
- List price
- $109,000
- Delta
- -14.84%
- Verdict
- UNDERPRICED
- Comps
- 9 within 1.0 mi
Show comp detail 12 sales within ~0.75 mi
| Address | Dist | Beds/Ba | Sqft | Sold | Price | $/sf | Match |
|---|---|---|---|---|---|---|---|
| 1415 84th St SE #192 | 0.00mi | 2/2.0 (-1) | 1,340 (-0%) | 9mo | $150,000 | $112 | 87 |
| 1415 84th St SE #63 | 0.00mi | 2/2.0 (-1) | 1,344 (0%) | 13mo | $130,000 | $97 | 84 |
| 1415 84th St SE #205 | 0.00mi | 2/2.0 (-1) | 1,426 (+6%) | 2mo | $128,000 | $90 | 83 |
| 1415 84th St SE #172 | 0.00mi | 2/2.0 (-1) | 1,424 (+6%) | 3mo | $80,000 | $56 | 82 |
| 1415 84th St SE #17 | 0.00mi | 2/2.0 (-1) | 1,368 (+2%) | 13mo | $197,950 | $145 | 81 |
| 1415 84th St SE #104 | 0.00mi | 2/2.0 (-1) | 1,242 (-8%) | 1mo | $75,000 | $60 | 81 |
| 1415 84th St SE #45 | 0.00mi | 2/2.0 (-1) | 1,240 (-8%) | 10mo | $65,000 | $52 | 74 |
| 1415 84th St SE #197 | 0.00mi | 2/2.0 (-1) | 1,440 (+7%) | 12mo | $115,000 | $80 | 73 |
| 1415 84th St SE #176 | 0.00mi | 2/2.0 (-1) | 1,436 (+7%) | 13mo | $186,000 | $130 | 72 |
| 1415 84th St SE #11 | 0.00mi | 2/2.0 (-1) | 1,200 (-11%) | 8mo | $145,000 | $121 | 71 |
| 1415 84th St SE #80 | 0.00mi | 2/2.0 (-1) | 1,194 (-11%) | 7mo | $140,000 | $117 | 70 |
| 1415 84th St SE #36 | 0.00mi | 2/2.0 (-1) | 1,152 (-14%) | 2mo | $150,000 | $130 | 69 |
Match score weights: distance 35% · size 25% · config 20% · recency 20%. Top-matched comps best support the ARV.
Projected returns pro-forma
-3.0% appreciation · 0.0% rent growth · sell at horizon
- IRR
- 42.9%
- Equity multiple
- 2.77×
- Total profit
- $54,107
- Equity at exit
- $16,252
- IRR
- 47.7%
- Equity multiple
- 4.97×
- Total profit
- $121,057
- Equity at exit
- $9,424
Cash invested: $30,520 (down + closing). Projections, not guarantees.
Landlord ↔ Tenant lean methodology
- Overall (STATE)
- 28 Tenant-Leaning
- State Washington
- 28 Tenant-Leaning · D+8
- County
- — inherits STATE
- City
- — inherits STATE
ZIP-level market 98208
- Rents YoY
- -3.2%
- Active inventory
- 275
- Price-to-rent
- 3.7×
Monthly cashflow live
- Estimated rent
- $2,446 high interval (Pro) →
- Mortgage (P&I)
- −$572
- Tax from tax record
- −$76 /mo · $913/yr
- Insurance
- −$45
- HOA
- −$0
- Vacancy / Maint / Mgmt
- −$514
- Net cashflow
- $1,239
Break-even live
UW: 25.0% down · 7.5% · 30yr · 1.5% tax · 5.0% vac · 8.0% maint · 8.0% mgmt
Financing live
Cash to close
- Down payment
- $27,250
- Closing costs
- $3,270
- Reserves months
- —
- Total cash needed
- —
Loan-product check · same deal, 3 products live
Conventional
25% down · 7.5% · 30yr
- Down + closing
- —
- Monthly P&I
- —
- Monthly cashflow
- —
- DSCR
- —
- Eligible?
- —
Personal DTI + credit; lowest rate.
DSCR
20% down · 8.5% · 30yr
- Down + closing
- —
- Monthly P&I
- —
- Monthly cashflow
- —
- DSCR
- —
- Eligible?
- —
No personal income docs; deal must DSCR.
Hard money
10% down · 12.0% · 12mo
- Down + closing
- —
- Monthly P&I
- —
- Monthly cashflow
- —
- DSCR
- —
- Eligible?
- —
Short-term bridge; refi at stabilization.
Rent comps 28 comps
| Address | Beds | Baths | Sqft | Rent | $/sqft | DOM | Units | Dist |
|---|---|---|---|---|---|---|---|---|
| 1224 Kossuth Ave Everett, WA | 2.0 | 1.0 | 1375 | $2,700 | $1.96 | 20d | 1 | 0.44mi |
| 9618 19th Ave SE Unit C Everett, WA | 3.0 | 3.0 | 1637 | $3,200 | $1.95 | 10d | 1 | 0.68mi |
| 233 Dorn Ave Unit 1 Everett, WA | 2.0 | 1.0 | 944 | $1,950 | $2.07 | 11d | 1 | 0.74mi |
| 8102 Evergreen Way Everett, WA | 1.0–5.0 | 1.0–2.0 | 1390 | $2,628 | $1.89 | 1d | 17 | 0.75mi |
| 115 Dorn Ave Everett, WA | 2.0 | 1.0–2.0 | 946 | $1,738 | $1.84 | 16d | 1 | 0.80mi |
| 618 75th St SE Everett, WA | 3.0 | 2.0 | 1232 | $2,400 | $1.95 | 11d | 1 | 0.86mi |
| 1915 75th St SE Unit 1H Everett, WA | 3.0 | 1.5 | 1300 | $2,500 | $1.92 | 24d | 1 | 0.89mi |
| 10101 7th Ave SE Everett, WA | 1.0–3.0 | 1.0–2.0 | 1073 | $2,805 | $2.61 | 2d | 16 | 0.90mi |
| 701 75th St SE Everett, WA | 1.0–3.0 | 1.0 | 820 | $2,075 | $2.53 | 5d | 5 | 0.92mi |
| 120 W Casino Rd Everett, WA | 1.0–2.0 | 1.0–1.5 | 818 | $1,993 | $2.43 | 2d | 13 | 1.00mi |
| 2319 75th St SE Everett, WA | 3.0 | 2.0 | 1112 | $2,745 | $2.47 | 24d | 1 | 1.00mi |
| 1304 Bruskrud Rd Everett, WA | 2.0 | 1.5–2.0 | 900 | $2,076 | $2.31 | 5d | 5 | 1.03mi |
| 120 SE Everett Mall Way Everett, WA | 1.0–2.0 | 1.0–2.0 | 813 | $2,172 | $2.67 | 2d | 43 | 1.13mi |
| 6911 Rainier Dr Unit 11-07 Everett, WA | 2.0 | 1.5 | 1008 | $2,095 | $2.08 | 5d | 1 | 1.13mi |
| 6911 Rainier Dr Unit 11-03 Everett, WA | 2.0 | 1.5 | 1008 | $1,695 | $1.68 | 24d | 1 | 1.13mi |
| 222 W Marilyn Ave Everett, WA | 3.0 | 1.0 | 1000 | $2,400 | $2.40 | 16d | 1 | 1.25mi |
| 8710 5th Ave W Everett, WA | 2.0 | 2.0 | 950 | $2,050 | $2.16 | 2d | 11 | 1.28mi |
| 8530 5th Ave W Everett, WA | 1.0–2.0 | 1.0 | 808 | $1,595 | $1.97 | 5d | 2 | 1.28mi |
| 9515 Holly Dr Unit 1 Everett, WA | 3.0 | 2.5 | 1600 | $3,000 | $1.88 | 43d | 1 | 1.32mi |
| 6801 Lombard Ave Unit B Everett, WA | 4.0 | 2.0 | 1460 | $3,200 | $2.19 | 2d | 1 | 1.33mi |
| 6609 Cady Rd Unit 2 Everett, WA | 2.0 | 1.5 | 1386 | $2,225 | $1.61 | 24d | 1 | 1.34mi |
| 702 W Casino Rd Everett, WA | 1.0–2.0 | 1.0–1.5 | 850 | $1,749 | $2.06 | 5d | 21 | 1.36mi |
| 9925 4th Ave W Apt 6 Everett, WA | 2.0 | 2.0 | 1000 | $1,445 | $1.45 | 2d | 1 | 1.39mi |
| 2505 Madison St Unit A Everett, WA | 3.0 | 1.0 | 1040 | $2,800 | $2.69 | 24d | 1 | 1.39mi |
| 2601 106th Pl SE Everett, WA | 3.0 | 2.0 | 1221 | $3,245 | $2.66 | 12d | 1 | 1.45mi |
| 2517 Howard Ave Everett, WA | 2.0–3.0 | 1.0 | 900 | $1,995 | $2.22 | 20d | 2 | 1.48mi |
| 10011 33rd Ave SE Unit B Everett, WA | 3.0 | 2.5 | 1650 | $2,850 | $1.73 | 3d | 1 | 1.49mi |
| 10011 33rd Ave SE Unit A & Everett, WA | 3.0 | 2.5 | 1625 | $2,850 | $1.75 | 3d | 1 | 1.49mi |
Listing history 12 events
-
2026-06-13status $109,000 Pending 44 DOM
-
2026-06-13days on market $109,000 Active 44 DOM
-
2026-06-09days on market $109,000 Active 41 DOM
-
2026-06-08days on market $109,000 Active 40 DOM
-
2026-06-07days on market $109,000 Active 39 DOM
-
2026-06-04days on market $109,000 Active 36 DOM
-
2026-06-03days on market $109,000 Active 35 DOM
-
2026-06-02days on market $109,000 Active 34 DOM
-
2026-06-01days on market $109,000 Active 33 DOM
-
2026-05-31days on market $109,000 Active 32 DOM
-
2026-05-19price $109,000
-
2026-04-29$116,000 Active
ⓘ Source: listings_history table (triggers on properties + properties_extension) + one-shot
backfill from property_details.listing_events for pre-trigger history.
Tax reassessment forecast WA · Resets to sale price
- Current annual tax
- $913 · $76/mo
- Projected year-2 tax
- $1,068 · $89/mo
- Expected delta
- +$155/yr (+$13/mo · 17.0%)
ⓘ Screening estimate from a state-policy table — verify with the county assessor before closing.
Nearby sold comps map
Loading sold comps map…
Walkable amenities ~0.75 mi
Loading nearby amenities…
Taxation est. · year 1
- Rental income
- $29,355
- − Mortgage interest
- −$6,106
- − Property taxes
- −$913
- − Insurance
- −$545
- − Repairs & maintenance
- −$2,348
- − Management
- −$2,348
- − Depreciation
- −$3,171
- Taxable income
- $13,923
- Est. tax owed @ 24.0%
- −$3,342
- After-tax cash flow
- $11,531/yr
For passive investors: Depreciation is non-cash, so a rental often shows a tax loss while cash-flowing — sheltering income. Rental losses are passive: they offset passive income freely, and up to $25,000/yr can offset ordinary (W-2) income if you actively participate and your MAGI is under $100k (phasing out to $0 by $150k); unused losses carry forward. On sale, claimed depreciation is recaptured at up to 25%, and gains may owe capital-gains tax (a 1031 exchange can defer both). Figures are a year-1 estimate at your 24.0% rate — not tax advice; consult a CPA.
Schools (NCES district)
- District
- Everett School District
- NCES district ID
- 5302670
- Math proficiency
- 60% ▲ 1.00%
- Reading proficiency
- 72% ▲ 1.00%
- Median HH income
- $66,815
- Composite
- 59.0/100
- National rank
- #1964
- State rank
- #26 of 291 in WA
Livability — Everett
- Score
- 73/100
- State rank
- #199
- US rank
- #5489
Category grades
Schools grade is shown separately in the Schools card above.
Census & demographics
- Census place
- Everett, WA
- County
- Snohomish County · 786,756 people
- City population
- 173,457
- Metro
- Seattle-Tacoma-Bellevue, WA
- Population (ZIP)
- 60,915
- Household income
- $103,705
- Rent vs Own
- Severe rent burden
- 1617.0
Population outlook (Snohomish County) Hauer SSP2
- Today (2025)
- 899,800 people
- By 2030
- 960,975 · +6.8%
- By 2040
- 1,074,447 · +19.4%
- By 2050
- 1,171,954 · +30.2%
- By 2075
- 1,384,849 · +53.9%
- By 2100
- 1,497,296 · +66.4%
Race, ethnicity, and origin ACS 2023
- Neighborhood character
- Diverse neighborhood (Simpson 0.65)
- Race & ethnicity
- White 55% Asian 17% Hispanic / Latino 14% Two or more races 13% Black 5%
- Hispanic origin (detail)
- Mexican 10%
- Common ancestry
- Portuguese 5% Italian 3% Slovak 2%
- Foreign-born
- 27% · Canada, Vietnam, South Korea
- Languages at home
- 66% English-only · Spanish 9% Vietnamese 4% Other Asian/Pacific 4%
Political lean MEDSL · Snohomish
- 2024 margin
- D (+19.0) · D 57.8% · R 38.9% · Other 3.3%
- 2008→2024 swing
- +0.1pp no change · 2008: 18.9pp · 2024: 19.0pp
- All cycles
- 2024: D+19.0 2020: D+20.6 2016: D+16.6 2012: D+16.2 2008: D+18.9
Not yet ingested
- Civics
- —
Market trends
- HPI YoY
- ▼ -884.74%
- Current HPI
- 337.856
- Rent YoY
- ▼ -3.16%
- Metro
- Seattle-Tacoma-Bellevue, WA
- State GDP YoY
- ▲ 4.65%
- F500 in state
- 22
Industry mix (Fortune 500 HQ in WA)
| Industry | F500 HQs | Revenue |
|---|---|---|
| Retail | 2 | $269B |
|
||
| Technology / Retail | 1 | $638B |
|
||
| Technology | 1 | $245B |
|
||
| Telecommunications | 1 | $38B |
|
||
| Food / Beverage | 1 | $36B |
|
||
| Automotive / Trucks | 1 | $34B |
|
||
Price history
-6.0% since first listed3 events — show timeline
- 2026-06-13 Pending — NWMLS as Distributed by MLS Grid
- 2026-05-19 Price Changed $109,000 NWMLS as Distributed by MLS Grid
- 2026-04-29 Listed $116,000 NWMLS as Distributed by MLS Grid
Property tax history
+7.5%/yrLatest (2026): $913 · +0.5% YoY. Source: county tax records.
Cash-flow waterfall
monthlySold comps — $/sqft
last 12 mo · ≤1 miLoading sold comps…